The price of agricultural land and its value are of importance when forming the production potential of agricultural enterprises. In some states, the price of land may represent up to 80% of property in agri-culture. The first research papers dealing with land were oriented on the use of land and the influence of land on the total production and the volume of profit. A later research was aimed at establishing the price of land and the present analyses therefore issues from the previous activities. An important number of these papers were written in the 60’s of the last century. In relation with the new formation of the Common
Agricultural Policy (CAP), the relation between the land rent and market price of agricultural land has been highlighted.
MATERIAL AND METHODS
The determination of the market price of land is derived from three basic attitudes creating the basis of the current method of land valuation. These methods are: the cost method, the comparison method and the income method. The costs approach method is based
The relations between the rent and price of agricultural
land in the EU countries
Vztahy mezi pachtovným a cenou zemědělské půdy ve státech EU
František STŘELEČEK, Jana LOSOSOVÁ, Radek ZDENĚK
Department Accounting and Finances, Faculty of Economics, University of South
Bohemia, České Budějovice, Czech Republic
Abstract: The price of agricultural land and its value are of importance when forming the production potential of agricultu-ral enterprises. The price of land marked an irregular development in the period 2006–2007 having increased in the majority of the EU states. The proportion of rent to the market price of land referred to as the capitalization rate kept varying within the range of 2–3%. The price of a site should, besides the land rent, also reflect the interest on the land rent received. The price of agricultural land with respect to the land rent manifests relatively important price inertia. This inertia in connection with a high growth rate of land rent results in the unrealistically high interest rate. Such situation is an evident advantage for land owners and is, on the contrary, a disadvantage for the tenants of the agricultural land. To make the interest rate realis-tic means especially stabilizing the land rent with low growth rates. These growth rates are different for different states. In general it can be maintained that the relative increase in land rent should not surpass 4%, exceptionally 6%.
Key words: price of land, land rent, capitalization rate, payback period
Abstrakt: Cena zemědělské půdy a její hodnota hrají důležitou úlohu při formování produkčního potenciálu zemědělských podniků. Cena půdy se v období 2000–2007 vyvíjela nerovnoměrně, u převážné většiny států EU se zvyšovala. Poměr pachtovného k tržní ceně půdy označovaný jako míra kapitalizace se pohyboval v rozmezí 2–3 %. Cena pozemku vedle výše pachtovného za určitý počet let by měla také odrážet zúročení přijatého pachtovného. Cena zemědělské půdy vzhledem k pachtovnému se vyznačuje poměrně významnou cenovou remanencí. Výsledkem této remanence při vysokém tempu růstu pachtovného je nereálně vysoká míra zúročení. Tato situace znamená jednoznačně výhodu pro vlastníky pozemků a naopak nevýhodu pro nájemce zemědělské půdy. Zreálnění úrokových sazeb spočívá především ve stabilizaci pachtovného s tempem růstu, které by nemělo přesáhnout 4 %, maximálně 6 %.
Klíčová slova: cena půdy, pachtovné, míra kapitalizace, doba návratnosti
on the fact that an informed buyer does not pay more than the costs he/she would pay for a property with comparable features. The sales comparison approach method is based on the comparison of the current market prices for which one can buy pieces of land with comparable features. In the Czech Republic, the “common price” corresponds to this method. This method relies on the application of price and sales data in a certain period of time. The income approach method is based on the capitalization of the income from the relevant piece of land.
Gwartney (2004) has broadened the methodology for the determination of the market price of land by other specific methods, among which the following belong:
(1) Sales Comparison Method. This method is based on the analysis of prices of vacant parcels, their mutual comparison with the view to obtain an appropriate price for the valued land. The author considers this method the best, if there are the corresponding data available.
(2) Proportional Relationship Method. This method relies on comparing the area of a site to a standard size of a site. The difference is expressed by the means of a proportion improving the price of a standard site.
(3) Land Residual Technique. This method presup-poses that the land is prepared for its appropriate use. All operating expenses and the revenue attrib-utable to other factors influencing production are deducted, and the net revenue is capitalized. (4) Allocation Method. The price is allocated to the
portion expressing the value of land and the por-tion expressing the improvements of the land. (5) Extraction Method. The value of land is estimated
on the basis of the difference between the known price of the land and the improvements carried out.
(6) Ground Rent Capitalization Method. This method is used when the land rent and market price of land are available.
(7) Subdivision Development Method. This method is based on the presumption that uncultivated land is valued as the cultivated and sold land. The costs for cultivating and other costs are subtracted from the sale price, and the net revenue is discounted over the estimated period required for the absorp-tion of costs of the cultivated sites.
Huang et al. (2006) have been dealing with the influence of factors not directly related to produc-tion. The explaining variables were the producti-vity of land, the size of the site, the distance from capitals, the urban-rural index, the density of farms,
income and inflation. They prove that the value of agricultural land increases with the land revenue, density of population and decreases with the size of the site, country character of the district and the distance from important city centres. Snyder et al. (2007) have developed the hedonic model of price in forestry in Northern Minnesota. In their model, they include besides the economic and social factors also the recreational functions of the forest and some commodity variables in their capacity of explain-ing variables. The variables – the accessibility and density of communications, the distance from the centres of population, location and the accessibility of water sources and exploitation of the contractual financing – had the most positive influence. Chavas and Shumway (1981) model the price of land as a function of the economic rent. They consider as the economic rent not only the land rent but also the maximum profit achieved. They express the price of land as a discounted flow of the economic rent in the individual years. In relationship to this procedure, they have formulated the one stage Gordon model with a constant growth rate.
Gwartney (2004) has been studying the compari-son of land rent with the market price of land. He based his method on the relationships between the following variables:
Capitalization rate (MK) = Land rent/Market price of land
Further relations derived from the equation:
Market price of land = (Land rent – Land tax)/ Capitalization rate
Land rent = Market price of land × Capitalization rate + Land tax
These relationships became the basis for valua-tion in the analytic part. The capitalizavalua-tion rate is a very sensitive indicator and its assessment requires a certain expertise. Therefore, the payback period is used besides the capitalization rate because it is a more instructive indicator,
Payback period = 1/Capitalization rate
Either static or dynamic method can be used for this calculation. In the static method, the number of years for covering the rent is a reciprocal capitalization rate value. The dynamic method calculates the time value of money and it allows for setting the number of years with regard to the required interest rate.
in the land market, prices of land and the changes in land rent after the enlargement of the EU. Boinon et al. (2007) analyzes the impact of the CAP on the land market and land rent. Patton et al. (2008) show that the decoupled direct payments, which are linked to land, fully capitalize into land rents. The results of simulations carried out up to 2030 by the means of the dynamic model of partial balance have shown that the growth of economics has a stronger impact on changes in the land use than the CAP (Ciaian 2007).
To find out the prices of the utilized agricultural area (UAA) in the EU in 2000 to 2008, the interest rate of the long term credit and the inflation rate, the public database EUROSTAT (EUROSTAT 2010) was used. Other data used such as the land rent, income from agricultural activity, leased land, revenues, costs and subsidies were found out by means of the database FADN which is the result of analyses of a wide spectrum of agricultural enterprises, the files of which contain in the individual member states from 1470 to 833 000 enterprises (EC 2010).
An average price of land is characterized in the methodologies of the EUROSTAT as the “managed agricultural land”, i.e. the land without structures or other entities (dung-pits, silage pits, field paths etc.). The methodology of the surveyed prices of land is based on an agreement between EUROSTAT and member states. The relation between the price of land and land rent is discussed every year in a
workshop meeting in Luxembourg. The calculation of average prices assumes the form of a weighted arithmetic mean where the weights are the sizes of the sites. The source of data is either the information of the owners selling their land (selling prices) or of the buyers buying the land in view of agricultural use (purchase prices). Real estate agencies may be an exception as they can sell the land bought also in the view of non-agricultural purposes. Selling and purchase prices are the prices in the public land mar-ket including the corresponding taxes and excluding the value added tax and some fees. The prices do not include the monetary compensations to farmers when selling the land.
RESULTS AND DIScUSSION
Price of land and its development in 2000–2008 in the selected states of the EU
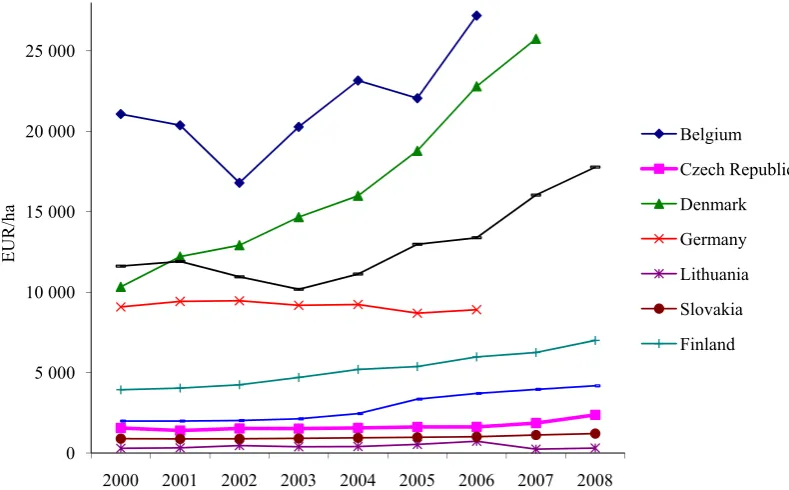
[image:3.595.99.494.483.728.2]The price of land developed unevenly in the pe-riod 2000–2008, it was increasing in most coun-tries (Figure 1). Germany showed a decrease in the land price. The annual growth rate oscillated from 100.5% (Malta) to 131% (Latvia). Several new member states have a very high growth rate, Latvia (131%), Romania (120.1%) (Table 1). The Czech Republic follows the medium growth rate of the prices of land (105.4%).
Figure 1. Development of prices of agricultural land Source: EUROSTAT
0 5,000 10,000 15,000 20,000 25,000
2000 2001 2002 2003 2004 2005 2006 2007 2008
EU
r
/h
a
The proportion of land rent and market price of land
The proportion of land rent to the market price of land is designated as the capitalization rate of agricultural land. Its reciprocal value, designated as
the payback period, is more instructive and it shows in how many years the price of land will be paid in the rent.
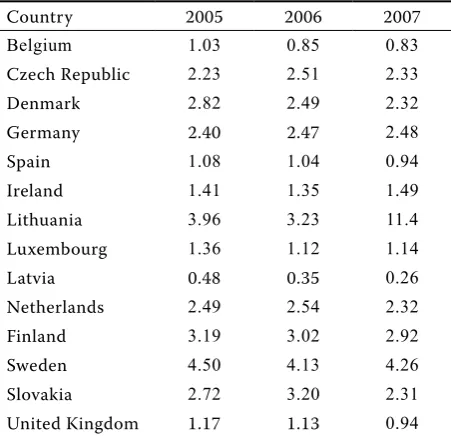
The capitalization rate moved in 2007 on the scale of 0.83% (Belgium) to 4.26% (Sweden). In six states (Czech Republic, Denmark, Germany, Netherlands, Finland and Slovakia), the capitalization rate oscil-lated within 2–3% (Table 2).
Between the capitalization rate and the payback period, there is an inverse proportionality relation-ship. States with a very low capitalization rate also show a very long payback period, e.g. Belgium has the capitalization rate of 0.83% and the payback period is 125 years; Spain and the United Kingdom have a higher capitalization rate (0.94%) and the payback period in these states is shorter (106 years). Lithuania has an extreme capitalization rate (11.45%) and the payback period is very short (8.73 years).
[image:4.595.64.538.83.367.2]The average capitalization rate can be derived from the dependence of rent on the price of land (Figure 2). The degree of this linear dependence expressed by the means of a correlation coefficient has the value of 0.84, which shows that there exists high statistic dependence. The average capitalization rate expressed by the regression coefficient is 1.71%. This infers that an average non-discounted payback period in the monitored EU states was almost 58 years in 2007.
Table 1. Development of the prices of agricultural land (EUR/ha)
2000 2001 2002 2003 2004 2005 2006 2007 2008 Growth rate
Belgium 21 069 20 372 16 795 20 273 23 155 22 053 27 190 1.043 Czech Republic 1 556 1 403 1 528 1 522 1 561 1 621 1 625 1 867 2 375 1.054 Denmark 10 330 12 211 12 920 14 669 15 995 18 787 22 791 25 745 1.139 Germany 9 081 9 427 9 465 9 184 9 233 8 692 8 909 0.997 Ireland 12 816 13 897 13 574 14 397 16 258 16 230 1.04 Spain 7 292 7 553 8 026 8 553 9 024 9 714 10 402 11 070 10 974 1.052
Italy 13 654 14 266 1.045
Latvia 546 526 1 031 2 301 3 591 5 055 2 759 1.310 Lithuania 294 321 468 390 406 536 734 241 311 1.007 Luxembourg 15 195 15 837 14 874 17 047 16 920 18 046 1.035
Malta 127 937 128 116 130 000 130 000 1.005
Netherlands 35 713 37 150 40 150 34 160 31 432 30 235 31 276 34 969 40 916 1.017
Romania 351 308 278 237 284 879 1.201
Slovakia 895 878 888 912 946 981 1 017 1 121 1 211 1.038 Finland 3 933 4 039 4 246 4 700 5 197 5 377 5 979 6 250 7 000 1.075 Sweden 1 989 1 988 2 019 2 126 2 455 3 351 3 706 3 957 4 181 1.097 United Kingdom 11 620 11 909 10 955 10 178 11 128 12 975 13 382 16 036 17 773 1.055
Source: EUROSTAT
Table 2. Capitalization rate of agricultural land (in %)
Country 2005 2006 2007
Belgium 1.03 0.85 0.83
Czech Republic 2.23 2.51 2.33
Denmark 2.82 2.49 2.32
Germany 2.40 2.47 2.48
Spain 1.08 1.04 0.94
Ireland 1.41 1.35 1.49
Lithuania 3.96 3.23 11.4
Luxembourg 1.36 1.12 1.14
Latvia 0.48 0.35 0.26
Netherlands 2.49 2.54 2.32
Finland 3.19 3.02 2.92
Sweden 4.50 4.13 4.26
Slovakia 2.72 3.20 2.31
United Kingdom 1.17 1.13 0.94
[image:4.595.64.290.515.733.2]The use of time factor in capitalization rate valuation
The price of a site should, besides the value of land rent for a certain number of years, also reflect the interest on the land rent received. The rate of the long term credit is relatively high in individual states and a question therefore arises whether the price is appropriate in comparison to this interest. In this relation, the calculation of the discounted payback period according to the following formula can be applied
݊ ൌ ܲ ܲെ ݎ ൈ ܥܲ ሺͳ ݎሻ
Where:
P0 = land rent in period 0
r = interest rate
CP0 = price of land in period 0
The equation has a solution if the capitalization rate is higher than the interest rate. This condition creates serious limitations. If we require all states to be credited by the same interest rate for the purposes of the calculation, then this rate must be smaller than the smallest capitalization rate. Should we exclude certain states from this analysis, then only 1% interest rate will be convenient for our purposes. In such a case, Table 3 presents the discounted payback period.
The payback period and the discounted payback period, respectively, of the sold agricultural land is quite uneven. It is possible to highlight the states of the average in terms of the payback period for which
the non-discounted payback period appears on the scale of 40–60 years. The payback period discounted by 1% is for these states 49–79 years. The minimum value is represented by Finland, the maximum value by Luxembourg. 6 states are designated as belong-ing to the average (the Czech Republic, Slovakia, Finland, the Netherlands, Germany and Denmark). States with an unclear land policy unambiguously are Latvia and Lithuania.
The impossibility to set the discounted payback pe-riod for certain interest rates is not the only problem of the discounted payback period. A problem with no less importance is the different dynamics of the payback period in dependence on the capitalization rate and on the interest rate. The relation between the capitalization rate, the interest rate and the payback period is presented in Figure 3.
The lower line of the discounted payback period is given by the number of years corresponding to the capitalization rate. The limit of the upper line of the discounted payback period for the given capitalization rate is the interest rate equal to the capitalization rate. A further analysis has proved that by a smaller capi-talization rate unit, the increase of interest rate infers a higher increase of the discounted payback period in comparison with a higher capitalization rate.
[image:5.595.105.478.72.296.2]If we wish to reach a real discounted payback period, then there is a very limited space for the choice of interest rate for the individual capitaliza-tion rates. For example for the capitalizacapitaliza-tion rate 0.05 and higher, we shall not reach a payback period longer than 100 years. On the other hand for the United Kingdom, the Czech Republic, Slovakia and
Figure 2. Dependence of the land rent on the price of land in the EU in 2007 Source: Prices of land – EUROSTAT, land rent – FADN
LT SK
LVMT CZ
ES UK
SE Fi LU
DE iE BE
DK
nL
y= 0.0171x+ 6.1128
R2= 0.7144
0 100 200 300 400 500 600 700 800 900
0 5,000 10,000 15,000 20,000 25,000 30,000 35,000 40,000
La
nd
re
nt
E
U
r
/h
a
Price of land EUr/ha
Germany, there is no problem to select such interest rate to have the discounted payback period longer than 100 years.
[image:6.595.65.534.85.404.2]To set the discounted payback period is the matter of subjective decision. In dependence on this fact, it is possible to program the price of land in such way
Table 3. Payback period
State
Agricultural land Arable land Pastures
capitaliza- tion rate
payback period
for interest rate capitaliza- tion rate
payback period
for interest rate capitaliza- tion rate rate
payback period for interest rate
1% 0% 1% 0% 1% 0%
Belgium 0.83 * 120.0 0.82 * 122.6 1.05 298.8 94.9
Bulgaria – – – 7.21 15.0 13.9 – – –
Czech Republic 1.83 79.3 54.6 – – – – – –
Denmark 2.32 56.7 43.1 2.16 62.6 46.4 1.75 85.3 57.2
Germany 2.48 51.9 40.4 – – – – – –
Spain 0.95 * 105.2 1.49 112.4 67.3 1.64 94.5 60.9
France – – – 2.97 41.3 33.7 – – –
Ireland 1.49 112.3 67.3 – – – – – –
Lithuania 8.85 12.1 11.3 – – – – – –
Luxembourg 1.07 273.7 93.4 – – – – – –
Latvia 0.48 * 210.3 – – – – – –
Netherlands 1.99 70.4 50.3 1.44 119.1 69.4 0.94 * 106.0
Poland – – – 2.95 41.6 33.9 4.53 25.1 22.1
Romania 9.09 11.7 11.0 – – – – – –
Finland 2.61 48.6 38.3 – – – – – –
Sweden 4.03 28.6 24.8 – – – – – –
Slovakia 2.14 63.5 46.8 – – – – – –
United Kingdom 0.85 * 117.8 – – – – – –
Source: EUROSTAT
– data are not available; *the calculation has no solution for the given interest rate
0.01
0.02
0.03
0.04 0.05
0.06 0.07
0.08 czech republic
germany Slovakia United Kingdom
0 50 100 150 200 250 300 350 400
0 0.01 0.02 0.03 0.04 0.05 0.06 0.07 0.08
Pa
yba
ck
p
er
io
d
(in
y
ea
rs
)
interest rate
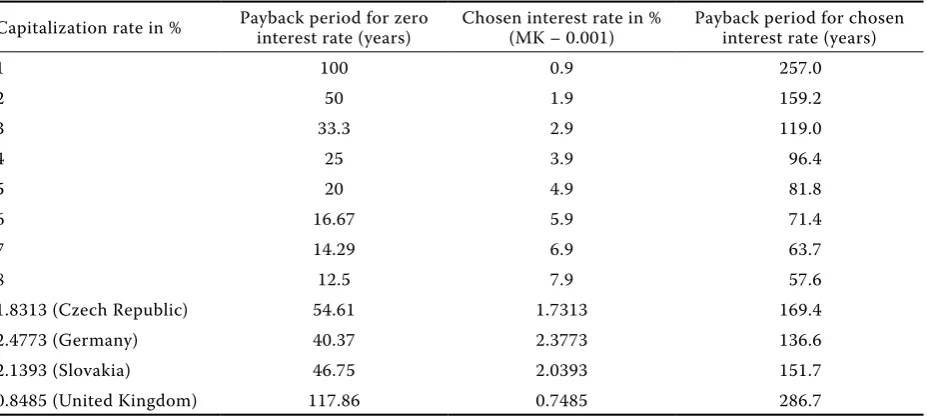
[image:6.595.82.496.504.747.2]as to achieve for the given capitalization rate the predetermined interest. However, the choice of the maximum level of the interest rate in dependence on the capitalization rate is limited. For example, we choose the discounted return period 50 years, which is close to the average payback period in the EU, then the maximum interest rates correspond-ing to individual capitalization rates are as follows (Table 4).
In dependence on the capitalization rate, the moni-tored states have a different possible maximum inter-est rate. This rate has proved fully inappropriate for the United Kingdom. It is acceptable for Germany, Slovakia, and the Czech Republic. States reaching a higher capitalization rate may also apply higher interest rates (Table 3).
Further models derived from the capitalization rate that can be applied are Gordon’s models. Chavas and Shumway (1981) suggest their application. One stage Gordon’s model is appropriate with a single continuous growth rate of the rent.
ܥܲൌܲሺͳ ݃ሻ ݎ െ ݃
The one stage Gordon model can also be applied to solve not only the price of land but also the dis-counted payback period
݊ ൌሺܥܲሺͳ ݃ሻሺݎ െ ݃ሻȀܲ
or acceptable interest rate
ݎ ൌܲሺͳ ݃ሻܥܲ
݃
Where:
CPn = price of land after n years
P0 = land rent paid in year 0
g = constant growth rate of land rent
r = interest rate
n = number of years.
Table 5 shows the value of interest rates in the long term credits in 2007. The above referenced analysis
Table 4. The difference in the maximum interest rate keeping the same payback period of 50 years
Capitalization rate in % Payback period for zero interest rate (years) Chosen interest rate in %(MK – 0.001) Payback period for chosen interest rate (years)
1 100 0.9 257.0
2 50 1.9 159.2
3 33.3 2.9 119.0
4 25 3.9 96.4
5 20 4.9 81.8
6 16.67 5.9 71.4
7 14.29 6.9 63.7
8 12.5 7.9 57.6
1.8313 (Czech Republic) 54.61 1.7313 169.4
2.4773 (Germany) 40.37 2.3773 136.6
2.1393 (Slovakia) 46.75 2.0393 151.7
0.8485 (United Kingdom) 117.86 0.7485 286.7
[image:7.595.64.533.630.744.2]Source: EUROSTAT
Table 5. The division of states according to the interest rate (in %) in long term credits
Interest rate in 2007 Country
4.0–4.25 Sweden (4.17), Germany (4.22)
4.25–4.50 Denmark (4.29), The Netherlands (4.29), Finland (4.29), Austria (4.30), The Czech Republic (4.30), France (4.30), Ireland (4.31), Spain (4.31), Belgium (4.33), Portugal (4.42), Cyprus (4.48), Italy (4.49), Slovakia (4.49), Greece (4.50)
4.50–4.75 Slovenia (4.53), Bulgaria (4.54), Lithuania (4.55), Luxembourg (4.56), Malta (4.72) 4.75–5.0
above 5.0 United Kingdom (5.06), Latvia (5.28), Poland (5.48), Hungary (6.74), Romania (7.13)
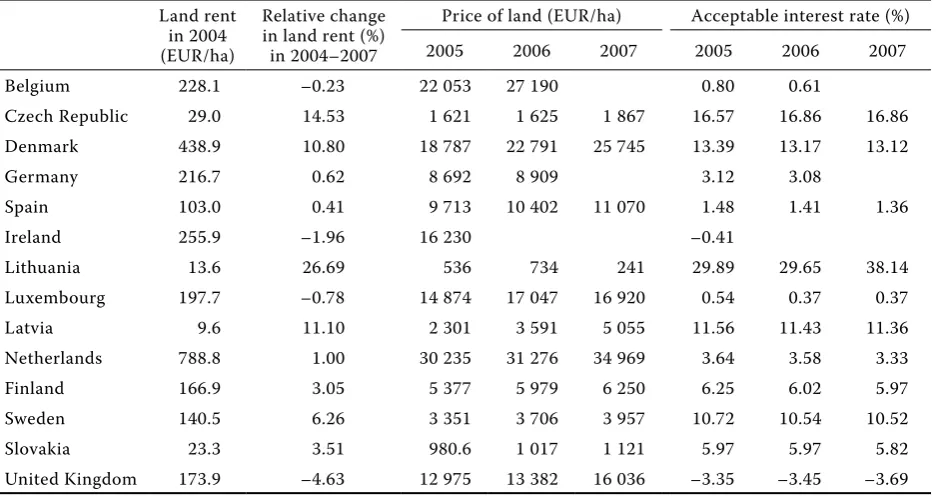
proves that for the given relations of prices and land rent, the possibility to achieve a corresponding inter-est is unrealistic. Table 6 gives the calculation of the real interest rate in years 2005–2007 for the chosen states of the EU.
The acceptable interest rates carried out by the comparison of the growth the rate of land rent and prices of land indicate a major imbalance, from the interest rates of an incredibly high value to completely unsatisfactory ones. It is very probable to maintain that the growth rate of prices will always be less flex-ible compared to the growth rate of the land rent, which will always infer a disproportionate growth of the interest rate.
criteria for the relationship of land rent and price of land
The analysis of the individual criteria was carried out so that first the formula for the modified price of land was derived for which the given criterion would apply; next the price of land in the chosen EU states was calculated according to the given criterion. The land rent and the price of land in 2007 and the average growth rate in 2004–2007 were applied as the basis. Then by the means of a model, the modi-fied price for static payback period was calculated. The comparison of this modified price for the static payback period with the real price in 2007 showed the reality potential of the individual criteria.
Influence of the growth rate of the land rent to the modified price of land
This criterion presupposes that the growth rate of the land rent will not influence the interest rate but only that the dynamics of the land rent will be balanced by the dynamics of the price of land. In general, however, we suppose that the payback pe-riod will be static. The discounted modified price is the modified price for the static payback period discounted by the interest rate of long term credits. The comparison UCP and CP was used to confirm whether this criterion functions in reality. To follow this criterion infers that the modified price of land in the payback period will be calculated according to the relation
ܷܥܲ ൌ ܲሺͳ ݎሻሺͳ ݃ሻ ே
ୀଵ
[image:8.595.65.536.85.333.2]
The Table 7 applies the modified prices of land in 2007 maintaining the growth rate of land rent in years 2004–2007 according to the above referenced criteria. Regarding the discounted modified price of land, maintaining the greater growth rate in not realistic as the discounted modified price of land is several times greater compared to price in 2007. First of all, this disproportion was noticed in the Czech Republic with the discounted modified price of land 14.23 times greater compared to 2007. A similar increase occurred in Denmark with the discounted modified
Table 6. Acceptable interest rates
Land rent in 2004 (EUR/ha)
Relative change in land rent (%)
in 2004–2007
Price of land (EUR/ha) Acceptable interest rate (%) 2005 2006 2007 2005 2006 2007
Belgium 228.1 –0.23 22 053 27 190 0.80 0.61
Czech Republic 29.0 14.53 1 621 1 625 1 867 16.57 16.86 16.86 Denmark 438.9 10.80 18 787 22 791 25 745 13.39 13.17 13.12
Germany 216.7 0.62 8 692 8 909 3.12 3.08
Spain 103.0 0.41 9 713 10 402 11 070 1.48 1.41 1.36
Ireland 255.9 –1.96 16 230 –0.41
Lithuania 13.6 26.69 536 734 241 29.89 29.65 38.14 Luxembourg 197.7 –0.78 14 874 17 047 16 920 0.54 0.37 0.37 Latvia 9.6 11.10 2 301 3 591 5 055 11.56 11.43 11.36 Netherlands 788.8 1.00 30 235 31 276 34 969 3.64 3.58 3.33 Finland 166.9 3.05 5 377 5 979 6 250 6.25 6.02 5.97 Sweden 140.5 6.26 3 351 3 706 3 957 10.72 10.54 10.52 Slovakia 23.3 3.51 980.6 1 017 1 121 5.97 5.97 5.82 United Kingdom 173.9 –4.63 12 975 13 382 16 036 –3.35 –3.45 –3.69
price of land 4.95 times greater compared to 2007. Netherlands, Finland and Slovakia reported slower growth rates (from 1 to 3.6%). Such slow increase of the rent growth rate caused that the discounted modified price of land was lower compared to 2007. Such misbalance of the land price dynamics leads to advantages for the buyers in the states with great rent growth rates and to advantages for the purchasers in the states with low rents.
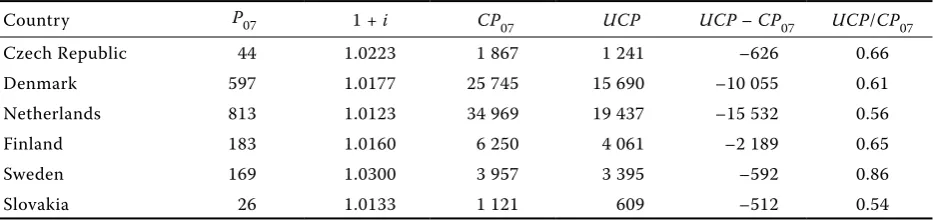
Influence of the inflation rate to the modified price of land
The basic requirement to the discounted price of land is not to be unfavourably influenced by the in-flation rate. Then, it is convenient to follow how the price of land will be influenced by the rate of inflation. It revealed that in case of the inflation growth rat of less than 5%, the price of land does not have to be increased for a static payback period. The inflation rate is covered by the capitalization rate. The infla-tion influence will be assessed also by comparing the prices of 2007 in relation to the discounted modified price for the static payback period discounted by the interest rate of long-term credits. The discounted modified price is equal to
ܷܥܲ ൌ ܲሺͳ ݎሻሺͳ ݅ሻ ே
ୀଵ
The application of an average inflation rate in 2004–2007 to the whole static payback period does not disturb the development of land prices. To the contrary, an average inflation growth rate is lower than the capitalization rate so that for such growth rate, lower prices than in 2007 are sufficient. For all states in the table, the application of the inflation rate within other conditions remaining constant would bring a decrease of prices. Compared to 2007 price, the discounted modified price was lower by 14–46%. In the Czech Republic, the situation was positive as well. The discounted modified price was lower by 34% compared to 2007 price of land (Table 8). A low average inflation rate connected to lower price means also a lower capitalisation rate and a longer discounted payback period as a result.
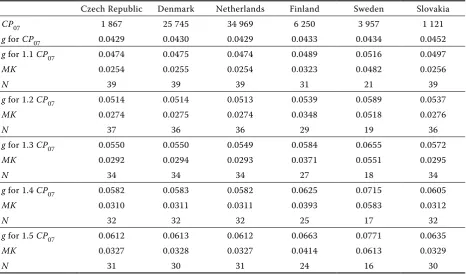
Acceptable growth rates of land rent including inflation rates for different price variants
The influence of the previous two criteria revealed the question of the acceptable average growth rate of the land rent within the given capitalization rate that would not change the price of land or the increase would be acceptable. The Table 9 presents the ac-ceptable growth rates of the land rent for 2007 price and 1.1–1.5 multiples of this price.
[image:9.595.64.535.84.190.2]Within the states in our comparison, the 2007 price has lead to a balanced average growth rate ranged
Table 7. Modified price of land for g (prices in EUR)
Country P07 g CP07 UCP UCP – CP07 UCP/CP07
Czech Republic 44 0.145 1 867 26 573 24 705 14.23
Denmark 597 0.108 25 745 12 7381 101 636 4.95
Netherlands 813 0.010 34 969 18 694 –16 275 0.53
Finland 183 0.031 6 250 5 078 –1 172 0.81
Sweden 169 0.063 3 957 4 970 1 013 1.26
Slovakia 26 0.036 1 121 922 –198 0.82
Source: EUROSTAT and FADN, own calculation
Table 8. Modified price of land for i (prices in EUR)
Country P07 1 + i CP07 UCP UCP – CP07 UCP/CP07
Czech Republic 44 1.0223 1 867 1 241 –626 0.66
Denmark 597 1.0177 25 745 15 690 –10 055 0.61
Netherlands 813 1.0123 34 969 19 437 –15 532 0.56
Finland 183 1.0160 6 250 4 061 –2 189 0.65
Sweden 169 1.0300 3 957 3 395 –592 0.86
Slovakia 26 1.0133 1 121 609 –512 0.54
[image:9.595.65.532.637.747.2]from 4.29% to 4.52%. A balanced capitalization rate was reflected in the balanced payback period (43 years in the Czech Republic; 43 years in Denmark; 43 years in the Netherlands; 34 years in Finland; 23 years in Sweden and 43 years in Slovakia). Supposing a normal development, i.e. prices of 2007 increased by 50%, the capitalization rate of all states with the exception of Sweden would range from 3.2 to 4.1% and the payback period would be also rather bal-anced (Table 9). An average growth rate of the land rent greater than 5 would start an excessive increase of the prices of land or it could cause a misbalance of the development of the land rent and the price of land. Such situation would be acceptable only temporarily and it could cause a slowdown of the land trade.
cONcLUSION
The years 2005-2007 are characterized by different prices of land and different dynamics thereof in the individual states. The annual growth rate was oscillat-ing from 100.5% (Malta) to 131% (Latvia). The Czech Republic adheres to the mean trend in the pace of growth of the prices of land (105.4%).
The capitalization rate varied on the scale from 0.83% (Belgium) to 4.26% (Sweden) in 2007. In
six states (Czech Republic, Denmark, Germany, Netherlands, Finland and Slovakia), the capitaliza-tion rate moved on the scale of 2–3%. An average capitalization rate expressed by the regression coef-ficient is 1.74%. This implies that the non-discounted payback period in the monitored EU states was 58 years in 2007.
The payback period and the discounted payback period of the sold agricultural land, respectively, is considerably imbalanced. The average states can be quite plainly designated. For these states, the non-discounted payback period lies within the range of 40–60 years. For these states, the discounted pay-back period by one percent lies within the range of 49–79 years. Finland represents the minimum value, Luxembourg the maximum value. Six states belong to the states of the average level (Czech Republic, Slovakia, Finland, the Netherlands, Germany and Denmark). States the land policy of which is unclear include Latvia and Lithuania.
Acknowledgements
[image:10.595.65.532.84.359.2]This study was supported by the grant No. QH82162 from the Ministry of Agriculture of the Czech Republic “Possibilities of Agricultural Land Defragmentation”.
Table 9. Average growth rates of land rent for 2007 prices and their multiples
Czech Republic Denmark Netherlands Finland Sweden Slovakia
CP07 1 867 25 745 34 969 6 250 3 957 1 121
g for CP07 0.0429 0.0430 0.0429 0.0433 0.0434 0.0452
g for 1.1 CP07 0.0474 0.0475 0.0474 0.0489 0.0516 0.0497
MK 0.0254 0.0255 0.0254 0.0323 0.0482 0.0256
N 39 39 39 31 21 39
g for 1.2 CP07 0.0514 0.0514 0.0513 0.0539 0.0589 0.0537
MK 0.0274 0.0275 0.0274 0.0348 0.0518 0.0276
N 37 36 36 29 19 36
g for 1.3 CP07 0.0550 0.0550 0.0549 0.0584 0.0655 0.0572
MK 0.0292 0.0294 0.0293 0.0371 0.0551 0.0295
N 34 34 34 27 18 34
g for 1.4 CP07 0.0582 0.0583 0.0582 0.0625 0.0715 0.0605
MK 0.0310 0.0311 0.0311 0.0393 0.0583 0.0312
N 32 32 32 25 17 32
g for 1.5 CP07 0.0612 0.0613 0.0612 0.0663 0.0771 0.0635
MK 0.0327 0.0328 0.0327 0.0414 0.0613 0.0329
N 31 30 31 24 16 30
REfERENcES
Boinon J.P., Kroll J.C., Lepicier D., Leseigneur A., Viallon J. B. (2007): Enforcement of the 2003 CAP reform in 5 countries of the West European Union: Consequences on land rent and land market. Agricultural Economics – Czech, 53: 173–183.
Buday S. (2007): Agricultural land market in Slovakia. Agricultural Economics – Czech, 53: 146–153. Chavas J.P., Shumway C.R. (1981): A pooled time-series
cross-selection analysis of land prices. American Journal of Agricultural Economics, 63: 1049–1049.
Ciaian P. (2007): Land use changes in the EU: Policy and macro impact analysis. Agricultural Economics – Czech,
53: 565–579.
European Commission: The Farm Accountancy Data Net-work (FADN): standard results [on-line]. Available at http://ec.europa.eu/agriculture/rica/ (accessed 2010-03-01).
EUROSTAT: Annual average inflation rate [on-line]. Avail-able at http://epp.EUROSTAT.ec.europa.eu/tgm/tAvail-able. do?tab=table&init=1&plugin=0&language=en&pcode= tsieb060 (accessed 2010-05-13).
EUROSTAT: Long-term interest rates [on-line]. Available at http://epp.EUROSTAT.ec.europa.eu/portal/page/portal/ interest_rates/data/database (accessed 2010-05-13).
EUROSTAT: Selling prices of agricultural products (abso-lute prices), land prices and rents [on-line]. Available at http://epp.EUROSTAT.ec.europa.eu/portal/page/portal/ agriculture/data/database (accessed 2010-01-21). Gwartney T. (2004): Estimating land values [on-line].
Avail-able at http://www.henrygeorge.org/ted.htm, (accessed April 2004).
Hamza E., Miskó K. (2007): Characteristics of land market in Hungary at the time of the EU accession. Agricultural Economics – Czech, 53: 161–168.
Huang H., Miller G. Y., Sherick B. J., Goméz M. I. (2006): Factors influencing Illinois farmland values. American Journal of Agricultural Economics, 88: 458–470. Němec J., Kučera J. (2007): Land market development after
the accession to EU. Agricultural Economics – Czech,
53: 154–160.
Patton M., Kostov P., McErlean S., Moss J. (2008): Assessing the influence of direct payments on the rental value of agricultural land. Food Policy, 33: 397–405.
Snyder S.A., Kilgore M.A., Hudson R., Donnay J. (2007): Determinants of forest land prices in Northern Min-nesota: A hedonic pricing approach. Forest Science,
53: 25–36.
Arrived on 29th September 2010
Contact address:
František Střeleček, Jana Lososová, Radek Zdeněk, University of South Bohemia in České Budějovice, Faculty of Economics, Studentská 13, 37 005 České Budějovice, Czech Republic