JOURNAL OF FOREST SCIENCE, 53, 2007 (2): 57–65
Not many clonal tests with wild cherry have been established within the EU countries up to this date. The quality of the timber and the growth rate are the key characteristics for a high economic return in cherry plantations. Considerable variation in these traits has been observed both between and within populations. That is why selection combined with appropriate propagation method offers great opportunities for tree improvement, resulting in high economic return through efficient hardwood silviculture. Key advantage in clonal testing of wild cherry is that it requires a relatively short time (Kleinschmit 1999).
France is the leading country in breeding of wild cherry in Europe. Height and breast diameter were measured periodically up to seven years at three progeny trials of wild cherry. Genotype by site inter-action was quite high for the stem height increment. Expected relative genetic gains were estimated for the stem height increment to be between 8% and 13% of the trait mean (Muranty et al. 1998). 7-year-old clonal test with 33 clones provided the first estimates of genetic parameters and potential gains from clonal selection. An ecovalence analysis of the site by clone interaction showed that for each trait a high propor-tion of clones and sites were weakly interactive. Fol-lowing weak selection intensity, genetic gain of 11%
for stem height was obtained. Six clones are now included on the certification list. They are the first clonal varieties of wild cherry officially available in the EU countries (Santi et al. 1998). In Belgium a 10-year-old clonal trial of 19 selected clones of wild cherry was planted. Observations were recorded for height at 1, 4, and 9 years after planting; additional traits included height increment, breast diameter, stem straightness, and forking. Expected genetic gains were high for the most of the traits, often great-er than 7%. The tallest group of clones had a highgreat-er diameter and straighter stems but also tended to be more forked. A significant clone by site interaction was observed for height (Curnel et al. 2003).
Intensive research on micropropagation of wild cherry is a relatively recent activity. There is still relative lack of knowledge of the growth, particularly the development of plants in outdoor conditions. So far, differences between vegetatively and generatively propagated trees of wild cherry were not observed (Cornu, Chaix 1981; Hammatt 1999).
In the Czech Republic, some research on wild cherry occurrence in forest stands and its potential use in forest tree breeding has been conducted. First results reporting tree growth in clonal tests were pre-sented by Kobliha (2002). In the Czech Republic, current activities are focused on establishing new
First evaluation of growth parameters in clonal test
with wild cherry
M. Hajnala, M. Lstibůrek, J. Kobliha
Faculty of Forestry and Environment, Czech University of Life Sciences in Prague, Prague,
Czech Republic
ABSTRACT: A 6-year-old clonal trial with 13 clones of wild cherry (Prunus avium L.) was evaluated during the summer of 2004 at 6 different sites in the Czech Republic. Observed traits were the stem height, stem diameter, health status, and mortality. The mixed linear model was implemented with either independent or the autoregressive error struc-ture. The later provided better fit to the data. At this age, only one clone outperformed the remaining ones in volume production. Suggestions for future research activities are provided that should lead to the establishment of long-term breeding programs with wild cherry in the Czech Republic.
seed orchards and the evaluation of clonal tests. The main point of interest should be the prediction of individual breeding values for the next selec-tion. Clonally replicated progenies should provide individual breeding values for generation breeding as well as individual clonal values for direct clonal deployment (Xiang, Li 2001, 2003).
The main objective of this study is to analyze clonal trial established in 6 different locations in the Czech Republic and consequently propose future research activities in this species. The second goal is to provide some methodical guidance to facilitate the establishment and analysis of future clonal tests.
MATERIAL AND METHODS
Clonal tests
Clonal tests were established with clones of wild cherry plus trees. The plus trees were vegetatively propagated at the Biotechnology Laboratory in Olešná. The buds were separated and cultivated in vitro. They were sequentially cultivated in grow-ing medium and developed into container-grown plants. Clonal tests were planted in the period of 2000–2001 in 11 locations at three forest districts in the South Bohemia (Pelhřimov, Český Krumlov and Kaplice). Only six of these tests have been declared usable following the initial evaluation (insufficient documentation, maintenance problems). Individual clones were planted in adjacent rows; each row was composed of ramets of the same clone. Each test was fenced. The purpose of this clonal trial was to test the quality of selected wild cherry plus trees. The same clones were used in young seed orchards established in 2000 and 2001.
Data set
Growth traits were measured during the late sum-mer of 2004 (height [cm] and stem diameter [mm]). The stem diameter was measured at the base of the stem and not in the standard breast height (1.3 m) due to the young age of clones. Survival and health conditions of individuals were also monitored.
General statistical model
The following general linear mixed model was assumed:
Y = Xβ + Zu + e (1)
u ~ N(0, G) e ~ N(0, R) Cov (u, e) = 0
where: Y – denotes the n × 1 vector of observations (height or diameter),
X – n × p design matrix associating observations with the appropriate combination of fixed ef-fects,
β – p × 1 vector of fixed effects,
Z – n × q design matrix associating observations with the appropriate combination of random effects,
u – q × 1 vector of random effects,
e – n × 1 vector of residual errors.
Observations were assumed normally distributed, the means were assumed linearly related to the model effects, and the errors were either assumed independ-ent or correlated (see alternative models below) with homogeneous variance among the error terms.
Much has been published on the utility of mixed models, historical overview is provided by Hender-son (1990) or Searle et al. (1992). Here we only short-ly outline the general solution to the mixed-model equations, which is applicable in all models considered throughout this study. Given the introduced general mixed model framework, parameters to be estimated from the data are the vector β and all unknown com-ponents in the variance-covariance matrices G and R. Restricted maximum likelihood is used to estimate the variance-covariance matrix V, where
V = ZGZ‘ + R (2)
The generalized least squares equations are then solved to estimate fixed effect parameters (vector b refers to the estimate of β):
X‘V–1Xb = X‘V–1y (3)
Due to the lack of experimental replications (blocking structure), two alternative approaches were utilized in order to investigate the performance of individual clones. Retrospective power calcula-tion was performed. There are theoretical reasons that do not support such an analysis (e.g. Hoenig, Heisey 2001). It was therefore useful to vary some components that enter the power calculation, rather than focusing on the absolute resulting power. The sensitivity analysis suggested which location may or may not be appropriate with respect to the sample size. It became evident that a single site analysis at two locations would not yield sufficient control over the type II error rate. That constitutes another argu-ment (beyond the lack of blocking) why all data were combined and analyzed simultaneously.
Randomized block design model
utilizing random effects and a Z matrix. Here it was assumed that each site constitutes an independent replication (block) of an experiment, therefore the term block refers to the location (total of 6, see Table 1a). It was assumed that clones had a fixed effect, while blocks had a random effect (the goal was to compare means of individual clones; blocks were assumed to be independent random samples from a population of blocks). The design matrix X provided a link between clonal fixed effects (vec-tor β) and appropriate phenotypic responses in Y. Similarly, each observation was structured within a given replication of an experiment. Coefficients in the matrix Z assigned each observation in Y to the appropriate block (vector u). This resulted in the compound-symmetry structure, where observations within the same block shared a common covari-ance due to a hypothesized constant environment within blocks, while observations among blocks were assumed independent. Using the terminology introduced above, the covariance matrix G was G = σ 2
b
It, and the covariance of experimental errors R was R = σ 2I
tr , where I is the identity matrix. 1 … … 0
R = σ2
[
1 0]
(4) 00 … … 1
Spatial model
Second, a marginal model (model “M2”) was as-sumed. In this model, there was no Z matrix and all covariance structures were modelled through the error variance-covariance matrix R. In the analysis, 6 independent R structures were assumed, each capturing specific variance-covariance structure of error terms within individual locations. In forest genetic trials, the 1st order autoregressive correla-tion models seem to be suitable in many situacorrela-tions (Dutkowski et al. 2002). This model (abbreviated as “AR1”) is of the following algebraic form: (1) diagonal elements: Ci,i = 1, (2) off-diagonal elements: Ci+1,i =φ1, and Ci,j = φ1ci–1,j,where i > j + 1, and φ is the autocorrelation parameter (to be estimated from the data). The overall R structure is then composed of 6 independent structures of the following form:
1 φ φ2 φ3
R =
[
φ 1 φ φ2]
(5) φ2 φ 1 φφ3 φ2 φ 1
[image:3.595.66.532.84.406.2]In this model, it is therefore assumed that closer observations tend to be more similar, because trees planted in closer proximity share a common environ-ment as opposed to more distant trees.
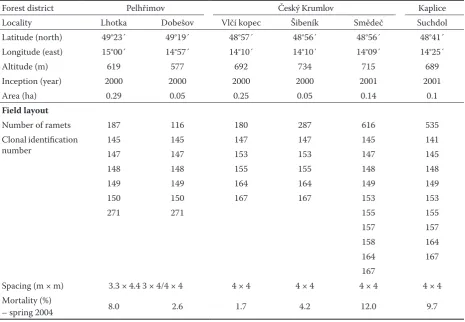
Table 1a. Details of field plantations – the main information and parameters are presented. Irregular spacing was used at locations Lhotka and Pelhřimov
Forest district Pelhřimov Český Krumlov Kaplice
Locality Lhotka Dobešov Vlčí kopec Šibeník Smědeč Suchdol
Latitude (north) 49°23´ 49°19´ 48°57´ 48°56´ 48°56´ 48°41´
Longitude (east) 15°00´ 14°57´ 14°10´ 14°10´ 14°09´ 14°25´
Altitude (m) 619 577 692 734 715 689
Inception (year) 2000 2000 2000 2000 2001 2001
Area (ha) 0.29 0.05 0.25 0.05 0.14 0.1
Field layout
Number of ramets 187 116 180 287 616 535
Clonal identification
number 145147 145147 147153 147153 145147 141145
148 148 155 155 148 148
149 149 164 164 149 149
150 150 167 167 153 153
271 271 155 155
157 157
158 164
164 167
167
Spacing (m × m) 3.3 × 4.4 3 × 4/4 × 4 4 × 4 4 × 4 4 × 4 4 × 4
Mortality (%)
– spring 2004 8.0 2.6 1.7 4.2 12.0 9.7
… …
Mixed model analysis
Integral part of the analysis was the mixed model diagnostics performed with each model evaluated in this study; remedial measures were undertaken when necessary. The initial analysis was conducted in SAS© System; Procedure MIXED (Littell et al. 2006). Output from this procedure was presented in tables along with the description, summarizing the base design model (M1). Multiple-comparison of individual clonal means (height, diameter) was performed in Procedure GLIMMIX, retaining the M1 model for the sake of simplicity. This procedure was selected as it features an experimental graphical out-put (diffogram), displaying all pair-wise differences among least-square means along with corresponding confidence intervals. Nevertheless, the syntax and model features were equivalent to that of Procedure MIXED. Multiple-comparison method was of the type described by Westfall (2002). The multiple-comparison is an option in the GLIMMIX Procedure. It has the ability to maintain the declared overall Type I error rate within the mixed-model framework.
Models were then evaluated with ASReml© statisti-cal software (Gilmour et al. 1999, 2002). Using this software, the fit of alternative models was compared. Using both models, treatment (clonal) means were estimated along with their respective standard errors and presented in Table 5.
RESULTS
During the field measurement, trees were already taller than the competing vegetation, and it was con-cluded that weedy species had no significant effect on the observed mortality – the mortality ranged from 1.7% (location Vlčí kopec) to 12.0% (location Smědeč). Clones “141” and “158” were dropped from the analysis due to the low number of replicates.
Model M1
[image:4.595.65.531.72.269.2]The estimates of variance components parameters for both traits are provided in Table 2. Estimates of the location, the location by clone interaction, and the residual variance components are given in the Table 1b. Origin clones – forest area and plantation number where the clones were got from
Clonal identification number Forest area Plantation number Year of appreciation
145 Nové Hrady FE 71 B3 1995
147 Nové Hrady FE 71 B3 1995
148 Nové Hrady FE 71 B3 1995
149 Nové Hrady FE 71 B3 1995
150 Nové Hrady FE 71 B3 1995
153 Nové Hrady FE 71 B3 1995
155 Zbytiny M 122 H1 1995
157 Zbytiny M 122 H1 1995
164 Zbytiny M 122 H1 1995
167 Zbytiny M 122 H1 1995
271 Nové Hrady FE 71 B5 1995
FE – Forest Enterprise, M – Municipality
Table 2.Covariance parameter estimates – height (upper) and diameter (lower)
Covariance
parameters Estimate Standard error Z value Pr Z Alpha Lower Upper
Location 4,971.73 3,315.73 1.50 0.0669 0.05 1,864.11 34,489.00
Location × clone 970.74 322.00 3.01 0.0013 0.05 555.55 2,113.26
Residual 2,337.24 85.24 27.42 < 0.0001 0.05 2,178.76 2,513.74
Location 24.18 16.56 1.46 0.0720 0.05 8.89 180.95
Location × clone 7.34 2.44 3.01 0.0013 0.05 4.20 16.03
[image:4.595.64.532.629.757.2]second column along with the respective standard errors in the third column. The standard errors refer to the approximate standard errors of the covariance parameter estimates (square roots of the diagonal elements of the observed inverse Fisher informa-tion matrix). The Z value column is the estimate divided by its approximate standard error, and the Pr Z column is the one- or two-tailed area of the standard normal curve outside of the Z-value (SAS Institute Inc., 2004). The last two columns present 95% confidence intervals (lower and upper) of the covariance parameter estimates. The location by clone interaction is influential in this data set in both traits.
The test of fixed effects (clones in this study) is presented for both traits in Table 3. The F-statistics can be used to test the null hypothesis (all clonal means are equal). In this case, the null hypothesis is rejected and the alternative hypothesis (all clonal means are not equal) is concluded at the 5% prob-ability of the type I error. Given that the true clonal means were equal, then an F-value as large as 4.22 (5.02) would occur less than 20 (7) times in 10,000 by chance. The probability of type II error based on the retrospective analysis is very small too (power of the combined analysis greater than 99%; computational details not presented here).
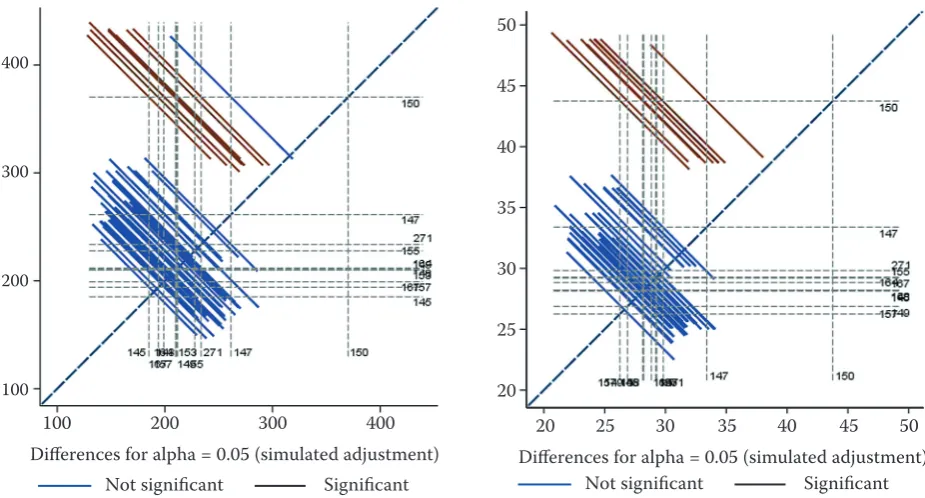
Graphical output (diffogram), presenting the multiple-comparison of clonal means is provided in Fig. 1.
During the first assessment of the experimental trial, only the top-ranking clone (150) had a sig-nificantly higher height and diameter compared to all other clones (except for height of clone 147). In all remaining pair-wise comparisons, there were no significant differences between clones in both traits.
Spatial analysis
Alternative models (M1, M2) were fitted in the ASReml© statistical software (Gilmour et al. 1999, 2002). Main output of the analysis is presented in Table 4.
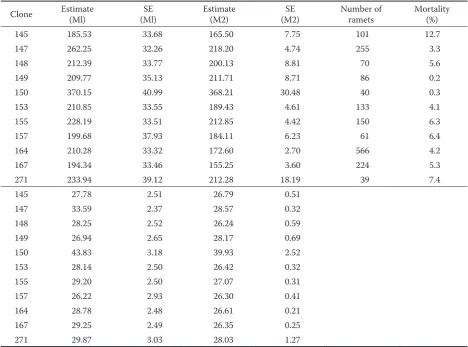
Estimates of clonal means are presented in Table 5. Clones were sorted by means in descending order. Clonal mortality was calculated across all locations. The means and standard errors are compared to the basic M1 model presented above.
DISCUSSION
[image:5.595.66.529.431.680.2]Clones analyzed in the present study were treated as factors with fixed effects. The conclusions (e.g. the
Fig. 1. The diffogram for height (left) and diameter (right) of individual clones with simulated multiplicity adjustment. All pair-wise comparisons are presented in the figure. The 45° reference line indicates whether the two least-square means are significantly different. Each line drawn at an intersection of two means corresponds to the 95% confidence interval of the difference of the two least-square means in the comparison. If the interval crosses the reference line, such a comparison is not significant at the 5% level
400
300
200
100
100 200 300 400 Differences for alpha = 0.05 (simulated adjustment)
20 25 30 35 40 45 50 Differences for alpha = 0.05 (simulated adjustment) 50
45
40
35
30
25
20
results presented in Table 3) are therefore relevant to the present (not future) clonal performance. Un-fortunately, no information on relatedness of these clones is available, which would eventually yield to the prediction of breeding values (treating clones as factors with random effects). Such values would be critically important in the current breeding activi-ties with wild cherry in the Czech Republic. When
[image:6.595.61.531.73.118.2]future research plots are established, they should be either derived from half- or full-sib progenies (that could as well be vegetatively propagated). Such an approach would provide very important information to forest tree breeders and facilitate future breeding activities with this species (Xiang, Li 2001, 2003). Pedigree reconstruction method utilizing genetic markers (e.g. highly informative microsatelites) Table 4. The correlated error structure (model M2) resulted in higher log-likelihood, lower overall standard error, and larger
F-score for the test of fixed effects
Model Trait Log-likelihood Overall standard error F-incr.
Ml height –6,595.87 27.14 4.83
M2 height –6,525.85 16.95 22.92
Ml diameter –2,870.35 2.46 5.06
[image:6.595.64.531.160.246.2]M2 diameter –2,778.13 1.32 7.05
Table 3. Type 3 tests of fixed effects – height and diameter
Effect Num DF Den DF F-value Pr > F
Height clone 10 23.2 4.22 0.0020
Diameter clone 10 22.4 5.02 0.0007
Table 5. Estimates of clonal means for height (upper) and diameter (lower) using two alternative models (M1 and M2)
Clone Estimate (Ml) (Ml)SE Estimate (M2) (M2)SE Number of ramets Mortality (%)
145 185.53 33.68 165.50 7.75 101 12.7
147 262.25 32.26 218.20 4.74 255 3.3
148 212.39 33.77 200.13 8.81 70 5.6
149 209.77 35.13 211.71 8.71 86 0.2
150 370.15 40.99 368.21 30.48 40 0.3
153 210.85 33.55 189.43 4.61 133 4.1
155 228.19 33.51 212.85 4.42 150 6.3
157 199.68 37.93 184.11 6.23 61 6.4
164 210.28 33.32 172.60 2.70 566 4.2
167 194.34 33.46 155.25 3.60 224 5.3
271 233.94 39.12 212.28 18.19 39 7.4
145 27.78 2.51 26.79 0.51
147 33.59 2.37 28.57 0.32
148 28.25 2.52 26.24 0.59
149 26.94 2.65 28.17 0.69
150 43.83 3.18 39.93 2.52
153 28.14 2.50 26.42 0.32
155 29.20 2.50 27.07 0.31
157 26.22 2.93 26.30 0.41
164 28.78 2.48 26.61 0.21
167 29.25 2.49 26.35 0.25
[image:6.595.63.532.409.756.2]could reveal the relationship matrix in the current experiment (Blouin 2003; Jones, Ardren 2003). Breeding values of selected plus trees could then be estimated via the best linear unbiased prediction procedure.
Although clonal means presented in Table 5 indicate the presence of phenotypic variation in observed traits, the statistical evidence of pair-wise differences is rather weak (Fig. 1). It can be argued that wide confidence intervals of pair-wise differenc-es are due to relatively young age of tredifferenc-es assdifferenc-essed in the trail, (2) poor experimental design with the lack of replications within each site, and (3) significant clone by location interaction. Based on the current evaluation, the clone number “150” is obviously the best performer. At this age, this clone is taller than the others and has the largest diameter.
On the basis of trellis plots (graphical output of ASReml©, not presented here) means over all rows were assessed across all clones (columns) at each site. There were no large differences among these means, suggesting relatively homogeneous environment at each site. However, the lack of blocking reduces the power of the experiment, and reduces considerably the range of validity for the conclusions (Neter et al. 1996). Retrospective power at some sites was uselessly large giving rise to large experimental site and consequently large experimental error variabil-ity. Provided that the blocking scheme was imple-mented, lower number of plants would be required, resulting in a cheaper experiment leading to more precise results.
Spatial analysis is a valuable tool in analyzing forest genetic trials (Costa E Silva et al. 2001). Resulting increase in the log-likelihood (and other measures described above) points to the autocorrelation error structure in the data. Graphical output of ASReml© software showed that other environmental trends were observed in the data set (such as border effects of surrounding stands). However, due to the lack of proper experimental design and site maintenance, our focus was directed to fitting simple models char-acterizing causal relationships, rather than fitting the best (quite elaborate) statistical model. Additional model functions were investigated following the approach by Gilmour et al. (1999, 2002). The au-toregressive error structure model (MD2) provides a relatively good fit to the data compared to other correlation structure models assessed (results not presented). This conclusion holds with the results by Dutkowski et al. (2002) who tested several covari-ance models and found the AR1 × AR1 model robust (able to adequately accommodate a wide variety of situations).
Significant location by clone interaction (present-ed in Table 2) is in accordance to other studies, e.g. Curnel et al. (2003) and Karlsson et al. (2001). The presence of interactions will hamper the evaluation of future clonal performance either for the purpose of direct deployment or breeding and would eventu-ally require the development of loceventu-ally adapted lines. However, the experimental trial is not well suited for more detailed assessment of the nature of this interaction.
The results presented here are only prelimi-nary. It is necessary to carry on measurements in later age. For the practical use, it is very suitable to carry on the marker analysis suggested above. This would allow the incorporation of full pedigree information to the analysis, leading to the predic-tion of breeding values. Such values are necessary for the establishment of breeding populations and consequently long-term breeding program with wild cherry in the Czech Republic. This will be the stimulation for selection giving substantial gains in volume production and potentially in quality traits. The use of vegetative propagation brings additional benefit through increased correlation between the selection criterion and the actual breeding value, and leads to larger genetic gains when incorpo-rated into breeding strategies (Isik et al. 2005; Danusevičius, Lindgren 2002). We also suggest that larger number of clones is tested (e.g. half-sib progenies of seed orchards), in order to maintain sufficient diversity for breeding and conservation of this valuable species. Following the next evaluation, best clones should be selected and directly planted in clonal mixtures to provide short-term genetic gain in forest plantations.
Acknowledgements
The authors thank Dr. Greg Dutkowski for his assistance and many helpful suggestions.
References
BLOUIN M.S., 2003. DNA-based methods for pedigree re-construction and kinship analysis in natural populations. Trends in Ecology and Evolution, 18: 503–511.
CORNU D., CHAIX C., 1981. Multiplication par culture in vitro de merisiers adultes (Prunus avium). In: Proceedings IUFRO Section S2 01.5th International Workshop “In Vitro” Cultivation for Tree Species, Fontainbleu: 71–79.
CURNEL Y., JACQUES D., NANSON A., 2003. First multisite clonal test of wild cherry (Prunus avium L.) in Belgium. Silvae Genetica, 52: 45–52.
DANUSEVIČIUS D., LINDGREN D., 2002. Efficiency of se-lection based on phenotype, clone and progeny testing in long-term breeding. Silvae Genetica, 51: 19–26.
DUTKOWSKI G.W., COSTA E SILVA J., GILMOUR A.R., LOPEZ G.A., 2002. Spatial analysis methods for forest genetic trials. Canadian Journal of Forest Research, 32: 2201–2214.
GILMOUR A.R., CULLIS B.R., WELHAM S.J., THOMSON R., 1999. ASREML Reference Manual, Biometrics Bulletin 3, NSW. Agriculture, ORANGE, Australia.
GILMOUR A.R., GOGEL B.J., CULLIS B.R., WELHAM S.J., THOMSON R., 2002. ASREML user guide, release 1.0. VSN International Ltd. Hemel Hempstead, UK.
HAMMATT T., 1999. Delayed flowering and reduced branch-ing in micropropagated mature wild cherry (Prunus avium
L.) compared with rooted cuttings and seedlings. Plant Cell Reports, 18: 478–484.
HENDERSON C.R., 1990. Statistical Method in Animal Im-provement: Historical Overview. In: Advances in Statistical Methods for Genetic Improvement of Livestock. New York, Springer Verlag: 1–14.
HOENIG J.M., HEISEY D.M., 2001. The abuse of power: the pervasive fallacy of power calculations for data analysis. The American Statistician, 55: 19–24.
ISIK F., GOLDFARB B., LEBUDE A., LI B., McKEAND S., 2005. Predicted genetic gains and testing efficiency from two loblolly pine clonal trials. Canadian Journal of Forest Research, 35: 1754–1766.
JONES A.G., ARDREN W.R., 2003. Methods of parentage analysis in natural populations. Molecular Ecology, 12: 2511–2523.
KARLSSON B., WELLENDORF H., ROULUND H., WERNER M., 2001. Genotype × trial interaction and stability across sites in 11 combinated provenance and clone experiments with Picea abies in Denmark and Sweden. Canadian Journal of Forest Research, 31: 1826–1836.
KLEINSCHMIT J., 1999. Breeding strategies for hardwoods: oak, cherry and birch. In: Strategies for Improvement of
Forest Tree Species. Proceedings of the Symposium on For-est Genetics, Swift Theatre, Arts Building, Trinity College, Dublin, 9th March, 1998: 37–62.
KOBLIHA J., 2002. Wild cherry (Prunus avium L.) breeding program aimed at the use of this tree in the Czech forestry. Journal of Forest Science, 48: 202–218.
LITTELL R.C., MILIKEN G.A., STROUP W.W., WOLFIN-GER R.D., 2000. SAS© System for Mixed Models. SAS Institute Inc., Cary, North Carolina, USA.
MURANTY H., SCHERMANN N., SANTI F., DUFOUR J., 1998. Genetic parameters estimated from a wild cherry diallel: consequences for breeding. Silvae Genetica, 47: 249–257.
NETER J., KUTNER M.H., WASSERMAN W., NACHTS-HEIM CH.J., 1996. Applied Linear Statistical Models. 4th ed. McGraw-Hill, Irwin.
SANTI F., MURANTY H., DUFOUR J., PAQUES L.C., 1998. Genetic parameters and selection in a multisite wild cherry clonal test. Silvae Genetica, 47: 61–67.
SAS Institute Inc., 2004. SAS OnlineDoc® 9.1.3. Cary, NC:
SAS Institute Inc.
SEARLE S.R., CASELLA G., McCULLOCH C.E., 1992. Vari-ance Components. New York, John Wiley & Sons. WESTFALL P.H., 2002. From farms to pharmaceuticals:
multiple comparisons enter the 21st century. In: MIL-LIKEN G.A. (ed.), Proceedings of the Thirteenth Annual Kansas State Univesity Conference on Applied Statistics in Agriculture, Manhattan. Department of Statistics, Kansas State University.
XIANG B., LI B., 2001. A new mixed analytical method for genetic analysis of diallel data. Canadian Journal of Forest Research, 31: 2252–2259.
XIANG B., LI B., 2003. Best linear unbaised prediction of clonal breeding values and genetic values from full-sib mating designs. Canadian Journal of Forest Research, 33: 2036–2043.
Received for publication July 18, 2006 Accepted after corrections September 18, 2006
První odhad růstových parametrů mladého klonového testu třešně ptačí
akti-Corresponding author:
Ing. Martin Hajnala, Česká zemědělská univerzita v Praze, Fakulta lesnická a environmentální, katedra dendrologie a šlechtění lesních dřevin, 165 21 Praha 6-Suchdol, Česká republika
tel.: + 420 224 383 406, fax: + 420 234 381 860, e-mail: [email protected]
vity s třešní ptačí v České republice lze doporučit zaměřit se na zakládání dlouhodobých šlechtitelských programů s touto dřevinou.