Splicing factor SRSF1 controls T cell
hyperactivity and systemic autoimmunity
Takayuki Katsuyama, … , George C. Tsokos, Vaishali R.
Moulton
J Clin Invest.
2019;
129(12)
:5411-5423.
https://doi.org/10.1172/JCI127949
.
Graphical abstract
Research Article
Autoimmunity
Immunology
Find the latest version:
Introduction
Systemic lupus erythematosus (SLE) is a chronic debilitating multi-system autoimmune disease that disproportionately afflicts women, causing significant morbidity and mortality (1, 2). Failure of the immune system to recognize self-antigens leads to inappropriate immune responses, systemic autoimmu-nity, and organ damage. The identification of novel molecules and mechanisms underlying the pathogenic immune response in SLE will guide the development of appropriate therapeutic targets. While autoreactive B cells, autoantibodies, and immune complexes are important in disease pathogenesis (3), and ele-vated type I interferons (IFNs) have been implicated in disease (4, 5), therapeutic strategies targeting B cells and type I IFN signaling in SLE have shown limited success. In this regard, the role of T cells in disease pathogenesis is beginning to be under-stood, and therapeutic strategies targeting T cells are emerging (6). Aberrantly activated effector T (Teff) cells and cytokines that orchestrate not only germinal center B cell responses for autoantibody production (7–9) but also promote inflammatory infiltration in target organs (10, 11), are critical players in disease pathogenesis. These Teff cells and cytokines are found both in lupus-prone mice and in patients with SLE (12–15), and
there-fore are potential promising therapeutic targets. Yet the mole-cules and mechanisms which control the activated T cell pheno-type in SLE are poorly understood.
A key pathway involved in the activation of T cells is the phos-phoinositide-3 kinase (PI3K)/AKT/mechanistic target of rapamy-cin (mTOR) pathway. The mTOR pathway determines cell fate decisions of T cell activation, differentiation, proliferation, and cell death (16). Resting quiescent T cells have low levels of mTOR activity, while mTOR complex 1 (mTORC1) activation leads to increased proportions of activated/effector cells and a decreased pool of naive cells (17). Recently, mTOR activation has emerged as a central regulator of T cell dysfunction in systemic autoim-mune diseases and as a promising therapeutic target for SLE (15, 18). Increased activity of the mTORC1 pathway in T cells is known to promote the aberrant production of cytokines IFN-γ, IL-17, and IL-4 (19, 20), and contribute to systemic autoimmunity (9). Fur-thermore, activation of mTORC1 is associated with altered aber-rantly activated T cell responses in patients with SLE (21, 22). The phosphatase and tensin homolog (PTEN), a lipid phosphatase, negatively regulates the PI3K/Akt signaling pathway (23) and inhibits the activity of the mTOR pathway (24). PTEN-deficient T cells are hyperresponsive to TCR stimulation (25), and Pten deletion in T cells in mice leads to autoimmune lymphoprolifera-tive disease and aberrant production of cytokines (26, 27). PTEN expression is decreased in B cells from patients with SLE and con-tributes to B cell hyperactivity (28). However, it is still unknown whether PTEN is altered in T cells from patients with SLE and whether it contributes to T cell hyperactivity.
Systemic lupus erythematosus (SLE) is a devastating autoimmune disease in which hyperactive T cells play a critical role. Understanding molecular mechanisms underlying the T cell hyperactivity will lead to identification of specific therapeutic targets. Serine/arginine-rich splicing factor 1 (SRSF1) is an essential RNA-binding protein that controls posttranscriptional gene expression. We have demonstrated that SRSF1 levels are aberrantly decreased in T cells from patients with SLE and that they correlate with severe disease, yet the role of SRSF1 in T cell physiology and autoimmune disease is largely unknown. Here we show that T cell–restricted Srsf1-deficient mice develop systemic autoimmunity and lupus-nephritis. Mice exhibit increased frequencies of activated/effector T cells producing proinflammatory cytokines, and an elevated T cell activation gene signature. Mechanistically, we noted increased activity of the mechanistic target of rapamycin (mTOR) pathway and reduced expression of its repressor PTEN. The mTOR complex 1 (mTORC1) inhibitor rapamycin suppressed proinflammatory cytokine production by T cells and alleviated autoimmunity in Srsf1-deficient mice. Of direct clinical relevance, PTEN levels correlated with SRSF1 in T cells from patients with SLE, and SRSF1 overexpression rescued PTEN and suppressed mTORC1 activation and proinflammatory cytokine production. Our studies reveal the role of a previously unrecognized molecule, SRSF1, in restraining T cell activation, averting the development of autoimmune disease, and acting as a potential therapeutic target for lupus.
Splicing factor SRSF1 controls T cell hyperactivity
and systemic autoimmunity
Takayuki Katsuyama,1 Hao Li,1 Denis Comte,1,2 George C. Tsokos,1 and Vaishali R. Moulton1
1Division of Rheumatology and Clinical Immunology, Department of Medicine, Beth Israel Deaconess Medical Center, Harvard Medical School, Boston, Massachusetts, USA. 2Divisions of Immunology and
Allergy, Lausanne University Hospital, Lausanne, Switzerland.
Conflict of interest: The authors have declared that no conflict of interest exists.
Copyright: © 2019, American Society for Clinical Investigation.
Submitted: February 6, 2019; Accepted: September 3, 2019; Published: November 4, 2019.
The Journal of Clinical Investigation
[image:3.585.50.536.52.632.2]R E S E A R C H A R T I C L E
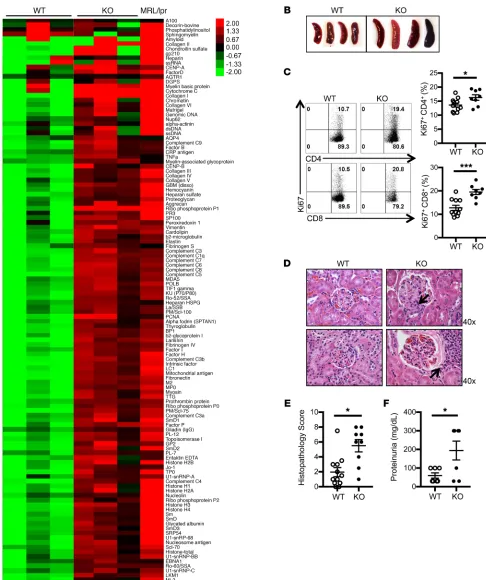
Figure 1. Srsf1-cKO mice develop systemic autoimmunity and lupus nephritis. (A) Heatmaps show autoantibody microarray data from sera of 12-week-old WT and Srsf1-cKO mice (n = 3 each) and 1 MRL/lpr mouse, analyzed for IgG reactivity against a 128-autoantigen panel. (B) Spleen images from aged (12- to 18-month-old) WT and Srsf1-cKO mice. Data are representative of at least 4 independent experiments. (C) Flow cytometry plots and graphs show Ki67 staining on live-gated CD4+ and CD8+ T cells from spleen of WT and Srsf1-cKO mice (2- to 18-month-old, n = 11 [WT], n = 8 [KO]). (D) Representative
light microscopy images of H&E-stained paraffin sections of kidneys from aged (9- to 18-month-old) mice. Original magnification ×40. Arrows represent mesangial and endocapillary proliferation (upper) and interstitial inflammatory cell infiltration (lower). (E) Graph shows semiquantitative scores for kidney histopathology (n = 12 [WT], n = 9 [KO]). (F) Graph shows proteinuria from WT and Srsf1-cKO mice (n = 7 each). Mann-Whitney U test (E); unpaired
and a number of nuclear, membrane, phospholipid, and cytoplasmic protein autoantigens (Figure 1A). Serum from a lupus-prone MRL/ lpr mouse, which spontaneously develops an autoimmune lupus-like disease, was included as positive control. We found that Srsf1-cKO mice develop a wide array of lupus-associated autoantibodies at levels comparable to those seen in MRL/lpr mice (Figure 1A). We confirmed by ELISA the presence of antinuclear (ANA) antibodies in sera from Srsf1-cKO mice (Supplemental Figure 2A). In aged mice (12–18 months), we observed a lymphoproliferative phenotype (Fig-ure 1B and Supplemental Fig(Fig-ure 2B). We also found that T cells from Srsf1-cKO mice exhibit increased proliferative capacity as assessed by Ki67 staining (Figure 1C). The kidneys of aged Srsf1-cKO mice showed histopathologic evidence of lupus nephritis with glomerulo-nephritis, mesangial and endocapillary proliferation, and interstitial inflammatory cell infiltration (Figure 1D) with significantly high-er histopathology scores compared with control mice (Figure 1E). Immunohistochemistry staining showed T cell infiltration in kidneys of Srsf1-cKO mice (Supplemental Figure 2C). Srsf1-cKO mice devel-oped significant proteinuria compared with WT mice (Figure 1F). These results demonstrate that the loss of SRSF1 in T cells leads to systemic autoimmunity and lupus-like disease.
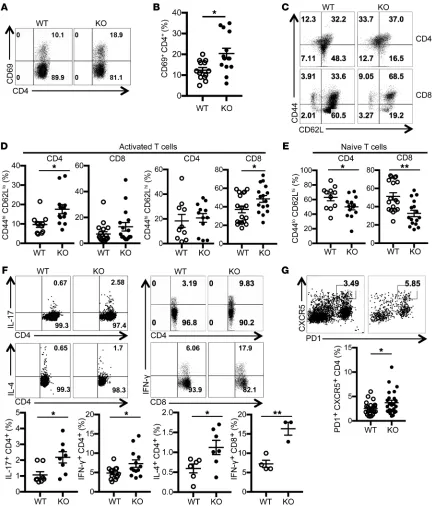
T cells from Srsf1-cKO mice exhibited a hyperactive phenotype and produced proinflammatory cytokines. Examination of peripheral lymphoid T cells from spleen revealed significantly increased pro-portions of activated CD69hi cells (Figure 2, A and B), and
effec-tor/memory CD44hiCD62Llo and CD44hiCD62Lhi populations in
the CD4 and CD8 compartments (Figure 2, C and D). In paral-lel, we recorded a significant reduction in the naive T cell pool in both CD4 and CD8 compartments (Figure 2E). Further, we found increased proportions of IL-17–, IFN-γ–, and IL-4–producing CD4+
T cells, and IFN-γ–producing CD8+ T cells from Srsf1-cKO mice
(Figure 2F). In addition, we found that the frequencies of CD4+
CXCR5+PD1+ T follicular helper (Tfh) cells were increased in
Srsf1-cKO mice (Figure 2G). We also detected the increased presence of spontaneous germinal centers in the spleens from Srsf1-cKO mice (Supplemental Figure 2D). We found that the frequencies of GL7+Fas+ germinal center B cells were increased in Srsf1-cKO
mice (Supplemental Figure 2E). In addition, IgD–
memory/plas-ma B cells were also increased in Srsf1-cKO mice (Supplemental Figure 2F). There was no difference in the frequencies and abso-lute numbers of B cells, CD11b+ cells, and CD11c+ cells in spleen
of control WT and Srsf1-cKO mice (Supplemental Figure 3, A and B). The frequencies of CD4+CD25+FoxP3+ Treg cells in Srsf1-cKO
mice were comparable with those of control mice (Supplemental Figure 4, A and B) and suppressed the proliferation of convention-al T (Tconv) cells normconvention-ally in in vitro Treg suppression assays for 3 days (Supplemental Figure 4, C and D). These results show that loss of SRSF1 induces the development of activated, inflammatory cytokine-producing T cells.
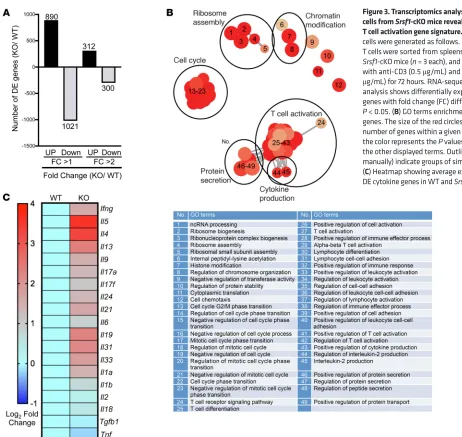
Transcriptomics analysis of CD4+ Teff cells from Srsf1-cKO mice revealed an elevated T cell activation gene signature. Because the Srsf1-cKO mice develop autoimmune inflammatory disease, and exhibit increased proportions of proinflammatory Teff cells, we asked whether SRSF1 controls the genes and pathways involved in T cell activation and differentiation. We performed transcrip-tomics analysis by RNA-sequencing of CD4+ Teff cells derived by
stimulation of naive CD4+ T cells with anti-CD3 and anti-CD28
Serine arginine-rich splicing factor 1 (SRSF1), previously known as splicing factor 2/alternative splicing factor (SF2/ASF), is the prototype member of the highly conserved serine arginine (SR) family of RNA-binding proteins. SRSF1 controls posttranscrip-tional gene expression via pre-mRNA alternative splicing, mRNA stability, and translation (29). While SRSF1 is an essential ubiq-uitous molecule that controls genes involved in cell survival and proliferation (30), little is known of its role in the immune system. T cells from patients with SLE display hyperactive T cell receptor (TCR)/CD3+ signaling and proinflammatory cytokine production
(1, 31). This overactive lupus T cell phenotype is associated with a reduced expression of the CD3 zeta (ζ) chain (32), attributed in part to defective alternative splicing of its 3′ UTR (33). Using dis-covery approaches, we found that SRSF1 binds to the 3′ UTR of the CD3ζ mRNA in human T cells (34, 35). We showed that SRSF1 promotes normal expression of CD3ζ by limiting expression of an unstable isoform of its 3′ UTR (35) and that SRSF1 levels decrease upon T cell activation (36). We demonstrated that SRSF1 expres-sion is aberrantly decreased in T cells from patients with SLE and correlates with severe disease (37)(38). In addition, decreased SRSF1 expression levels have been linked to the defective expres-sion of multiple autoantigen transcripts in the organ-specific auto-immune inflammatory myositis (39). Thus, studies in humans suggest that the reduced expression of SRSF1 correlates with an activated T cell phenotype and the expression of autoimmune disease. However, evidence of a causal in vivo relationship among SRSF1, T cell dysfunction, and autoimmune disease is still lacking.
Here we show that mice that lack Srsf1 in mature T cells devel-op systemic autoimmunity and lupus nephritis with increased pro-portions of activated/effector T cell populations and proinflam-matory cytokine-producing T cells. Mechanistically, we show that T cells from Srsf1-deficient mice exhibit increased mTOR activity and reduced expression of its negative regulator PTEN, whereas rapamycin and overexpression of PTEN normalize the inflamma-tory cytokine production. Importantly, PTEN levels are reduced in patients with SLE with lower SRSF1 expression and SRSF1 rescues PTEN levels, suppresses mTORC1 activity, and reduces proin-flammatory cytokine production by T cells from patients with SLE. Our studies demonstrate that SRSF1 is a previously unrecognized molecule that restrains T cell activation and controls the develop-ment of autoimmune disease.
Results
The Journal of Clinical Investigation
R E S E A R C H A R T I C L E
control mice, whereas at the fold change greater than 2 cutoff, and a P value less than 0.05, 312 genes were upregulated and 300 genes were downregulated in Srsf1-cKO mice compared with nor-mal mice (Figure 3A). Gene Ontology (GO) enrichment and Kyoto for 72 hours, from 7-week-old control WT or Srsf1-cKO mice with
[image:5.585.69.503.55.561.2]3 mice per group (Figure 3 and Table 1). At the fold change greater than 1, and a P value less than 0.05, 890 genes were upregulated and 1021 genes downregulated in Srsf1-cKO mice compared with
Figure 2. T cells from Srsf1-cKO mice have a hyperactive phenotype and produce proinflammatory cytokines. Spleen cells were isolated from WT and
Srsf1-cKO mice and analyzed by flow cytometry. (A) Plots show CD69 expression gated on live CD4+ T cells. (B) Graph shows percent of CD69+CD4+ T cells (n
= 13 [WT], n = 14 [KO]; < 20-week-old mice). (C) Plots show CD62L and CD44 staining gated on live CD4+ and CD8+ T cells in spleen (D) Graphs show percent
of activated effector/ memory subsets (CD44hiCD62Lhi and CD44hiCD62Llo) of CD4+ and CD8+ T cells (CD4+: n = 11 [WT], n = 13 [KO]; CD8+: n = 18 [WT], n =
16 [KO]; < 20-week-old mice). (E) Graphs show percentage of naive (CD44loCD62Lhi) CD4+ and CD8+ T cells (CD4+: n = 11 [WT]; n = 13 [KO]; CD8+: n = 18 [WT], n = 16 [KO]; < 20-week-old mice). (F) Spleen cells were stimulated for 4 hours with PMA, ionomycin with monensin followed by surface and intracellular cytokine staining for flow cytometry. Plots show IL-17, IL-4, and IFN-γ staining gated on live CD4+ and CD8+ T cells. Graphs below show percentage of
cyto-kine-producing CD4+ and CD8+ T cells from spleen (IL-17: n = 8 each; IL-4: n = 6–7; CD4+ IFN-γ: n = 13 each; CD8+ IFN-γ: n = 3–4; CD4+: < 20-week-old mice;
CD8+: 9- to 40-week-old mice). (G) Splenocytes from WT or Srsf1-cKO mice were stained for PD1 and CXCR5 by flow cytometry. Plots show cells gated on
(27). Further, activation of the mTOR pathway is associated with hyperactive T cell responses with inflammatory cytokine pro-duction in patients with SLE (15, 21, 22). In our transcriptomics analysis from Srsf1-cKO mice, a number of genes of the PI3K/ Encyclopedia of Genes and Genomes (KEGG) pathway
analy-ses revealed the top pathways to include genes associated with T cell activation, regulation of protein secretion, cytokine- cytokine receptor interaction, cell cycle, Th17 differentiation, and Th1 and Th2 differentiation (Table 1). Cluster analysis revealed predomi-nantly genes involved in T cell activation, protein secretion, cyto-kine production, ribosome assembly, cell cycle, and chromatin modifications (Figure 3B). The expression levels of multiple cyto-kines including Ifng, Il17, Il4, and Il21 were found to be increased (Figure 3C). Because IL-21 is known to play important roles in Tfh differentiation, the increased Il21 expression may contribute to the observed increase in Tfh cells in Srsf1-cKO mice. These data indi-cate that SRSF1 controls genes involved in T cell activation, differ-entiation, and cytokine production, and the loss of SRSF1 leads to unrestrained activation and proinflammatory phenotype of T cells.
[image:6.585.40.502.49.486.2]T cells from Srsf1-cKO mice displayed increased activation of the mTORC1 pathway and reduced expression of PTEN. It is known that Pten-deficient mice exhibit features of T cell hyperactivity with increased proinflammatory cytokines and autoimmunity
Figure 3. Transcriptomics analysis of CD4+ Teff cells from Srsf1-cKO mice reveals an elevated T cell activation gene signature. (A) CD4+ Teff
cells were generated as follows. Naive CD4+
T cells were sorted from spleens of WT and
Srsf1-cKO mice (n = 3 each), and stimulated
with anti-CD3 (0.5 μg/mL) and anti-CD28 (1.0
μg/mL) for 72 hours. RNA-sequencing data analysis shows differentially expressed (DE) genes with fold change (FC) differences at
P < 0.05. (B) GO terms enrichment map of DE genes. The size of the red circles indicates the number of genes within a given pathway, and the color represents the P values relative to the other displayed terms. Outlines (added manually) indicate groups of similar GO terms. (C) Heatmap showing average expression of DE cytokine genes in WT and Srsf1-cKO mice.
Table 1. Pathway analysis of RNA-sequencing of CD4+ Teff cells
from Srsf1-cKO mice
Description Count P (Adjusted)
T cell activation 104 8.13 × 10⁻¹⁰
Regulation of protein secretion 86 6.54 × 10⁻⁹
Cytokine-cytokine receptor interaction 54 0.0276241
Cell cycle 40 2.68 × 10⁻⁶
Th17 cell differentiation 25 0.0321325
Th1 and Th2 cell differentiation 22 0.0359993
The Journal of Clinical Investigation
R E S E A R C H A R T I C L E
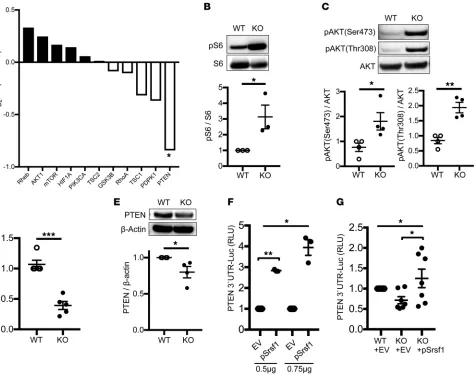
AKT/mTOR pathway were differentially expressed, and the expression of its repressor PTEN was found to be downregulat-ed (Figure 4A). Given these findings, we examindownregulat-ed the activity of the mTOR pathway in the Srsf1-cKO mice. We found increased expression of phosphorylated S6 (pS6) protein levels in CD4+ Teff
cells derived by stimulation of naive CD4+ T cells with anti-CD3
and anti-CD28 for 72 hours, indicating an increased activity of the mTORC1 pathway (Figure 4B). It was previously reported that SRSF1 regulates the splicing of S6K1, an mTORC1 down-stream signaling molecule, and modulates the mTOR pathway in cell lines (41). We found that deletion of Srsf1 in T cells results in
the decrease of the short isoform of S6K1 (Supplemental Figure 5), consistent with previous reports. Although this short isoform of S6K1 associates with activation of the mTORC1 pathway (42), in the present study we found that serine-threonine kinase AKT, upstream of S6K1, is activated in CD4+ Teff cells from Srsf1-cKO
[image:7.585.56.531.56.430.2]mice (Figure 4C). Therefore, we hypothesized that decreased PTEN levels result in the activation of mTOR pathway. We con-firmed the decreased mRNA (Figure 4D) and protein (Figure 4E) expression levels of PTEN in T cells from Srsf1-cKO mice. Because SRSF1 controls gene expression at the posttranscription-al level, which is frequently mediated through the 3′ UTR, we Figure 4. T cells from Srsf1-cKO mice exhibit increased activation of the mTORC1 pathway and reduced expression of PTEN. (A) Fold expression of the mTOR pathway genes from RNA-sequencing data. (B–D) Naive CD4+ T cells were isolated from spleens of mice, and stimulated with anti-CD3 (0.5
μg/mL) and anti-CD28 (1.0 μg/mL) for 72 hours. (B) Total protein was immunoblotted for pS6 and total S6. Data are from 1 representative of 3 indepen-dent experiments. Graph shows relative densitometry quantitation of pS6 and S6 (n = 3 each). (C) After 72 hours, additional stimulation with anti-CD3 (10 μg/mL) and anti-CD28 (10 μg/mL) for 5 minutes was performed. Total protein was immunoblotted for p-AKT and total AKT. Data are from 1 repre-sentative of 4 independent experiments. Graph shows relative densitometry quantitation of p-AKT and AKT (n = 4 each). (D) Total RNA was isolated and reverse transcribed. Pten expression was measured by real-time qPCR and normalized to housekeeping gene cyclophilin A (n = 5 each). (E) Total protein was isolated from total T cells and immunoblotted for PTEN and β-actin. Data are from 1 representative of 4 independent experiments. Graph shows densitometric quantitation of PTEN normalized to β-actin (n = 4 each). (F) HEK293T cells were transfected with a pGL3–PTEN 3′ UTR luciferase plasmid and cotransfected with either a pcDNA3.1 empty vector (EV) or an Srsf1 (pSrsf1) plasmid, and included an internal control pRL-TK luciferase plasmid. Cells were lysed and dual luciferase assays performed. Graph shows relative luciferase units normalized to the internal luciferase control from
investigated the effect of SRSF1 on the 3′ UTR activity of PTEN. Cotransfection of a PTEN 3′ UTR–luciferase construct along with an Srsf1-expression vector in HEK293T cells revealed an increase in PTEN 3′ UTR activity (Figure 4F). Transfection of the PTEN 3′ UTR into freshly isolated total T cells from Srsf1-cKO mice led to decreased 3′ UTR activity, which was rescued by the overexpres-sion of SRSF1 (Figure 4G). These results show that SRSF1 controls the expression of PTEN and loss of SRSF1 leads to reduced PTEN expression and increased activity of the mTOR pathway.
Rapamycin treatment reduced proinflammatory cytokine pro-duction by T cells and alleviated autoimmunity in Srsf1-cKO mice. Recently, hyperactivity of the mTOR pathway has been associ-ated with aberrant T cell responses in SLE (15, 43), and targeted inhibition of this pathway with the lipophilic macrolide
antibi-otic rapamycin has led to improved T cell function and shown efficacy in a recent clinical trial in patients with active SLE (44). To assess whether the increased mTORC1 activation of T cells from Srsf1-cKO mice contributes to their proinflammatory phe-notype and autoimmune phephe-notype, we examined the effect of rapamycin. Treatment of spleen cells from Srsf1-cKO mice ex vivo with rapamycin reduced the production of proinflamma-tory cytokines IL-17 (Figure 5, A and B) and IFN-γ (Figure 5, C and D) from CD4+ T cells. Furthermore, to assess the effects of
rapamycin on disease in vivo, we treated Srsf1-cKO mice with rapamycin and evaluated the effect on features of autoimmuni-ty. We observed reduced levels of IL-17 cytokine production ex vivo (Figure 5E), and decreased proportions of CD4+ PD1+
CX-CR5+ Tfh cells in the spleens from cKO mice (Figure 5F).
Impor-Figure 5. Rapamycin treatment reduces proinflammatory cytokine production by T cells and alleviates autoimmunity in Srsf1-cKO mice. (A–D) Spleen cells from WT or Srsf1-cKO mice were cultured for 4 hours with PMA plus ionomycin in the presence of monensin. Rapamycin (1 nM or 10 nM) was added for the duration of cultures. Cells were collected, surface stained, fixed, and permeabilized for intracellular cytokine staining. (A and C) Plots show IL-17 and IFN-γ intracellular staining gated on live CD4+ T cells.
[image:8.585.33.520.52.556.2]The Journal of Clinical Investigation
R E S E A R C H A R T I C L E
SRSF1 overexpression increased PTEN levels, suppressed mTORC1 activity, and reduced proinflammatory cytokine production in T cells from patients with SLE. To assess whether SRSF1 overexpression would increase PTEN expression and reduce mTORC1 activi-ty and the aberrant cytokine production by T cells from patients with SLE, we transiently transfected T cells from patients with SLE with an Srsf1-expression vector followed by stimulation with anti-CD3 and anti-CD28. We found that SRSF1 overexpression increased PTEN protein levels (Figure 7C), reduced activation of the mTORC1 pathway as evidenced by a reduction in pS6 expres-sion levels (Figure 7D), and led to reduced frequencies of IL-17– and IFN-γ–producing CD4+ T cells (Figure 7E). These findings
show that decreased SRSF1 expression contributes to mTORC1 activation and proinflammatory cytokine production in T cells from patients with SLE through the control of PTEN.
Discussion
In this study, we demonstrate that selective deletion of SRSF1 in T cells in mice leads to aberrantly activated proinflammatory cyto-kine-producing Teff cells, leading to systemic autoimmunity and lupus nephritis (Figure 1 and Figure 2). We report that SRSF1 con-trols the expression of genes involved in T cell activation, differen-tiation, and cytokine signaling (Figure 3). At the mechanistic level, we demonstrate that SRSF1 regulates the 3′ UTR of the mRNA of the mTOR inhibitor PTEN and limits its expression, causing increased mTOR activity (Figure 4). Rapamycin treatment corrects proinflam-matory cytokine production in T cells and alleviates autoimmunity in Srsf1-deficient mice (Figure 5). Of clinical relevance is our find-ing that T cells from patients with SLE with low expression levels of SRSF1 had decreased levels of PTEN, which correlate with decreased expression levels of SRSF1 (Figure 7). Further, restitution of SRSF1 levels corrected the proinflammatory cytokine production by hyper-active SLE T cells (Figure 7). Thus, we uncover SRSF1 as what we believe is a novel molecular brake in the control of T cell hyperac-tivity and the prevention of autoimmune disease. Our findings high-light an important role for SRSF1 in the immune system and in the control of immune- mediated disease. SRSF1 deficiency unrestrains T cell activation, unleashes the production of proinflammatory cyto-kines IL-17 and IFN-γ by CD4+ Teff cells, and leads to activation of
B cells and inflammatory infiltration in target organs, leading to sys-temic autoimmunity and organ inflammation. Increased activity of the mTOR pathway contributes to the proinflammatory phenotype, which is rescued by rapamycin administration.
tantly, we observed a reduction in the levels of serum dsDNA and histone autoantibodies (Figure 5G). In addition, treatment with rapamycin reduced T cell infiltration into the kidneys (Fig-ure 5H). These data indicate that deficiency of SRSF1 leads to increased activation of the mTOR pathway, the ensuing proin-flammatory function of T cells, and systemic autoimmunity, which can be corrected by rapamycin.
PTEN overexpression reduced proinflammatory cytokine produc-tion by T cells from Srsf1-cKO mice. To confirm that SRSF1 modu-lates T cell activation via regulation of PTEN expression, PTEN was overexpressed by transient transfections in T cells from WT and Srsf1-cKO mice, followed by stimulation with PMA and ion-omycin for 4 hours. We confirmed the overexpression of PTEN at the mRNA and protein levels (Supplemental Figure 6, A and B). We found that cytokine production is decreased by PTEN overexpres-sion in T cells from Srsf1-cKO mice but not in WT T cells (Figure 6, A and B). Of note, transfection by electroporation is toxic to cells and accounts for the overall reduced frequencies of IFN-γ –produc-ing cells (Figure 6) compared with untransfected cells (Figure 5C and Supplemental Figure 6C). These data indicate that deficiency of SRSF1 leads to decreased PTEN expression, increased activa-tion of the mTOR pathway and the ensuing proinflammatory func-tion of T cells (Supplemental Figure 7) which contribute to system-ic autoimmune disease.
[image:9.585.41.369.56.203.2]PTEN is decreased in T cells from patients with SLE with low SRSF1 levels. Although PTEN expression is decreased and con-tributes to the hyperactivity of B cells in patients with SLE (28), its role in T cells in SLE has not been studied. Given our findings of increased mTOR activity and the decreased expression and regulatory role of PTEN in T cells from the Srsf1-cKO mice (Fig-ure 4, Fig(Fig-ure 5, and Fig(Fig-ure 6), we asked whether PTEN expres-sion levels are altered in T cells from patients with SLE. There-fore, we assessed PTEN and SRSF1 protein expression levels in T cells from patients with SLE and compared with age-, race-, and sex-matched healthy control individuals. We found that the expression of PTEN was decreased in T cells from patients with SLE who had decreased expression levels of SRSF1, compared with those from healthy individuals (Figure 7A). Important-ly, we observed a linear correlation between PTEN and SRSF1 expression levels in T cells from patients with SLE (R2 = 0.226, P = 0.0163, Figure 7B). These results suggest that the low SRSF1 levels may contribute to the reduced expression of PTEN in T cells from patients with SLE.
SLE remains unknown. We previously showed that the expres-sion levels of SRSF1 are decreased in SLE T cells and inversely correlate with disease activity, suggesting the important role of SRSF1 in SLE T cells (37). Our current study extends this concept with a number of crucial new findings. Here we show a linear correlation between PTEN and SRSF1 in T cells from patients with SLE, and that patients with lupus with low SRSF1 expression levels exhibit lower expression levels of PTEN. Fur-thermore, the overexpression of SRSF1 rescues PTEN expres-sion in lupus T cells (Figure 7). This is the first evidence showing the reduction of PTEN in T cells in a subset of patients with SLE. Moreover, the overexpression of SRSF1 in lupus T cells reduc-es mTOR activity and the production of proinflammatory cyto-kines, suggesting that the SRSF1-PTEN-mTOR pathway may be a novel therapeutic target in patients with SLE.
The mTOR pathway is a recently emerging crucial therapeutic target in autoimmune diseases, including SLE (15, 43). Increased mTORC1 activity has been demonstrated in T cells from patients with SLE and correlates with expansion of proinflammatory cytokine-producing T cells (21, 22). Treatment of lupus-prone MRL/lpr mice with rapamycin, an inhibitor of mTORC1 signaling, improved disease parameters (45). Importantly, a recent clini-cal trial of rapamycin in patients with SLE has shown efficacy in patients with active SLE (44). Here, we find that SRSF1 deficiency in mice results in increased activation of mTORC1 pathway, which parallels the observed increased mTORC1 activity (15) and the decreased SRSF1 expression in patients with SLE (37).
[image:10.585.83.494.58.408.2]Although PTEN is known to suppress the mTOR pathway and the expression of PTEN is decreased in B cells from patients with SLE (28), the role of PTEN in T cells from patients with
The Journal of Clinical Investigation
R E S E A R C H A R T I C L E
In conclusion, we have uncovered what we believe is a previ-ously unrecognized role of SRSF1 in T cell physiology and demon-strated the impact of its absence on the expression of autoim-mune disease. Loss of SRSF1 limits the expression of the mTOR repressor PTEN, leading to aberrant T cell activation and the expression of systemic autoimmunity. Our results suggest that prevention of the loss of SRSF1 should be of therapeutic value to autoimmune diseases.
Methods
Human subjects. Patients with SLE, all fulfilling the American
Col-lege of Rheumatology classification criteria (49), were recruited at the rheumatology clinic at Beth Israel Deaconess Medical Center (BIDMC), Boston, MA (Supplemental Table 1). Age-, race-, and sex-matched healthy individuals were recruited as controls. Peripheral blood was drawn from patients by venipuncture.
Mice. C57BL/6J (stock 000664), B6.129S4-Srsf1-flox (stock
018020), and B6.dLck.Cre (stock 012837) mice were purchased from The Jackson Laboratory. In most experiments, sex-matched litter-mates were used as WT controls. All mice were maintained in the spe-cific pathogen–free animal facility at BIDMC.
Antibodies and reagents. The following flow cytometry antibodies
were from Biolegend: anti–mouse-CD4 (clone GK1.5), CD8a (clone 53-6.7), CD11b (clone M1/70), CD11c (clone N418), CD19 (clone 6D5), CD25 (clone PC61), CD44 (clone IM7), B220 (clone RA3-6B2), CD62L (clone MEL-14), CD69 (clone H1.2F3), CD90.2 (clone 53-2.1), TCR-β (clone H57-597), IgD (clone 11-26c.2a), IL-4 (clone 11B11), IL-17A (clone JC11-18F10.1), IFN-γ (clone XMG1.2), CXCR5 (clone L138D7), Ki67 (clone 16A8), CD127 (clone A019D5), PD-1 (clone 29F.1A12), GL7 (clone GL7), purified anti–mouse-CD3 (clone 145-2C11), CD28 (clone 37.51), CD16/32 (Fc block), anti–human CD3 (clone OKT3), CD4 (clone OKT4), CD8 (clone SK1), and IFN-γ (clone 4S.B1). Brilliant Violet 421–conjugated streptavidin, Zombie Aqua Fixable Viability kit mouse IL-17A ELISA kit, and carboxyfluoresce-in succcarboxyfluoresce-inimidyl ester (CFSE) were also from Biolegend. Anti-mouse Foxp3 (clone FJK-16s) antibody, mouse regulatory T cell staining kit, and anti–human IL-17A antibody (clone eBIO64DEC17) were from eBioscience. Anti–mouse Fas (clone Jo2) antibody, Cytofix/Cytoperm, Perm/Wash buffer, and monensin were from BD Biosciences. ACK lysing buffer was from Thermo Fisher Scientific. SRSF1 rabbit poly-clonal antibody for flow cytometry was from LifeSpan Biosciences and monoclonal antibody for Western blot (clone 96) was from Thermo Fisher Scientific. Anti-S6 ribosomal protein phospho-Ser 235 and Ser 236 (clone D57.2 2E), S6 ribosomal protein (clone 5G10), anti-PTEN (clone 138G6), anti–phospho-AKT (Ser473; clone D9E), anti– phospho-AKT (Thr308; clone 244F9), and anti-AKT (clone C67E7) antibodies were from Cell Signaling Technology. Phorbol myristic acid (PMA), ionomycin, mitomycin C, and β-actin antibody (clone AC-74) were from Sigma-Aldrich. Goat anti–rabbit IgG horseradish peroxi-dase (HRP) and goat anti–mouse IgG HRP antibodies were from Ther-mo Fisher Scientific. Rapamycin and goat anti–Ther-mouse IgG were from Millipore. HEK293T cells were purchased from American Type Cul-ture Collection (ATCC). The pcDNA3.1-SRSF1 expression plasmid was a gift from James Manley (Columbia University, NY), and the pGL3-PTEN 3′ UTR plasmid was a gift from Jeffrey Rosen (Addgene plasmid 28104). The pcDNA3-FLAG PTEN plasmid was a gift from Jaewhan Song (Addgene plasmid 78777).
T cell quiescence is enforced by molecules able to restrain T cell activation, and the expression of such molecules generally subsides upon TCR stimulation to enable effector differentiation programs. These genes include, among others, the Kruppel-like factor (KLF) genes, Schlafen-2, Tsc2, and the Forkhead box (Foxo) family (46). T cells from the Srsf1-cKO mice preferential-ly expressed genes involved in the Foxo1 signaling pathway, cell cycle, T cell activation, cytokine-cytokine receptor interaction, and Th differentiation programs. Therefore, it appears that SRSF1 may be involved in the maintenance of resting T cell quiescence. In agreement with these findings is our previous finding that high SRSF1 protein levels in resting human T cells decreased following TCR stimulation due to degradation by the ubiquitin-proteasome pathway (36). In contrast, deficiency or decreased expression of SRSF1 as recorded in our Srsf1-cKO mice and in patients with SLE, respectively, contributes to T cell activation, loss of tolerance, autoimmunity, and organ inflammation. Of direct clinical rele-vance is the observation that T cells from patients with SLE exhib-it a hyperactive phenotype and functional defects (13), which are linked mechanistically to decreased SRSF1 expression (37).
A limitation of our study is that the T cell–restricted deletion of Srsf1 is under the distal Lck promoter, which is expressed late during thymic development, as opposed to the proximal Lck pro-moter, which is expressed early in the double-negative thymo-cytes. Therefore, the role of SRSF1 in early thymic development is bypassed, which may differentially influence T cell physiology and function. Also, Srsf1 is absent from birth and does not address the possibility of altering T cell function should its levels decrease later in life. Deletion of Srsf1 in adult mice may result in differ-ential physiological and pathophysiological outcomes. SRSF1 levels are decreased in T cells from patients with SLE but are not completely absent. Therefore, while the homozygous Srsf1-cKO mice are used in proof-of-concept studies here, the heterozygous (distal.Lckcre.Srsf1flox/wt mice) Srsf1-cKO mice, which also develop some features of T cell activation and signs of autoimmune dis-ease (unpublished observations), may serve as a better model for human disease in future studies. Because SRSF1 regulates target genes via various mechanisms, it is possible that other pathways also contribute to T cell activation and autoimmunity. In addition, although the frequency of Tregs and functional results from short-term in vitro suppression assays are comparable between WT and Srsf1-cKO mice, further studies (including generating Treg con-ditional Srsf1-cKO mice) are required to assess precisely the role of SRSF1 in Tregs. Furthermore, the differences observed in the distribution of activated/memory T cell populations within the CD4 and CD8 compartments imply a potentially differential role of SRSF1 in CD4+ and CD8+ T cells (Figure 2, C–E). Besides these
at 60°C for 15 seconds, extension at 72°C for 30 seconds); one cycle of melting curves (95°C for 15 seconds, 65°C for 2 minutes, and 97°C continuous), and a final cooling at 37°C. Threshold cycle values were used to calculate relative mRNA expression by the ΔCt relative quanti-fication method. Primer sequences are listed in Supplemental Table 2.
RNA sequencing. Naive CD4+ T cells were isolated from spleens of
7-week-old WT and Srsf1-cKO mice (n = 3 each) and stimulated with anti-CD3 (0.5 μg/mL) and anti-CD28 (1 μg/mL) for 72 hours. Cells were restimulated with PMA (100 ng/mL) and ionomycin (1 μM) for 4 hours. Total RNA was extracted using the RNeasy mini kit (Qiagen) and submitted for sequencing to the Molecular Biology Core Facility (MBCF) at the Dana-Farber Cancer Institute (DFCI). Libraries were prepared using Illumina TruSeq Stranded mRNA sample prepara-tion kits according to the manufacturer’s protocols. Samples were sequenced on an Illumina NextSeq500 run with single-end 75-bp reads. Data analyses were performed by the MBCF at DFCI and the Harvard T.H. Chan School of Public Health Biostatistics Core. The data were deposited in the NCBI Gene Expression Omnibus (GEO) database under accession number GSE 136286.
Western blot. To detect pS6, naive CD4+ T cells were isolated from
spleens of 9- to 10-week-old WT and Srsf1-cKO mice and stimulated with anti-CD3 (0.5 μg/mL) and anti-CD28 (1 μg/mL) for 72 hours. Human T cells were stimulated with soluble anti-CD3 (5 μg/mL), anti-CD28 (2.5 μg/mL) and cross linker goat anti–mouse IgG (10 μg/mL) for 5 minutes. Cells were lysed with radioimmunoprecipitation assay (RIPA) buffer (Boston Bioproducts). Lysates were electrophoresed on NuPAGE 4%–12% Bis-Tris gels (Life Technologies) and transferred to PVDF membrane. Membranes were blocked with 5% (wt/vol) nonfat milk in Tris-buffered saline with 0.05% Tween 20 (TBS-T) for 1 hour, incubated with primary antibody (1:1000, or 1:10,000 for β-actin anti-body) in 5% milk in TBS-T or Hikari solution A (Nacalai Tesque) at 4°C overnight or at room temperature for 2 hours for β-actin antibody. Mem-branes were washed 3 times with TBS-T, incubated with HRP-conjugat-ed secondary antibody (1:2000 for ECL detection reagents or 1:4000 for ECL prime detection reagents; GE Healthcare) for 1 hour, washed 3 times with TBS-T, developed with ECL reagents, and visualized by a Fujifilm LAS-4000 imager or Bio-Rad ChemiDoc imager. Densitome-try was performed using Quantity One software (Bio-Rad).
Transfections. HEK293T cells were cultured in DMEM complete
medium. One day prior to transfection, 0.3 × 10⁶ cells were seeded
in a 12-well plate. Cells were cotransfected with the pGL3-PTEN 3′ UTR luciferase plasmid and either pcDNA3.1 empty vector (EV) or pcDNA3.1-Srsf1 vector using Lipofectamine (Invitrogen). All transfec-tions included a pRL-TK Renilla luciferase plasmid as internal control. Human T cells and mouse T cells were transfected using the Amaxa human T cell nucleofector kit and the mouse T cell nucleofector kit, respectively, following the manufacturer’s instructions. Briefly, 3 × 10⁶ to 6 × 10⁶ cells were resuspended in 100 μL nucleofector solution,
plasmid DNA was added, and cells were transferred into a cuvette and electroporated using the U-014 program for human cells or the X-001 program for mouse cells in the nucleofector device. Cells were imme-diately rescued into prewarmed medium and cultured overnight.
Luciferase assays. Cells were transfected as described above. After
24 hours in culture, cells were collected, lysed in passive lysis buffer (Promega), and luciferase activity was quantified on a luminometer using the dual-luciferase assay system (Promega) according to the manufacturer’s instructions.
Cell isolation and tissue processing. Spleens and lymph nodes were
homogenized using a syringe plunger and mesh cell strainer. After perfusion, kidneys were homogenized and digested in HBSS medium with 1.5 mg/mL collagenase B (Boehringer Mannheim) at 37°C for 30 minutes. RBC lysis was performed with ACK lysing buffer. All cell cultures were in RPMI complete medium (RPMI plus 10% FBS plus penicillin and streptomycin antibiotics). Blood samples from mice were collected by tail vein incision and capillary tube collection, and serum was separated by centrifugation. Urine samples were collected from mice in individual metabolic cages and urine protein was mea-sured by Multistix (Siemens). Human T cells from peripheral blood were isolated using the Rosette Sep human T cell enrichment cocktail (STEMCELL Technologies). For histopathology, tissues were immedi-ately fixed in 10% formalin overnight, processed in an automated tis-sue processor, embedded into paraffin blocks, and sent to the BIDMC histopathology core for sectioning and slide staining with H&E. Slides were evaluated blind for histopathology scoring, utilizing semiquanti-tative scoring criteria for lupus nephritis (50).
Flow cytometry. Zombie aqua viability dye was used for live/dead
cell staining. Surface staining was performed in FACS staining buffer (PBS plus 2% FBS) on ice for 20 minutes with Fc block. For cytokine production, cells from mice were stimulated for 4 hours in culture medium with PMA (100 ng/mL), ionomycin (1 μM), and monensin (1
μL/mL). Human T cells were stimulated with PMA (10 ng/mL), iono-mycin (400 ng/mL), and monensin (1 μL/mL) for 4 hours. Cells were surface stained followed by fixation and permeabilization. Appropri-ate antibodies were used for intracellular staining for cytokines or Foxp3 and Ki67. Flow cytometry data were acquired on a BD LSRII or CytoFLEX LX and analyzed with FlowJo software. All procedures were performed according to the manufacturer’s instructions.
Autoantibody detection. Sera from 12-week-old WT and
Srsf1-cKO mice and one 16-week-old MRL/lpr mouse (as positive control) were analyzed for the presence of autoantibodies using the Autoan-tigen Microarray Super Panel (128-anAutoan-tigen panel) at the Genomics and Microarray Core facility at the University of Texas, Southwestern Medical Center (Dallas, TX). Heatmaps were prepared using R soft-ware. Antinuclear antibody (ANA) in serum was measured using an ELISA kit (Alpha Diagnostic International) following the manufac-turer’s instructions. Briefly, the serum was diluted and assayed for antigen reactivity on precoated plates followed by incubation for 60 minutes. Bound IgG was detected with anti–mouse IgG HRP antibody and developed with a tetramethylbenzidine (TMB) substrate. Plates were read at 450 nm on a spectrophotometer. To detect anti–double stranded (ds)DNA and anti–histone antibodies, Immulon II plates (Dynatech) precoated with BSA were coated individually with 50 μg/ mL calf thymus DNA (Sigma-Aldrich) or 50 μg/mL calf thymus his-tone (Sigma-Aldrich). The serum was diluted (1:500) and assayed for autoantigen reactivity against the antigens described above by incuba-tion overnight at 4°C. Bound IgG was detected with a goat polyclonal HRP–anti-mouse IgG detection antibody (SouthernBiotech) and visu-alized at 450 nm using a TMB substrate (Sigma-Aldrich).
mRNA expression and RT-PCR. Total RNA was isolated using the
The Journal of Clinical Investigation
R E S E A R C H A R T I C L E
1. Tsokos GC. Systemic lupus erythematosus. N
Engl J Med. 2011;365(22):2110–2121.
2. Yen EY, Singh RR. Brief report: lupus-an unrecog-nized leading cause of death in young females: a population-based study using nationwide death certificates, 2000-2015. Arthritis Rheumatol. 2018;70(8):1251–1255.
3. Malkiel S, Barlev AN, Atisha-Fregoso Y, Suur-mond J, DiaSuur-mond B. Plasma cell differentiation pathways in systemic lupus erythematosus. Front
Immunol. 2018;9:427.
4. Banchereau J, Pascual V. Type I interferon in systemic lupus erythematosus and other autoim-mune diseases. Immunity. 2006;25(3):383–392. 5. Crow MK, Olferiev M, Kirou KA. Targeting of
type I interferon in systemic autoimmune diseas-es. Transl Rdiseas-es. 2015;165(2):296–305.
6. Lo MS, Tsokos GC. Recent developments in systemic lupus erythematosus pathogenesis and applications for therapy. Curr Opin Rheumatol. 2018;30(2):222–228.
7. Caielli S, et al. A CD4+ T cell population
expanded in lupus blood provides B cell help through interleukin-10 and succinate. Nat Med. 2019;25(1):75–81.
8. Hsu HC, et al. Interleukin 17-producing T helper cells and interleukin 17 orchestrate autoreactive germinal center development in autoimmune BXD2 mice. Nat Immunol. 2008;9(2):166–175. 9. Yi W, et al. The mTORC1-4E-BP-eIF4E axis
controls de novo Bcl6 protein synthesis in T cells and systemic autoimmunity. Nat Commun. 2017;8(1):254.
10. Amarilyo G, Lourenço EV, Shi FD, La Cava A. IL-17 promotes murine lupus. J Immunol. 2014;193(2):540–543.
11. Koga T, Ichinose K, Tsokos GC. T cells and IL-17 in lupus nephritis. Clin Immunol. 2017;185:95–99. 12. Choi SC, Morel L. B cell contribution of the
CD4+ T cell inflammatory phenotypes in
sys-temic lupus erythematosus. Autoimmunity. 2017;50(1):37–41.
13. Katsuyama T, Tsokos GC, Moulton VR. Aberrant T cell signaling and subsets in systemic lupus erythematosus. Front Immunol. 2018;9:1088. 14. Moulton VR, Suarez-Fueyo A, Meidan E, Li H,
Mizui M, Tsokos GC. Pathogenesis of human systemic lupus erythematosus: a cellular perspec-tive. Trends Mol Med. 2017;23(7):615–635. 15. Perl A. Activation of mTOR (mechanistic target
of rapamycin) in rheumatic diseases. Nat Rev
Rheumatol. 2016;12(3):169–182.
16. Chapman NM, Chi H. mTOR links environmen-tal signals to T cell fate decisions. Front Immunol. 2014;5:686.
17. Yang K, Neale G, Green DR, He W, Chi H. The tumor suppressor Tsc1 enforces quiescence of naive T cells to promote immune homeostasis and function. Nat Immunol. 2011;12(9):888–897. 18. Perl A. mTOR activation is a biomarker and
a central pathway to autoimmune disorders, cancer, obesity, and aging. Ann N Y Acad Sci. 2015;1346(1):33–44.
19. Delgoffe GM, et al. The kinase mTOR regulates the differentiation of helper T cells through the selective activation of signaling by mTORC1 and mTORC2. Nat Immunol. 2011;12(4):295–303. 20. Yang K, et al. T cell exit from quiescence and
differentiation into Th2 cells depend on Rap-tor-mTORC1-mediated metabolic reprogram-ming. Immunity. 2013;39(6):1043–1056. 21. Kato H, Perl A. Mechanistic target of rapamycin
complex 1 expands Th17 and IL-4+ CD4-CD8- double-negative T cells and contracts regulatory T cells in systemic lupus erythematosus. J
Immu-etry, and sera was collected to measure autoantibodies by ELISA. In some experiments, mice were treated with rapamycin every day for 1 week. Kidneys were collected to analyze T cell infiltration by flow cytometry. Spleen cells were cultured with anti-CD3 (2 μg/mL) and anti-CD28 (2 μg/mL) for 24 hours and IL-17A was measured in super-natants by ELISA (Biolegend).
Statistics. Student’s 2-tailed t test, Mann-Whitney U test, and
1-way ANOVA were used to calculate statistical significance among groups. A P value of less than 0.05 was considered significant. In all graphs, data represent mean ± SEM.
Study approval. For human studies, written informed consent was
obtained from all participants and all studies were approved by the institutional review board (Committee on Clinical Investigations) at BIDMC. All animal studies were approved by the Institutional Animal Care and Use Committee at BIDMC.
Author contributions
VRM conceptualized the study. TK, HL, DC, and VRM designed and performed the experiments, and analyzed and interpreted data. TK, HL, GCT, and VRM prepared the manuscript.
Acknowledgments
We thank Andrew Gillooly, Michael Mosho, and Melissa Carr-Reynolds for excellent technical assistance; Suzanne Krish-field for recruiting patients with SLE and healthy individuals; Donna Farber and Martin Flajnik for critical reading of the man-uscript; and Amir Sharabi and Abel Suarez-Fueyo for helpful dis-cussions. This work was funded by NIH grants K01AR060781 and R01AR068974 to VRM, R01AI42269 to GCT, and an SICPA Foun-dation grant to DC.
Address correspondence to: Vaishali R. Moulton, 330 Brookline Avenue, E/CLS-948, Boston, Massachusetts 02215, USA. Phone: 617.735.4186; Email: [email protected].
Immunofluorescence and immunohistochemistry staining. For
immunofluorescence staining, spleens were embedded in OCT tis-sue media (Tistis-sue-Tek) and frozen on dry ice. Frozen sections (7-μm thickness) were fixed to slides in ice-cold acetone for 15 minutes and air dried for 30 seconds. The sections were blocked with 10% horse serum for 30 minutes at room temperature, then stained for 30 minutes at room temperature in a humidified chamber with fluores-cence-conjugated anti-IgD (catalog 405717; Biolegend), anti-CD4 (catalog 100533; Biolegend), anti-B220 (catalog 103207; Bioleg-end), and biotinylated PNA (catalog B-1075; Vector Laboratories). Biotinylated PNA was detected using by streptavidin–Alexa Fluor 350 (catalog S-11249; Life Technologies). For immunohistochem-istry staining, slides of formalin-fixed, paraffin-embedded kidneys were incubated with purified anti–mouse CD3 antibody (clone 100201; Biolegend) overnight at 4°C after antigen retrieval. The primary antibody was detected with rabbit anti–rat HRP secondary antibody (clone ab6734, Abcam).
In vitro suppression assays. Total T cells were isolated from spleens
by magnetic assisted cell sorting (MACS), using the Pan T cell iso-lation kit (Miltenyi Biotech). Conventional CD4+ T cells (Tconv)
(CD4+CD25–CD127hi) and Treg cells (CD4+CD25+CD127lo) were
sort-ed by flow cytometry (FACSAria II, BD Bioscience). Tconv cells were labeled with CFSE and cocultured with Treg cells at increasing ratios for 3 days in the presence of mitomycin C–treated splenocytes and anti-CD3 and anti-CD28, and proliferation of Tconv was analyzed by flow cytometry.
Rapamycin treatment. Rapamycin was dissolved in DMSO and
cytom-nol. 2014;192(9):4134–4144.
22. Lai ZW, et al. Mechanistic target of rapamycin activation triggers IL-4 production and necrotic death of double-negative T cells in patients with systemic lupus erythematosus. J Immunol. 2013;191(5):2236–2246.
23. Stambolic V et al. Negative regulation of PKB/ Akt-dependent cell survival by the tumor sup-pressor PTEN. Cell. 1998;95(1):29–39. 24. Chi H. Regulation and function of mTOR
signal-ling in T cell fate decisions. Nat Rev Immunol. 2012;12(5):325–338.
25. Buckler JL, Walsh PT, Porrett PM, Choi Y, Turka LA. Cutting edge: T cell requirement for CD28 costimulation is due to negative reg-ulation of TCR signals by PTEN. J Immunol. 2006;177(7):4262–4266.
26. Di Cristofano A, Kotsi P, Peng YF, Cordon-Cardo C, Elkon KB, Pandolfi PP. Impaired Fas response and autoimmunity in Pten+/- mice. Science. 1999;285(5436):2122–2125.
27. Suzuki A, et al. T cell-specific loss of Pten leads to defects in central and peripheral tolerance.
Immunity. 2001;14(5):523–534.
28. Wu XN, et al. Defective PTEN regulation contributes to B cell hyperresponsiveness in systemic lupus erythematosus. Sci Transl Med. 2014;6(246):246ra99.
29. Howard JM, Sanford JR. The RNAissance fam-ily: SR proteins as multifaceted regulators of gene expression. Wiley Interdiscip Rev RNA. 2015;6(1):93–110.
30. Li X, Manley JL. New talents for an old acquain-tance: the SR protein splicing factor ASF/SF2 functions in the maintenance of genome stabili-ty. Cell Cycle. 2005;4(12):1706–1708. 31. Moulton VR, Tsokos GC. T cell signaling
abnormalities contribute to aberrant immune cell function and autoimmunity. J Clin Invest. 2015;125(6):2220–2227.
32. Nambiar MP, et al. Reconstitution of deficient T cell receptor zeta chain restores T cell signaling and augments T cell receptor/CD3-induced interleukin-2 production in patients with sys-temic lupus erythematosus. Arthritis Rheum. 2003;48(7):1948–1955.
33. Chowdhury B, et al. Stability and translation of TCR zeta mRNA are regulated by the adenos-ine-uridine-rich elements in splice-deleted 3’ untranslated region of zeta-chain. J Immunol. 2006;177(11):8248–8257.
34. Moulton VR, Kyttaris VC, Juang YT, Chowdhury B, Tsokos GC. The RNA-stabilizing protein HuR regulates the expression of zeta chain of the human T cell receptor-associated CD3 complex.
J Biol Chem. 2008;283(29):20037–20044.
35. Moulton VR, Tsokos GC. Alternative splicing factor/splicing factor 2 regulates the expres-sion of the zeta subunit of the human T cell receptor-associated CD3 complex. J Biol Chem. 2010;285(17):12490–12496.
36. Moulton VR, Gillooly AR, Tsokos GC. Ubiquiti-nation regulates expression of the serine/argi-nine-rich splicing factor 1 (SRSF1) in normal and systemic lupus erythematosus (SLE) T cells. J Biol
Chem. 2014;289(7):4126–4134.
37. Moulton VR, Grammatikos AP, Fitzgerald LM, Tsokos GC. Splicing factor SF2/ASF rescues IL-2 production in T cells from systemic lupus erythe-matosus patients by activating IL-2 transcription.
Proc Natl Acad Sci USA. 2013;110(5):1845–1850.
38. Kono M et al. Decreased expression of Serine/ arginine-rich splicing factor 1 in T cells from patients with active systemic lupus erythemato-sus accounts for reduced expression of RasGRP1 and DNA methyltransferase 1. Arthritis
Rheuma-tol. 2018;70(12):2046–2056.
39. Xiong Z, et al. Alternative splicing factor ASF/ SF2 is down regulated in inflamed muscle. J Clin
Pathol. 2006;59(8):855–861.
40. Xu X, et al. ASF/SF2-regulated CaMKIIdelta alternative splicing temporally reprograms exci-tation-contraction coupling in cardiac muscle.
Cell. 2005;120(1):59–72.
41. Karni R, de Stanchina E, Lowe SW, Sinha R, Mu D, Krainer AR. The gene encoding the splicing factor SF2/ASF is a proto-oncogene. Nat Struct
Mol Biol. 2007;14(3):185–193.
42. Ben-Hur V, et al. S6K1 alternative splicing modulates its oncogenic activity and regulates mTORC1. Cell Rep. 2013;3(1):103–115. 43. Oaks Z, Winans T, Huang N, Banki K, Perl A.
Activation of the mechanistic target of rapamy-cin in SLE: explosion of evidence in the last five years. Curr Rheumatol Rep. 2016;18(12):73. 44. Lai ZW, et al. Sirolimus in patients with clinically
active systemic lupus erythematosus resistant to, or intolerant of, conventional medications: a single-arm, open-label, phase 1/2 trial. Lancet. 2018;391(10126):1186–1196.
45. Warner LM, Adams LM, Sehgal SN. Rapamycin prolongs survival and arrests pathophysiologic changes in murine systemic lupus erythemato-sus. Arthritis Rheum. 1994;37(2):289–297. 46. Hamilton SE, Jameson SC. CD8 T cell quiescence
revisited. Trends Immunol. 2012;33(5):224–230. 47. Perl A. Review: Metabolic control of immune
system activation in rheumatic diseases. Arthritis
Rheumatol. 2017;69(12):2259–2270.
48. Yin Y, et al. Normalization of CD4+ T cell metabolism reverses lupus. Sci Transl Med. 2015;7(274):274ra18.
49. Tan EM, et al. The 1982 revised criteria for the classification of systemic lupus erythematosus.
Arthritis Rheum. 1982;25(11):1271–1277.