A new scale measuring adaptive perceived control for people with Parkinson's: Initial construction and further validation
Jane Simpson, Gerasimos Chatzidamianos, Ian Fletcher, Luis Perpetuo, Fiona Eccles
PII: S0022-510X(18)30247-8
DOI: doi:10.1016/j.jns.2018.05.023
Reference: JNS 15915
To appear in: Journal of the Neurological Sciences
Received date: 6 March 2018
Accepted date: 28 May 2018
Please cite this article as: Jane Simpson, Gerasimos Chatzidamianos, Ian Fletcher, Luis Perpetuo, Fiona Eccles , A new scale measuring adaptive perceived control for people with Parkinson's: Initial construction and further validation. Jns (2018), doi:10.1016/ j.jns.2018.05.023
ACCEPTED MANUSCRIPT
A new scale measuring adaptive perceived control for people with Parkinson’s: initial
construction and further validation
Jane Simpson a , Gerasimos Chatzidamianos b, Ian Fletcher a, Luis Perpetuo c, Fiona Eccles a
Affiliations:
a
Division of Health Research, Lancaster University, Lancaster, LA1 4YT, U.K.
d
Department of Psychology, Manchester Metropolitan University, Manchester , M15 6GX, U.K.
c Parkinson’s UK, Vauxhall Bridge Road, London, U.K.
ACCEPTED MANUSCRIPT
Abstract
Introduction
Perceived control is an important concept in understanding adjustment to chronic conditions such as Parkinson’s.
While generic measures have been used to measure the construct in Parkinson’s, no Parkinson’s-specific scale
currently exists. This study outlines the initial development and further validation of a free-to-use scale, the
Parkinson’s UK Scale of Perceived Control (PUKSoPC).
Method
Focus groups were used to create items for the new scale. Potential items were then subject to screening for
readability and coherence by people affected by the condition. This left 49 items that were then completed, along
with other measures, by 231 people with Parkinson’s. Exploratory factor analysis then created a 15-item scale
with five distinct subscales. This initial structure was then further tested using confirmatory factor analysis with
2032 people with Parkinson’s. Structural equation modelling confirmed the acceptability of the total scale and
subscale structures.
Results
The final scale is concluded to be a psychometrically robust measure of perceived control. It has good face
validity, evidence of convergent and criterion (concurrent and divergent) validity, good test-retest reliability and
is internally coherent, with a demonstrably solid factor structure. While further testing would be useful to assess
the scale’s predictive ability, it is currently considered robust enough for more widespread use.
Conclusion
The PUKSoPC is an appropriate scale to provide a more comprehensive measure of perceived control. It is
preferable to single item, non-validated measures and can provide evidence of perceptions of control across a
number of domains important in the measurement of the construct.
ACCEPTED MANUSCRIPT
1. Introduction
Perceived control is an important concept in influencing how people adapt to life with a chronic condition
such as Parkinson’s [1]. For example, higher levels of perceived control correlate with a range of more
positive outcomes, such as better mood [2], and higher quality of life generally [3]. Control has been
measured as a trait-like variable and this is what is most usually measured in more generic measures of
perceived control [4]. However, perceived control can also be experienced over a number of
illness-specific domains – e.g., belief in an individual’s ability to control the progress of the condition
generally and symptoms more specifically [5]. It is also a factor influencing how a condition affects
lives outside the more narrow parameters of illness-defined symptomatic experience – e.g., how much
control is experienced over access to health services in relation to a condition. In addition, when
controlling the condition or symptoms is not possible, the control of emotional reactions and the
ability to adapt to a new situation becomes important [6] as well as perceived control over other life
domains and living well despite the condition [3]. Evidence also suggests that control can be
manipulated therapeutically, with concomitant effects on psychological well-being [7].
However, despite its importance as a theoretical construct [1], no measure of control specifically created
for people with Parkinson’s currently exists. Previous research employing the theoretical concept has
largely used general measures of control over illness [3]. Although these can be useful for making
comparisons across patient groups, they are not as sensitive to the specific issues faced by people with
such a diverse and unpredictable condition; in this sense they lack ‘face validity’ as they cannot include
items which might not be relevant to a much wider population [8]. Moreover, scales need to be
constructed so higher scores are indicative of adaptive levels of perceived control and this is not possible
with single item measures such as ‘how much control do you feel you have over your condition’. For
example, a scale where stronger agreement on an item indicative of unrealistic aspirations of control
(e.g. I have full control over the progress of my condition’) would result in a higher ‘perceived control’
ACCEPTED MANUSCRIPT
faced by individuals with an unpredictable chronic condition [9]. Furthermore, such a scale would not
correlate in meaningful ways with other scales where there should be some degree of concurrent validity,
such as scales of well-being. Consequently, perceptions of adaptive levels of control are best measured
using a range of outcomes considered important for demonstrating perceived control. However, this
necessitates detailed preparatory work on a condition-specific basis to identify specific outcomes
indicative of effective control across domains considered most important for those with the condition.
The measurement of control from an individual perspective is also consistent with the move to
incorporate patient reported outcomes (PROMs) in both assessment and outcome studies [10]. These
measures privilege the view of the participant and in relation to measures that are concerned with views
or perceptions of the self, they are seen as offering an important additional perspective to measures rated
by others (e.g. family, other professionals) in PD research [11]. Moreover, condition specific PROMs
have been increasingly developed for use with people with Parkinson’s [e.g. 12].
Consequently, this study reports the development of a psychometrically valid scale to measure
individuals with Parkinson’s levels of their perception of the effectiveness of their control strategies with
respect to their condition. It reports initial validation, with the creation of a provisional factor structure
and further validation with a much larger sample.
2. Methods
2.1 Participants
For the scale creation, 49 potential scale items were sent by Parkinson’s UK, a UK national charity for
people with Parkinson’s, to a group of around 1700 people affected by Parkinson’s; 236 responses were
received, with 231 retained for analysis (see demographic in Table 1). Smaller samples can also be
acceptable when communalities are high and factors are strongly determined [13] and using MacCallum
et al.’s [13] guidelines a sample of 200 was thought likely to be sufficient.
A second set of data for further validation was collected from 2032 members of Parkinson’s UK (see
ACCEPTED MANUSCRIPT
number is appropriate given that the purpose of the second sample was to confirm the initial factor
solution and is sufficient for asymptotically distribution-free (ADF) estimation.
[Insert Table 1 here]
2.2 Procedure
2.2.1 Initial item generation
The scale was created using best practice guidance for scale creation [14]. Focus groups of people with
Parkinson’s, recruited from Parkinson’s UK, generated ideas to form the basis of the scale’s items.
Specifically, individuals were asked to consider how they would consider whether they had achieved
appropriate and reasonable levels of control of their condition given that they had a chronic condition
affecting multiple domains. A range of areas were cited as being potentially affected by perceptions of
control – for example, the effects of control on their general well-being – i.e. their stress levels – and
their level of external engagement. As already indicated, this much wider sampling of areas related to
control is more sensitive than research which has simply asked single item questions [e.g. 5].
This process led to the generation of an initial pool of 84 items with both positively and negatively
worded questions (i.e. reverse scored items). People affected by Parkinson’s reviewed these 84 items for
face validity, and to ensure readability and acceptability. This resulted in changes to phrasing of some
items. In addition, the negatively worded questions were removed as they were thought to be potentially
problematic for those individuals who were experiencing difficulties in cognitive flexibility and
perseveration. Reverse scored items can also cause contamination of data if respondents are inattentive
or become confused. Items were also critically reviewed for length and possible overlap. These
assessments led to a final pool of 49 items.
2.2.2 Scale creation
The 49 items, with other demographic and questionnaire items, were sent to potential participants. As
part of this initial validation, other data also collected included: standard demographic details (gender,
ACCEPTED MANUSCRIPT
validated measures of control to provide data on the new scale’s concurrent validity. The two measures
were:
General self-efficacy scale (GSE) [15].
This scale assesses individuals’ sense of agency, i.e. how much they feel able to overcome difficulties
and solve problems in life. It is a well-known scale of general (i.e. non health specific) control with good
psychometric properties which has been validated internationally [16] with Cronbach alpha ranging
from .75 to .91 [16]. In the current sample α=.94.
Self-efficacy for managing chronic disease-6 item scale [7,17].
This scale also assesses personal agency but in relation to managing a chronic health condition and
continuing with everyday activities despite the condition. It is a short form of the original 32 item scale
and has a high internal consistency (α=.91) [17]. In the current sample α=.93.
In order to assess concurrent and divergent validity, we assessed the scale against the emotional
well-being and stigma subscales of the Parkinson’s Disease Quality of Life Scale (PDQ-39) [18]. This 39-item
questionnaire assesses patient-reported quality of life across eight subscales. It is a widely used measure
of the construct and has high internal consistency in both its total and subscale structures [19] and in this
study, for the stigma subscale, α=.82 and for emotional well-being, α=.91.
Administration and completion of the scale (median completion=24mins) was conducted electronically
aided by Smart Survey (https://www.smartsurvey.co.uk/). The work described has been conducted in
line with The Code of Ethics of the World Medical Association (Declaration of Helsinki) for studies
involving humans. The analysis was reviewed and approved by the Faculty of Health and Medicine
Research Ethics Committee, Lancaster University (REF:S2014-72).
For the second stage of the validation, the same data collection and consent procedures were applied.
This time, however, only the PUKSoPC was sent to participants.
ACCEPTED MANUSCRIPT
Most statistical analyses were conducted using the Statistical Package for Social Sciences (SPSS)
(version 22.0). Confirmatory factor analysis was conducted using AMOS (version 22.0; IBM Corp.) to fit
the Structural Equation Model (SEM). Descriptive statistics (mean, standard deviation [SD]) were
assessed. For all analyses, a two tailed p value of ≤.05 was used to denote statistical significance.
In order to develop the psychometric properties of the scale for the creation of the initial solution,
intra-item correlations between the 49 potential intra-items of the new scale were examined. Items with mainly low
correlations (<.30) with other items were removed as not representing the same underlying construct[20].
A principal axis exploratory factor analysis was then conducted on the remaining items with oblique
rotation (direct oblimin, delta = 0). Exploratory factor analysis was chosen as this is suitable for
identifying latent constructs [13,21,22] and the principal axis method was utilized as this does not have
distributional assumptions [21] and certain items were negatively skewed. Oblique rotation was selected
as the factors were expected to correlate and this approach permits examination of how the factors are
related [21]. The Kaiser-Meyer-Olkin (KMO) measure of sampling adequacy tests whether the patterns
of correlations are likely to be appropriate for factor analysis. A score of >.8 is considered excellent [23].
Convergent, concurrent and divergent validity was measured using Pearson’s r, with scores of ≥0.5
considered acceptable [24].
The confirmatory factor model was tested on the five factor solution previously identified, with a total
score also viable and based on the total of the five individual subscales. Parameters were estimated with
ADF estimates to yield optimal parameter estimates, due to non-normal distributions [25]. A chi-squared
test was used to assess the fitness of the data to the hypothesized model, although it was noted that the
chi-square test may report significant difference re model fit with sample sizes N>400 [26].
Model fit indices, such as the comparative fit index (CFI), the root mean square error of approximation
ACCEPTED MANUSCRIPT
An acceptable model is indicated by a CFI of ≥0.95, an RMSEA of ≤0.06 [27] and a CMIN/df of <3.0
[28].
Modification indices that made a significant contribution to the model (i.e. a modification index value of
>10) were adjusted as appropriate; positively correlated error terms were the only modifications applied
to the model.
Cronbach’s alpha was used for testing the degree of the inter-relatedness among the items in the final
solutions. A value above 0.7 is considered acceptable [22]. The presence of floor or ceiling effects were
considered if 15% of respondents scored, respectively, the lowest or highest scores on the scale [29].
3. Results
For the initial validation, of the 236 responses received, 231 complete data sets were included.
3.1 Exploratory factor analysis
Eleven items with low correlations with other items were removed [23], reducing the total to 38. After
this exclusion, for the data as a whole KMO=.94, with individual items also all above .8.
The remaining items were subject to an exploratory factor analysis. An initial analysis was conducted to
obtain eigenvalues for each factor. UsingKaiser's criterion (retaining factors with eigenvalues greater
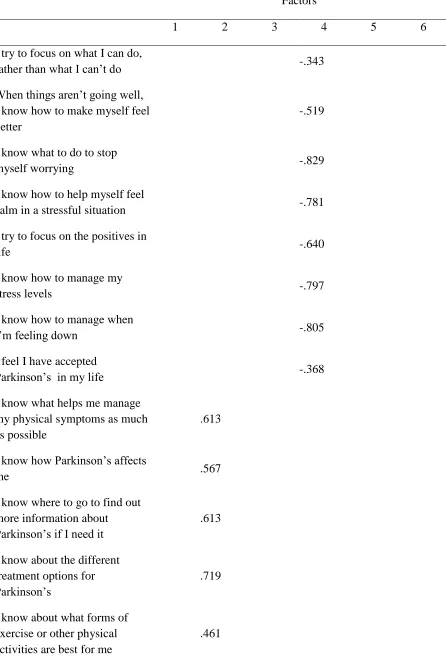
than one), this generated a six factor solution which explained 61.6% of the variance (see Table 2).
However, when deciding how many factors to extract, a number of considerations should be taken into
account including the need to balance “parsimony” with “plausibility” [21].
[Insert Table 2 here]
Consequently, the number of factors was critically assessed and one of the factors (factor 5) was not felt
to be robust enough to stand-alone. A five-factor model was felt to offer a more plausible model with
factors that were separate enough to be meaningful.
ACCEPTED MANUSCRIPT
things”; 2) “get informed”; 3) “make plans”; 4) “think positive”; and 5) “be involved”.
3.2 Scale construction
When choosing items for the final scale from the structure reported above, items were chosen which had
high factor loadings on the intended factor and which appeared to represent the breadth of each
construct. To ensure a balanced final scale, three items were chosen from each of the five interpretable
factors. As the final factor “get involved” only had two items with significant loadings, a third item was
included from the original pool of items, which just missed being included in the initial analyses (see
Appendix 1).
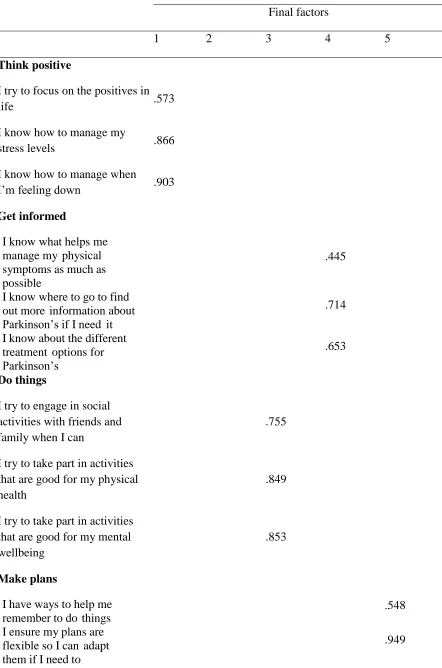
A principal axis exploratory factor analysis with direct oblimin rotation, forcing a five-factor solution
generated the pattern matrix (see Table 3); the five factors explained 64.8% of the variance (a highly
acceptable level of variance). As can be seen all items load ‘cleanly’ onto the expected factor, with no
items cross loading.
[Insert Table 3 here]
Correlations were conducted between the final version of the scale with the two other measures of
control. As expected, the total score of the new scale correlated highly with the general self-efficacy
scale (r=.548; p<.01) and the condition specific measure (r=608; p<.01); this pattern was also replicated
for the control scale subscales (all r>.269; all p<.01), indicating good concurrent validity. The
correlation between the new control scale and the PDQ-39 subscale of emotional well-being was in the
predicted direction (more control, less problems with emotional well-being) and significant (r=-.467;
p<.01), indicating convergent validity. Control and stigma, as measured by the PDQ-39, also negatively
correlated (r=-.351;p<.01) in the predicted direction (less control, more problems with stigma),
indicating divergent validity.
3.3 Confirmatory factor analysis
ACCEPTED MANUSCRIPT
larger sample to assess the robustness of the initial factor solution.
Using confirmatory factor analysis, minimization was successful and the data were considered an
acceptable fit to the model ([N=2031] χ2=195.42 p<0.001; CMIN/df=2.96, RMSEA=0.03 [90% CI
0.03–0.04], CFI=0.96). Figure 1 (see supplementary material) displays the final model, including
correlations, explained variance, and standardized path coefficients for each path. This confirms that the
initial factor solution was valid.
No floor or ceiling effects were found for the PUKSoPC total score (percentages of patients achieving
low scores, 1.5% and high scores, respectively, 9.9) and the subscales Think Positive (1.5/9.9), Get
Informed (1.5/6.2), Make Plans (3.7/6.3) and Be Involved (9.6/5.8). Only the subscale Do Things showed
some evidence of a ceiling effect (17.1).
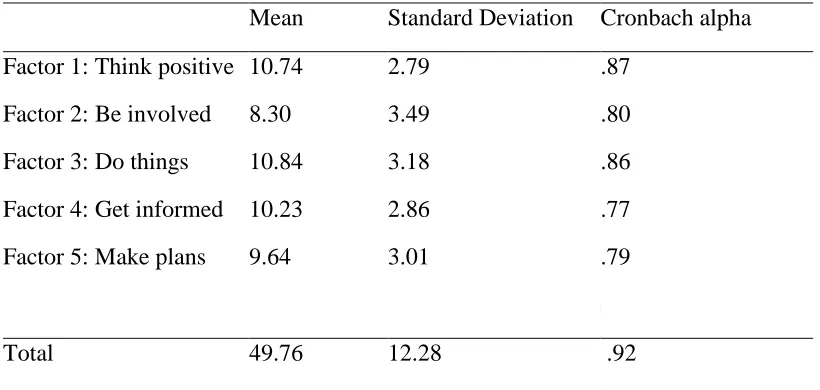
The tests of internal reliability of the subscales (Cronbach alpha; Table 4) and total score were excellent
(all α>.75). Test-reliability was also good (r=.80, N=84).
[Insert Table 4 here]
4. Discussion
The results of the scale construction reflect a robust approach to the development of the scale items in
terms of an effective measurement of a complex construct and comprehensive testing of the initial
solution through exploratory and confirmatory factor analysis. In relation to the different types of
validity necessary to demonstrate a psychometrically robust scale, we would argue that because of the
active input of people with Parkinson’s, the scale has good face validity. It is also clear that from a
psychometric perspective the initial factor solution held up well to further testing from the confirmatory
factor analysis stage indicating high construct validity. Furthermore, the scale has good concurrent,
convergent and divergent validity – as indicated by its significant correlations with other measures of
perceived control and other constructs with which it should positively and negatively co-vary – and
ACCEPTED MANUSCRIPT
In terms of further work, clearly the scale would benefit from further validation; in particular its
predictive validity – i.e. its ability to predict either psychological indices at a future time or other
behavioral measures, such as increased use of health services, that would be expected to be predicted by
higher baseline levels of perceived control. Although developed on a UK sample, the questionnaire can
be used across population groups; the only possible modification would be to item 15, with the
suggested addition of a more local patient support organization. While there is no reason to suggest that
the scale would not be suitable for populations outside the UK, data from an international perspective
would of course be useful.
Having an effective measure of perceived control means that interventions both on an individual and
broader level with people with Parkinson’s can now be effectively measured. For example, in some
psychological interventions, e.g., cognitive behavioral therapy, control is specifically targeted given its
mediating influence on other quality of life domains [30]. On a broader level, in the UK, Parkinson’s
UK is using the scale to track the change in control on an annual basis from surveys of its members.
Finally, the scale is free to use and can be administered both online and in a more traditional paper
format.
While the scale measures individuals’ perceptions of effective levels of perceived control, it should not
be assumed that lower scores necessarily reflect individual difficulties. While attempts to increase
control can be targeted at an individual level, it is more likely that systemic factors are equally or even
more important [31]. Furthermore, while strategies for increasing control can be highlighted for
individuals to adopt, difficulties reported by people with Parkinson’s often relate to societal attitudes
and constraints which limit their abilities to exercise control over their life [32]. Consequently, lower
scores on this scale should be considered in light of individual and systemic factors even though the
measurement of perceived control is at an individual level.
5. Conclusion
ACCEPTED MANUSCRIPT
over a number of areas most affected by symptoms and also more general domains of control in people
with Parkinson’s. It shows high test – retest reliability, good convergent, concurrent and divergent
validity and excellent construct validity. It is hoped that the scale can be used to measure this important
construct and help provide evidence of interventions that can deliver meaningful change.
Funding
This work was supported by funding from Parkinson’s UK [HRA7892]. Parkinson’s UK’s current 5 year strategy places a focus on 3 main themes: better treatments and a cure; quality services; and taking control. The charity commissioned Lancaster University to develop the control scale in order to create a tool with which to measure perceived levels of control amongst the Parkinson’s community in the UK and to be able to measure the success of its strategic aim of increasing the community’s reported sense of control. The scale, as a tool applied year on year through the strategic period, provides the charity with evidence of the effectiveness of its interventions within the Taking Control theme. Parkinson’s UK coordinated the data collection, facilitated the focus groups and approved the decision to submit the article for publication. The funder was not involved in the analysis nor changed any substantive part of the draft.
Conflict of Interest
Jane Simpson, Gerasimos Chatzidamianos,Ian Fletcher, Fiona Eccles: None
Luis Perpetuo: Employed by Parkinson’s UK
Appendix 1: The Parkinson’s UK Scale of Perceived Control (PUKSoPC)
Please think about how much each of the following statements applies to you and click the appropriate option.
Not at all Only a little Some what Quite a lot Very much
1 I try to focus on the positives in life
2 I know how to manage my stress levels
3 I know how to manage when I’m feeling
down
4 I know what helps me manage my
physical symptoms as much as possible
5 I know where to go to find out more
information about Parkinson’s if I need it
6 I know about the different treatment
options for Parkinson’s
7 I try to engage in social activities with
friends and family when I can
8 I try to take part in activities that are
ACCEPTED MANUSCRIPT
9 I try to take part in activities that are
good for my mental wellbeing
10 I have ways to help me remember to do
things
11 I ensure my plans are flexible so I can
adapt them if I need to
12 I set myself targets for things I would
like to do
13 I share my expertise in Parkinson’s with
others whenever I can
14 I help my family and friends to learn
more about Parkinson’s
15 I am involved with a national
organisation (e.g. Parkinson’s UK)
Scoring instructions
Each item is scored as follows
Not at all 1
Only a little 2
Somewhat 3
Quite a lot 4
Very much 5
To calculate the score for each subscale the answers to the following items should be summed
Think positive 1 2 3
Get informed 4 5 6
Do things 7 8 9
Make plans 10 11 12
Be involved 13 14 15
The total score is the sum of all items (or the sum of the subscales).
References
[1] B.J. Felton, T.A. Revenson, Coping with chronic illness: a study of illness controllability and the
influence of coping strategies on psychological adjustment., J. Consult. Clin. Psychol. 52 (1984) 343–53. http://www.ncbi.nlm.nih.gov/pubmed/6747054 (accessed November 25, 2016).
[2] J.K. Garlovsky, P.G. Overton, J. Simpson, Psychological Predictors of Anxiety and Depression in
ACCEPTED MANUSCRIPT
doi:10.1002/jclp.22308.
[3] F.J.R. Eccles, J. Simpson, A review of the demographic, clinical and psychosocial correlates of
perceived control in three chronic motor illnesses., Disabil. Rehabil. 33 (2011) 1065–88. doi:10.3109/09638288.2010.525287.
[4] J.B. Rotter, Generalized expectancies for internal versus external control of reinforcement.,
Psychol. Monogr. 80 (1966) 1–28. http://www.ncbi.nlm.nih.gov/pubmed/5340840 (accessed July 13, 2017).
[5] M.I. Wallhagen, M. Brod, M. Reimer, C.L. Lindgren, Perceived Control and Well-Being in
Parkinson’s Disease, West. J. Nurs. Res. 19 (1997) 11–31. doi:10.1177/019394599701900102.
[6] A.D. McQuillen, M.H. Licht, B.G. Licht, Contributions of disease severity and perceptions of
primary and secondary control to the prediction of psychosocial adjustment to Parkinson’s disease., Health Psychol. 22 (2003) 504–12. doi:10.1037/0278-6133.22.5.504.
[7] K.R. Lorig, D.S. Sobel, P.L. Ritter, D. Laurent, M. Hobbs, Effect of a self-management program
on patients with chronic disease., Eff. Clin. Pract. 4 (2001) 256–62.
http://www.ncbi.nlm.nih.gov/pubmed/11769298 (accessed November 25, 2016).
[8] D.L. Patrick, R.A. Deyo, Generic and disease-specific measures in assessing health status and
quality of life., Med. Care. 27 (1989) S217–32. http://www.ncbi.nlm.nih.gov/pubmed/2646490 (accessed November 25, 2016).
[9] R. Pinder, What to Expect: Information and the Management of Uncertainty in Parkinson’s
Disease, Disabil. Handicap Soc. 5 (1990) 77–92. doi:10.1080/02674649066780061.
[10] E.C. Nelson, E. Eftimovska, C. Lind, A. Hager, J.H. Wasson, S. Lindblad, Patient reported outcome measures in practice, BMJ. 350 (2015). http://www.bmj.com/content/350/bmj.g7818 (accessed July 13, 2017).
[11] P. Martinez-Martin, M. Jeukens-Visser, K.E. Lyons, C. Rodriguez-Blazquez, C. Selai, A. Siderowf, M. Welsh, W. Poewe, O. Rascol, C. Sampaio, G.T. Stebbins, C.G. Goetz, A. Schrag, Health-related quality-of-life scales in Parkinson’s disease: Critique and recommendations, Mov. Disord. 26 (2011) 2371–2380. doi:10.1002/mds.23834.
[12] T. Vanbellingen, T. Nyffeler, T. Nef, G. Kwakkel, S. Bohlhalter, E.E.H. van Wegen, Reliability and validity of a new dexterity questionnaire (DextQ-24) in Parkinson’s disease, Parkinsonism Relat. Disord. 33 (2016) 78–83. doi:10.1016/j.parkreldis.2016.09.015.
[13] R.C. Maccallum, K. Widaman, S.B. Zhang, S. Hong, Sample size in factor analysis, Psychol. Methods. 4 (1999) 84–99.
[14] L.A. Clark, D. Watson, Constructing Validity: Basic Issues in Objective Scale Development., Psychol. Assess. 7 (1995) 309–19.
[15] R. Schwarzer, M. Jerusalem, Generalized self-efficacy scale, in: J. Weinman, S. Wright, M. Johnston (Eds.), Meas. Heal. Psychol. A User’s Portfolio. Causal Control Beliefs ,
NFER_NELSON, Windsor, 1995: pp. 35–37.
ACCEPTED MANUSCRIPT
[17] Stanford Patient Education Research Center, Self-Efficacy for Managing Chronic Disease 6-item Scale, (2016). http://patienteducation.stanford.edu/research/secd6.html (accessed December 1, 2016).
[18] V. Peto, C. Jenkinson, R. Fitzpatrick, R. Greenhall, The development and validation of a short measure of functioning and well being for individuals with Parkinson’s disease., Qual. Life Res. 4 (1995) 241–8. http://www.ncbi.nlm.nih.gov/pubmed/7613534 (accessed July 13, 2017).
[19] C. Jenkinson, R. Fitzpatrick, V. Peto, R. Greenhall, N. Hyman, The Parkinson’s Disease Questionnaire (PDQ-39): development and validation of a Parkinson's disease summary index score., Age Ageing. 26 (1997) 353–7. http://www.ncbi.nlm.nih.gov/pubmed/9351479 (accessed July 13, 2017).
[20] J. Stevens, Applied multivariate statistics for the social sciences, 5th ed., Routledge, New York, 2009.
[21] L.R. Fabrigar, D.T. Wegener, R.C. Maccallum, E.J. Strahan, Evaluating the use of exploratory factor analysis in psychological research, Psychol. Methods. 4 (1999) 272–299.
doi:10.1037/1082-989x.4.3.272.
[22] M.A. Pett, N.R. (Nancy R. Lackey, J.J. Sullivan, Making sense of factor analysis : the use of
factor analysis for instrument development in health care research, Sage Pub, London, U.K., 2003.
[23] A.P. Field, Discovering statistics using IBM spss statistics, 4th ed., SAGE Publications, London, U.K., 2013.
[24] J. Cohen, Statistical power analysis for the behavioral sciences, L. Erlbaum Associates, New York, 1988.
[25] M.W. Browne, Asymptotically distribution-free methods for the analysis of covariance structures, Br. J. Math. Stat. Psychol. 37 (1984) 62–83. doi:10.1111/j.2044-8317.1984.tb00789.x.
[26] R. Kline, Principles and Practice of Structural Equation Modeling, 4th ed., Guilford Press, New York, NY US, 2016.
[27] L. Hu, P.M. Bentler, Cutoff criteria for fit indexes in covariance structure analysis: Conventional criteria versus new alternatives, Struct. Equ. Model. A Multidiscip. J. 6 (1999) 1–55.
doi:10.1080/10705519909540118.
[28] B. Byrne, Structural Equation Modeling with AMOS, 3rd ed., Routledge, New York, NY US, 2016.
[29] C.B. Terwee, S.D.M. Bot, M.R. de Boer, D.A.W.M. van der Windt, D.L. Knol, J. Dekker, L.M. Bouter, H.C.W. de Vet, Quality criteria were proposed for measurement properties of health status questionnaires, J. Clin. Epidemiol. 60 (2007) 34–42. doi:10.1016/j.jclinepi.2006.03.012.
[30] K. Kroenke, R. Swindle, Cognitive-behavioral therapy for somatization and symptom syndromes: a critical review of controlled clinical trials., Psychother. Psychosom. 69 (2000) 205–15.
doi:12395.
ACCEPTED MANUSCRIPT
ACCEPTED MANUSCRIPT
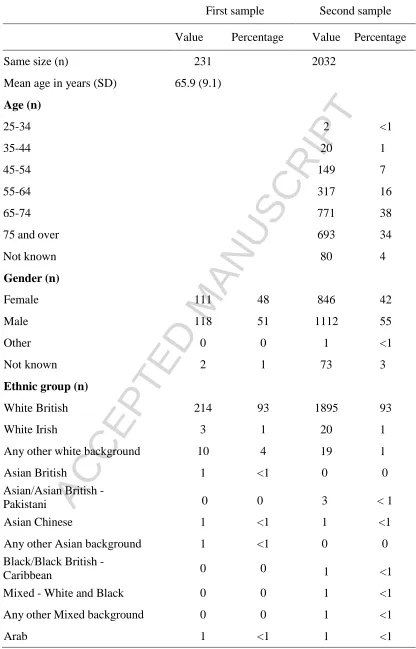
Table 1: Characteristics of samples in first and second validation
First sample Second sample
Value Percentage Value Percentage
Same size (n) 231 2032
Mean age in years (SD) 65.9 (9.1)
Age (n)
25-34 2 <1
35-44 20 1
45-54 149 7
55-64 317 16
65-74 771 38
75 and over 693 34
Not known 80 4
Gender (n)
Female 111 48 846 42
Male 118 51 1112 55
Other 0 0 1 <1
Not known 2 1 73 3
Ethnic group (n)
White British 214 93 1895 93
White Irish 3 1 20 1
Any other white background 10 4 19 1
Asian British 1 <1 0 0
Asian/Asian British -
Pakistani 0 0 3 < 1
Asian Chinese 1 <1 1 <1
Any other Asian background 1 <1 0 0
Black/Black British -
Caribbean 0 0 1 <1
Mixed - White and Black 0 0 1 <1
Any other Mixed background 0 0 1 <1
ACCEPTED MANUSCRIPT
Any other background 0 0 1 <1
Not known 0 0 89 4
Living arrangements (n)
Alone 28 12 316 16
With others (partners, family
&friends) 197 85 - -
Live with spouse/partner - - 1476 73
Live with family/friends - - 94 5
Residential/nursing home 2 1 53 3
Other - - 21 1
Not known 4 2 72 4
Clinical data
Mean age at symptom onset (SD) 57.9 (9.7) - - -
Mean age when diagnosed (SD) 59.7 (9.5) - - -
Time since diagnosis (n)
Less than 2 years - - 271 13
2-10 years - - 1197 59
11-20 years - - 405 20
21 years and over - - 88 4
Not known - - 71 4
ACCEPTED MANUSCRIPT
Table 2: Item loadings on the 6 factors
Factors
1 2 3 4 5 6
I try to focus on what I can do,
rather than what I can’t do -.343
When things aren’t going well, I know how to make myself feel better
-.519
I know what to do to stop
myself worrying -.829
I know how to help myself feel
calm in a stressful situation -.781
I try to focus on the positives in
life -.640
I know how to manage my
stress levels -.797
I know how to manage when
I’m feeling down -.805
I feel I have accepted
Parkinson’s in my life -.368
I know what helps me manage my physical symptoms as much as possible
.613
I know how Parkinson’s affects
me .567
I know where to go to find out more information about Parkinson’s if I need it
.613
I know about the different treatment options for Parkinson’s
.719
I know about what forms of exercise or other physical activities are best for me
ACCEPTED MANUSCRIPT
I know what are the best foods
for me to eat .469
I have worked out how to make my Parkinson’s medication work best for me
.441
I try to stay in touch with family
and/or friends .504
I know who to go to for support
when I’m feeling down .467
I feel I am a part of a
community (local or online) .307 .328
I know who to go to for help when I’m worried about Parkinson’s
.407 .426
I know I can get support from my family or friends when I’m struggling with Parkinson’s
.315
I try to pursue hobbies and other activities I enjoy when I can
.878
I try to engage in social activities with friends and family when I can
.839
I try to take part in activities that are good for my physical health
.748
I try to take part in activities that are good for my mental wellbeing
.777
I try to keep my brain active .769
I try to find ways round challenges so that I can continue to pursue activities I enjoy
.773
ACCEPTED MANUSCRIPT
Note: loading s <0.364 omitted [20] I make time for activities that I
enjoy .822
I try to pursue activities that I
find worthwhile .850
I try to live life to the full as
much as I can .743
I continue to set goals for things
I would like to achieve .405
I plan how I will manage if my health deteriorates when I am out (e.g., I have an off period)
.535
I have ways to help me
remember to do things .567
I organise my diary to ensure that I can manage day-to-day activities
.675
I ensure my plans are flexible so
I can adapt them if I need to .825
I set myself targets for things I
would like to do .503
I share my expertise in Parkinson’s with others whenever I can
.773
I help my family and friends to
ACCEPTED MANUSCRIPT
Table 3: Item loadings on the final 5 factor solution with 15 items
Final factors
1 2 3 4 5
Think positive
I try to focus on the positives in
life .573
I know how to manage my
stress levels .866
I know how to manage when
I’m feeling down .903
Get informed
I know what helps me manage my physical symptoms as much as possible
.445
I know where to go to find out more information about Parkinson’s if I need it
.714
I know about the different treatment options for Parkinson’s
.653
Do things
I try to engage in social activities with friends and family when I can
.755
I try to take part in activities that are good for my physical health
.849
I try to take part in activities that are good for my mental wellbeing
.853
Make plans
I have ways to help me remember to do things
.548
I ensure my plans are flexible so I can adapt them if I need to
ACCEPTED MANUSCRIPT
I set myself targets for things I would like to do
.420
Be involved
I share my expertise in Parkinson’s with others whenever I can
.933
I help my family and friends to learn more about Parkinson’s
.722
I am involved with a national organisation (e.g. Parkinson’s UK)
.428
ACCEPTED MANUSCRIPT
Table 4: Descriptive statistics and internal consistency values for subscales and scale total score in the second validation
Mean Standard Deviation Cronbach alpha
Factor 1: Think positive
Factor 2: Be involved
Factor 3: Do things
Factor 4: Get informed
Factor 5: Make plans
10.74
8.30
10.84
10.23
9.64
2.79
3.49
3.18
2.86
3.01
.87
.80
.86
.77
.79
Total 49.76 12.28 .92
ACCEPTED MANUSCRIPT
Highlights
Perceptions of control are important in determining psychological wellbeing
No current scale exists to measure adaptive control in people with Parkinson’s
A new psychometrically valid scale is presented