warwick.ac.uk/lib-publications
Original citation:
Fei, Xin, Branke, Juergen and Gulpinar, Nalan (2018) New sampling strategies when
searching for robust solutions.IEEE Transactions on Evolutionary Computation.
Permanent WRAP URL:
http://wrap.warwick.ac.uk/103034
Copyright and reuse:
The Warwick Research Archive Portal (WRAP) makes this work by researchers of the
University of Warwick available open access under the following conditions. Copyright ©
and all moral rights to the version of the paper presented here belong to the individual
author(s) and/or other copyright owners. To the extent reasonable and practicable the
material made available in WRAP has been checked for eligibility before being made
available.
Copies of full items can be used for personal research or study, educational, or not-for profit
purposes without prior permission or charge. Provided that the authors, title and full
bibliographic details are credited, a hyperlink and/or URL is given for the original metadata
page and the content is not changed in any way.
Publisher’s statement:
“© 2018 IEEE. Personal use of this material is permitted. Permission from IEEE must be
obtained for all other uses, in any current or future media, including reprinting
/republishing this material for advertising or promotional purposes, creating new collective
works, for resale or redistribution to servers or lists, or reuse of any copyrighted component
of this work in other works.”
A note on versions:
The version presented here may differ from the published version or, version of record, if
you wish to cite this item you are advised to consult the publisher’s version. Please see the
‘permanent WRAP URL’ above for details on accessing the published version and note that
access may require a subscription.
New Sampling Strategies when Searching for
Robust Solutions
Xin Fei, J¨urgen Branke,
Member, IEEE
, Nalˆan G¨ulpınar
Abstract—Many real-world optimisation problems involve un-certainties, and in such situations it is often desirable to identify robust solutions that perform well over the possible future scenarios. In this paper, we focus on input uncertainty, such as in manufacturing, where the actual manufactured product may differ from the specified design but should still function well. Estimating a solution’s expected fitness in such a case is challenging, especially if the fitness function is expensive to evaluate, and its analytic form is unknown. One option is to average over a number of scenarios, but this is computationally expensive. The archive sample approximation method reduces the required number of fitness evaluations by re-using previous evaluations stored in an archive. The main challenge in the application of this method lies in determining the locations of additional samples drawn in each generation to enrich the information in the archive and reduce the estimation error. In this paper, we use the Wasserstein distance metric to approximate the possible benefit of a potential sample location on the estimation error, and propose new sampling strategies based on this metric. Contrary to previous studies, we consider a sample’s contribution for the entire population, rather than inspecting each individual separately. This also allows us to dynamically adjust the number of samples to be collected in each generation. An empirical comparison with several previously proposed archive-based sam-ple approximation methods demonstrates the superiority of our approaches.
Index Terms—Uncertainty, Average-case Robustness, Wasser-stein Distance, Archive Sample Approximation.
I. INTRODUCTION
G
IVEN its ubiquity in many real-world problems,optimi-sation under uncertainty has gained increasing attention. Uncertainty may originate from various sources, such as imprecise model parameters or fluctuations in environmental variables. In the presence of uncertainty, it is often desirable to find a solution that is robust in the sense of performing well under a range of possible scenarios [1]. More specifically, our paper considers searching for robust solutions in the sense of high expected performance, given a distribution of distur-bances to the decision variables. This is a typical scenario for example in manufacturing, where the actually manufactured products may differ from the design specification due to manufacturing tolerances.
Evolutionary algorithms (EAs) have been applied to solve various optimisation problems that involve uncertainties, see [2] for a survey. There are also different concepts related to robustness, including optimising the worst-case performance [3], robust optimisation over time [4], and active robustness [5]. The most widely researched robustness concept however,
Xin Fei, J¨urgen Branke and Nalˆan G¨ulpınar are with Warwick Business School, The University of Warwick, Coventry CV4 7AL, UK.
and the concept we consider in this paper, is to optimise a solution’s expected fitness (often called effective fitness in the literature) over the possible disturbances [1].
To estimate an individual’s effective fitness, sampling has been widely adopted in practice, and two sampling methods
can be distinguished. Implicitsampling refers to the idea that
because EAs are population-based, an over-evaluated individ-ual due to a favourable disturbance can be counterbalanced by an under-evaluated neighbouring individual, and so simply increasing the population size should help guiding the EA in the right direction [6], [7]. In fact, as shown in [8], under the assumption of infinite population size and fitness-proportional selection, evaluating each solution at a single disturbed sample location instead of its actual location is equivalent to optimis-ing the expected fitness directly. [7] proposed to increase the
population size whenever the algorithm gets stalled. Explicit
sampling, on the other hand, evaluates each individual multiple times and estimates its fitness as the average of the sampled evaluations. Obviously, while averaging over multiple evalu-ations increases the estimator accuracy, it is computationally rather expensive. A recent analytical study on the efficiency (progress rate) of implicit as well as explicit sampling-based evolution strategies can be found in [9].
Because of the large computational cost of sampling in case of expensive fitness functions, numerous studies have focused on allocating a limited sampling budget to improve the estimation accuracy, allowing to reduce the number of samples needed without degrading the performance of the EA. One possible approach for estimating effective fitness is to apply quadrature rules or variance reduction techniques [10]–[13]. Some authors observed that allocating samples in a manner that increases the probability of correct selection is more important than the accuracy of estimation [14], [15].
Another approach, called archive sample approximation (ASA), stores all past evaluations in a memory and uses this information to improve expected fitness estimates in future generations (for further information, refer to [10] and [16]). ASA can also be combined with the above sampling allocation methods to further enhance the accuracy of approximation. We have recently proposed an improved ASA method that uses the Wasserstein distance metric (a probability distance that quantifies the dissimilarity between two statistical objects) to identify the sample that is likely to provide the most valuable additional information to complement the knowledge available in the memory [17].
in the WASA framework. Here, a new sampling strategy based on WASA is presented, which improves the performance in three ways:
1) A heuristic that considers what sample might provide
the most valuable information for all individuals in
the population simultaneously, thereby enhancing the
performance of the final solution and accelerating the convergence of the EA toward a high-performance so-lution;
2) Introducing the concept of an approximation region that could improve the performance of the sampling strategy when few samples exist; and
3) Proposing a sample budget mechanism to adjust the sampling budget in the WASA framework.
The paper is structured as follows. Section II provides a brief overview of existing archive sample approximation methods. We then present our new approaches to allocating samples in Section III. These approaches are evaluated em-pirically using benchmark problems, and their performances are compared with other approaches in Section IV. The paper concludes with a summary and some ideas for future work.
II. ARCHIVE SAMPLE APPROXIMATION
The problem of searching for robust solutions can be defined
as follows. Consider an objective function f : x → R
with design variables x ∈ Rm. The noise is defined on the
probability space (Ξ,B(Ξ),P) where Ξ = Qm
i [`i, ui] is a
sample space, B(Ξ) is the Borel σ-algebra on Ξ and P is
the probability measure on B(Ξ). For a particular solution x,
locationZx is random under this noisy environment, which is
defined as:
Zx=x+ξ, ξ∈Ξ. (1)
We then define the induced probability space for Zx as
(Dx,B(Dx), Px), where Dx is the disturbance region as the
set covering all possible locations as a result of disturbing
solution xdefined by:
Dx=
m
Y
i=1
[xi+`i, xi+ui]; (2)
and Px is the probability measure defined so that, for
φ∈ B(Dx),
Px(φ) =P(Z−1
x (φ)). (3)
Without loss of generality, for minimisation, the goal is to minimise the effective fitness, that is, the expected perfor-mance over the disturbance region as follows:
min fef f(x) =E[f(x)] =
Z
Dx
f(z)dPx(z). (4)
As the fitness formulation is unknown in many industrial applications, the integral cannot be computed directly. In prac-tice, we can numerically compute this integral using sampling
techniques. Let Zxˆ = {zn| n ∈ N} be the realisations of
random location Zx. The empirical probability measure (i.e.
probability distribution) of these samples is a discrete
proba-bility measure, which can be defined so that, forφ∈ B( ˆZx),
ˆ
Px(φ) = 1
|N|
X
n∈N
1φ(zn), (5)
where1φ(·) is the indicator function. If the sample size |N|
is sufficiently large, the effective fitness can be well estimated as follows:
fef f(x)≈ X
n∈N
f(zn) ˆPx(zn). (6)
However, if evaluating the fitness function is computationally expensive, this may not be possible.
The ASA approach originally proposed in [18] saves pre-viously evaluated points in the search space and their
corre-sponding fitness values in an archiveA. Generally, the archive
A is a set of ordered pairs (z, ρ), where z is the sample
location and ρ is its fitness value. The archive information
can be reused when estimating the expected fitness of a new solution. ASA performs three main steps during a fitness evaluation.
1) The previously evaluated points which are in the
solu-tion’sdisturbance regionare retrieved from the archive.
Given the disturbance region Dx, the available archive
information can be identified as
Ax={(z, ρ)∈ A| z∈Zx}.
2) A sampling strategy is used to determine at what
additional locations samples should be collected. Let
Cx denote the new sample locations. It is desirable to
select a set of sample points Cx which maximise our
knowledge of the fitness landscape in the disturbance region.
3) All samples located within the disturbance region Dx
need to be assigned probabilities. Then, the estimated
effective fitnessfef fˆ (x)can be calculated as
ˆ
fef f(x) = X
a∈Ax
a(2)Qx(a(1))
| {z }
Archive information
+X
c∈Cx
f(c)Qx(c)
| {z }
New information
where Qx(·) is the point probability; a(1) and a(2)
represent the first and second elements of the ordered
pair in the archive Ax.
The overall procedure integrating ASA into an EA is visualised in Fig. 1.
In the simplest ASA, the sampling strategy randomly evalu-ates new points within the disturbance region and assigns equal probabilities to all available samples, see, e.g., [10]. However, if the distribution of available samples in the disturbance
region is not representative of Zx, the resulting estimation
CMA_ES Initialisation Effective fitness
evaluation Mutation and
Recombination Selection
New generation Evolutionary Algorithm
Final solution Stopping
criteria
Yes No Decision Space
Disturbance Region Archive Sample Approximation
. . .
1
Search Archive Samples
Individual
Individual Evaluate Fitness
of All New Samples
Update Archive Search Archive Samples Identify Optimal Probabilities of Archive Samples Perform Sampling Strategy
3
x x1
2
[image:4.612.88.527.57.183.2]Solution’s disturbed location Archive sample
Fig. 1. Illustration of integrating ASA into an EA.
III. THEWASSERSTEIN-BASED ARCHIVE SAMPLE
APPROXIMATION
Given the archive samples, we aim to provide an accurate estimation of effective fitness for each individual by sampling additional locations. The estimation error with respect to effective fitness is defined as follows:
eef f(x) =|fef f(x)−fef fˆ (x)|. (7)
In reality, estimation error cannot be computed given that the
actual effective fitnessfef f(x)is unknown. Therefore, we use
Wasserstein distance as an upper bound approximation for the estimation error. We call this framework Wasserstein-based archive sample approximation.
In the following subsections, we first introduce the formu-lation of Wasserstein distance, explain the principle behind WASA and describe the underlying sampling problem of WASA. Then, we enhance the description of the sampling strategy used in our previous work [17] and propose a new population-based myopic sampling strategy.
A. The Wasserstein Distance Metric
The Wasserstein distance metric (also known as the Earth mover’s distance) is a statistical distance between two prob-ability measures, which can be computed by solving the Monge-Kantorovich transportation problem [21]. The two probability measures in the Wasserstein distance are consid-ered as warehouses and destinations. The distance value be-tween two probability measures is determined by the minimum transportation cost from warehouses to destinations.
More formally, let % and ν be probability measures with
samples G={gj| j∈J} and H = {hk| k ∈ K}, and
corresponding probabilities {%j|j ∈ J} and {νk|k ∈ H},
respectively. Let Ψdenote the set of all joint measures with
marginal measures % andν. The Wasserstein distance metric
between%andν can be formulated as
W(%, ν)=.
min
ψ∈Ψ
X
k∈K
X
j∈J
d(gj, hk)ψ(%j, νk)
s.t. X
j∈J
ψ(%j, νk) =νk, ∀k
X
k∈K
ψ(%j, νk) =%j, ∀j
ψ(%j, νk)≥0, ∀j, k,
(8)
where the distance d(gj, hk) between locationsgj and hk is
measured by the Euclidean distance i.e.,
d(gj, hk) =kgj−hkk2. (9)
Different from other divergence measures such as the Kullback-Leibler divergence, the Wasserstein distance works on arbitrary sets and doesn’t assume that one random set is a subset of another. The reader is referred to [22] for further information on the Wasserstein distance metric.
B. The Upper Bound Approximation for Estimation Error
As discussed in Section II, the effective fitness of a par-ticular solution can be numerically computed by using a set of samples. If the number of samples is large enough, the corresponding empirical probability measure will converge to the actual probability. Given that the computational cost of evaluating a sample is expensive, we aim to approximate this “large” empirical probability measure with a “smaller” discrete probability measure. The challenge is how to estimate the corresponding estimation error. Since the actual effective fitness cannot be computed in practice, the estimation error cannot be obtained directly.
In this paper, we provide an upper bound approximation of the estimation error (stated in Theorem 1) that can be calculated without requiring any fitness information.
Theorem 1: Suppose that we have two discrete
probabil-ity measures ν and %. The effective fitness is numerically
probability measure approximating %. If the fitness function
f :x→Ris Lipschitzian, then the estimation error satisfies
X
j∈J
f(gj)%j−X
k∈K
f(hk)νk
≤α W(%, ν) (10)
whereαis a positive constant.
Proof: See Appendix A of the online supplement.
Theorem 1 implies that the estimation error with respect to two discrete probability measures can be upper bounded by the Wasserstein distance. For practical applications, the fitness function in the disturbance region might be intermittent or non-Lipschitz. In this case, the aforementioned upper bound still holds if two probability measures are identical.
C. The Modified Wasserstein Distance Metric
Before explaining the WASA framework, we introduce a modified Wasserstein distance metric used in sample sets
with known and unknown probabilities. The probability ν is
assumed to be unknown. This metric provides the optimal
probability measure{νj|j∈J}, which results in the smallest
Wasserstein distance value. We define the modified
Wasser-stein distance metric M(G, H) between two samples Gand
H as follows,
M(G, H) = min
νk
W(%, ν)=.
min
ψ∈Ψ,νk
X
k∈K
X
j∈J
d(gj, hk)ψ(%j, νk)
s.t. X
k∈K
ψ(%j, νk) =%j, ∀j
X
k∈K
νk= 1, νk≥0, ∀k
ψ(%j, νk)≥0, ∀j, k.
(11)
Note that the computational cost for solving the above optimi-sation problem is high for a large-scale distance comparison. However, when the strong duality property holds, the objective values of the dual and primal problems are identical, which can be used to solve the optimisation problem (11).
Letηj for j∈J denote a vector of dual decision variables
assigned to the first set of constraints of problem (11) by ignoring the second set of constraints. Then, the dual problem for (11) can be derived as,
M(G, H) = max
ηj
X
j∈J %jηj
s.t. ηj≤d(gj, hk), ∀j, k.
(12)
Due to the special structure of inequality in the constraints
of the dual problem (12), the optimal decision variables η∗
j can be easily determined. The optimal dual decision is the
minimum Euclidean distance from the samplehkto the sample
gj, and can be calculated as
η∗j = min
hk d(gj, hk), ∀j. (13)
Once the optimal dual decision variableη∗
j has been
deter-mined, the Wasserstein distance M(G, H) can be computed
as
M(G, H) =X
j∈J
%jηj∗. (14)
Additionally, the probability measureν can be computed as
νk=X
j∈J
1gj(hk)%j, ∀k (15)
where1gj(hk)is an indicator function and defined as
1gj(hk) =
1, if hk is the closest sample togj
0, otherwise. (16)
The overall procedure for efficiently computing the modified Wasserstein distance value is described in Algorithm 1.
Algorithm 1 Efficient method for computingM(G, H)
Inputs:
• SamplesG={gj|j∈J}with probabilities{%j|j∈J}
• SamplesH ={hk| k∈K}.
Outputs:
• Modified Wasserstein distance value M(G, H).
• Optimal probabilities{ν∗
k| k∈K} for samplesH.
forj∈J, k∈K do
Compute Euclidean distance d(gj, hk)using (9).
end for forj∈J do
Find the optimal dual solution η∗
j using (13).
end for
Compute the distance valueM(G, H)via (14).
Compute the optimal probabilities{ν∗
k| k∈K} as in (15).
D. The WASA Sampling Problem
In this subsection, we introduce the sampling problem in
WASA. Let xl for l ∈ Λ = {1, . . . , λ} denote the l-th
individual from a particular population during the EA search
process. Using similar notation as in Section II, let Zl for
l∈Λbe the random location of individualxl, which is defined
on the probability space (Dl,B(Dl), Pl). We then generate a
large set Zlˆ ={zn,l∈Dl|n∈N} from the random location
Zlto represent the disturbed locations of each individual. The
empirical probability measure of these disturbed locations is
denoted byPlˆ. Note that these large sample sets are used only
when computing the Wasserstein distance value and as a set of candidates for evaluation.
Given an archive A that consists of previously evaluated
solutions, the available archive samples for individualxl can
be retrieved as follows:
Al={(z, ρ)∈ A| z∈Dl}. (17)
Then, the previously evaluated sample locations Sl can be
identified as
The optimal sampling problemis to minimise the total effec-tive fitness estimation error over all individuals at the present EA’s generation by searching:
• the best additional sample locations Cl; and
• the optimal probability measure Qlon B(Cl∪Sl)
We can formulate the aforementioned problem by using the following optimisation model:
min
Cl,Ql
X
l∈Λ
eef f(xl) =X
l∈Λ
|fef f(xl)−fef fˆ (xl)|
s.t. fef f(xl) = X
n∈N
f(zn,l) ˆPl(zn,l),∀l
ˆ
fef f(xl) = X
a∈Al
a(2)Ql(a(1)) +X
c∈Cl
f(c)Ql(c),∀l
X
a∈Al
Ql(a(1)) +X
c∈Cl
Ql(c) = 1, Ql(·)≥0,∀l
X
l∈Λ
|Cl|=B, Cl⊆Zl,ˆ ∀l.
(19)
As previously discussed, some fitness information in (19) is unavailable. Therefore, the optimal sampling problem cannot be directly solved. By applying Theorem 1, we approximate the optimal sampling problem by using the Wasserstein dis-tance as follows:
min
Cl,Ql
X
l∈Λ
W( ˆPl, Ql) = min
Cl
X
l∈Λ
M( ˆZl, Cl∪Sl)
s.t.X
l∈Λ
|Cl|=B, Cl⊆Zl,ˆ ∀l (20)
where B is the evaluation budget. This new approximate
formulation is referred to as the WASA sampling problem. The details of derivation of the optimisation model (20) are provided in Appendix B of the online supplement.
Essentially, we minimise the upper bound approximation of the estimation error in order to provide heuristic sample locations without requiring any fitness information. Although the WASA sampling problem is a nonlinear and non-convex optimisation problem, it is still solvable. The optimal solution for this approximate problem formulation can be found by repeatedly solving the following four related steps:
1) Fixing the cardinality |Cl| for l ∈ Λ such that
P
l∈Λ|Cl|=B.
2) Selecting the new samplesCl fromZlˆ.
3) Constructing the sample setYlfor each individualxl as
follows,
Yl=Sl∪Cl, ∀l. (21)
4) Computing the modified Wasserstein distance value
M( ˆZl, Yl) for l ∈Λ by applying Algorithm 1 to solve
the following optimisation model.
min
Ql,ψl
X
z∈Zlˆ
X
y∈Yl
d(z, y)ψl( ˆPl(z), Ql(y))
s.t. X
y∈Yl
ψl( ˆPl(z), Ql(y)) = ˆPl(z), ∀z∈Zlˆ
X
y∈Yl
Ql(y) = 1, Ql(y)≥0, ∀y∈Yl
ψl(z, y)≥0, ∀z∈Zl, yˆ ∈Yl.
(22)
Generally, the optimal solution of the WASA sampling problem cannot be obtained within a reasonable time. For
instance, there exist two individualsx1 andx2 at a particular
EA’s iteration. Consider that the cardinalities ofZˆ1andZˆ2are
200. Given the sampling budget B = 2, we have three ways
to allocate this sampling budget tox1 andx2.
(|C1|,|C2|)∈ {(1,1),(2,0),(0,2)}.
If we should take one sample from Zˆ1 and one form Zˆ2,
then we have 40,000 sample combinations. In case of taking
two samples from Zˆ1 or two from Zˆ2,19,900 combinations
are found. This basically results in 79,800 repetitions for
performing the four related steps to find the optimal solution. The small case shows that heuristic approaches to solve the WASA sampling problem are needed.
In the next subsection, we introduce two Wasserstein-based sampling strategies aimed at efficiently making sampling decisions for the above WASA sampling problem.
E. Equal Fixed Sampling Strategy
A straightforward way to simplify the WASA sampling problem is to consider each individual separately, and allocate to each individual the same fixed number of new samples. We call this strategy Equal Fixed Sampling (EFS). The sampling budget in EFS must be an integral multiple of the number of individuals. EFS is an iterative method that determines one new sample point at each step. Algorithm 2 describes the overall procedure of incorporating the EFS strategy into WASA.
For individual xl, EFS first retrieves previously evaluated
informationAl from the archiveAand identifies the archive
sample locations Sl by using (18). Then, EFS constructs the
candidate setsYn,lforn∈Nby uniting one of the individual’s
disturbed locationszn,l with archive points as follows:
Yn,l=zn,l∪Sl, ∀n∈N. (23)
EFS evaluates the modified Wasserstein distance value
VEF S(zn,l)of each disturbed location zn,las
VEF S(zn,l)=. M(Yn,l,Zlˆ), ∀n∈N. (24)
EFS next selects and evaluates the new sample point z∗
resulting in the smallest value, i.e.,
z∗=argmin{VEF S(zn,l)| n∈N}. (25)
The fitness of this point is evaluated and the new sample
information will be added into the archive A. The process
repeats until the algorithm runs out of sampling budget for this individual.
When this iterative process has been completed, EFS
re-trieves the archive samplesA∗
l from theupdatedarchive. The
previously evaluated sample locations for the individualxlcan
be identified as follows,
Now we compute the optimal probabilitiesQlforY∗
l by using
(22). Then, the estimated effective fitness of each individual can be calculated as
ˆ
fef f(xl) = X
a∈A∗
l
a(2)Ql(a(1)). (27)
Algorithm 2 The procedure of including EFS into WASA
Inputs:
• Set of disturbed locations Zlˆ = {zn,l| n ∈ N} with
empirical probability measurePlˆ forl∈Λ.
• Sampling budgetB.
• ArchiveA.
Outputs:
• Estimated effective fitnessfef fˆ (xl)for l∈Λ.
forl∈Λ do
Retrieve archive informationAl using (17).
Identify sample locationsSl fromAlas in (18).
forb∈ {1, . . . , B/λ} do
forn∈N do
Construct the candidate setYn,l using (23).
Compute theVEF S(zn,l)value via (24).
end for
Find z∗=argmin{VEF S(zn,l)| n∈N}.
Evaluate the fitness of the best locationf(z∗).
Update the archive A ← A ∪(z∗, f(z∗)).
end for end for forl∈Λ do
Retrieve the archive informationA∗
l as in (17).
Construct the archive sample setY∗
l via (26).
Calculate the probability measurePlˆ onY∗
l using (22).
Compute the effective fitnessfef fˆ (xl)as in (27).
end for
Fig. 2 illustrates EFS by using a 2D example. Let us
consider the solution located at (0,0), which is represented
as a grey solid hexagon, assume the sampling budget of this
solution is one, and the disturbance region is from −1 to 1
in x- and y-directions. We approximate the disturbance region
by using Latin hypercube sampling to generate6disturbances.
The corresponding disturbed locations of this solution are represented by grey solid circles. In the disturbance region, there are two archive points which are depicted as black solid
circles. We now calculate the VEF S value of each disturbed
location. The results are shown in Fig. 2 (a). We can find that
the best sample point is the grey solid circle whose VEF S
value is 0.8486. Fig. 2 (b) describes how to determine the
probabilities of samples used to estimate the effective fitness.
The probability of each disturbed location is 0.1667 because
the total number of disturbed locations is six in this example.
The black solid circle located at(0.1600,0.2000)is the point
closest to the grey solid circle (−0.1863,0.1745). According
to probability re-allocation rules (15), the new probability
for this black solid circle is 0.1667. The new sample point
marked by a triangle is the best representation of the two grey solid circles. However, the new probability of this point is
0.5000because this point is also the nearest to itself. The new
probabilities of the other black solid circles can be assigned following the same procedure.
F. Population-based Myopic Sampling Strategy
EFS may spend unnecessary sampling on an individual that already has a small Wasserstein distance value but ignores the needs of an individual with large Wasserstein distance value. This inefficient sampling allocation frequently appears in the search process because of the exploration and exploitation strategies used in the EAs. The current promising area on the decision space is exploited repeatedly, and the archive set already contains adequate information for approximating the effective fitness landscape of individuals in this area. However, the archive does not contain information on previously unex-plored areas, and in those areas new sampling is indispensable. To alleviate this problem, we propose here population-based myopic sampling (PMS). The key idea is to allow sampling, at each step, the disturbed location of any individual that greatly minimises the average Wasserstein distance over the entire population. This sampling strategy is particularly effective when disturbance regions partially overlap one an-other, because one additional sample point might contribute to improving the fitness estimate for several individuals. PMS furthermore introduces the concept of an approximation region which may be chosen different from the disturbance region and allows the use of archive samples also outside the immediate disturbance region. Finally, since the budget in a generation no longer needs to be a multiple of the population size, we introduce a mechanism to adapt the sampling budget of each generation depending on the change in the average Wasserstein distance over the entire population. Algorithm 3 describes the overall procedure of including PMS into WASA. In the following, we present the core ingredients of PMS, including approximation region, myopic sampling location selection, and sampling budget adjustment.
1) Approximation region: Generally, ASA begins with the
search of available archive points which are located within the individual’s disturbance region. If the archive contains only a small number of available points, it may improve the estimation of the effective fitness to additionally include archive points slightly outside the disturbance region. In PMS,
we call this enlarged region approximation region. Let Rl
denote the approximation region of individual xl. Given the
sample spaceΞof noise, the size of approximation regionRl
is controlled by a parameterκ (κ≥1), which is defined as
follows,
Rl={xl+ς| ς ∈
m
Y
i=1
[κ∗`i, κ∗ui]}. (28)
Obviously, the largerκ, the more archive samples are used
for fitness estimation. On the other hand, if κ is chosen too
large, the archive points may be located too far from the individual’s disturbance region, thereby causing unpredictable
errors in effective fitness estimation. So,κneeds to be chosen
Y
X
-1.0 1.0
-1.0 1.0
0.5 0.5
-0.5 -0.5
Disturbance Region
Decision Space
1.0957
0.8486 0.8508
0.9596 0.9648
1.0458
Best sampling location Solution’s disturbed location Archive sample
Solution location
(a) Selection process in EFS.
Y
X
-1.0 1.0
-1.0 1.0
0.5 0.5
-0.5 -0.5
Disturbance Region
Decision Space
0.1667 0.3333
0.5000
Best sampling location Solution’s disturbed location Archive sample
Solution location
[image:8.612.366.493.62.206.2](b) Probability assignment in EFS.
Fig. 2. Description of using EFS.
Algorithm 3 The procedure of including PMS into WASA
Inputs:
• Set of disturbed locations Zlˆ = {zn,l| n ∈ N} with
empirical probability measurePlˆ forl∈Λ.
• Sampling budgetB∈[Blower, Bupper].
• ArchiveA.
• Approximation region parameterκ.
• Average Wasserstein distanceW¯t−1.
Outputs:
• Estimated effective fitnessfef fˆ (xl)for l∈Λ.
• Average Wasserstein distanceW¯t.
Initialise b←0.
forl∈Λ do
Set approximation regionRl via (28).
end for
while b < Bupper do
Retrieve archive samplesAl for l∈Λusing (17).
Identify sample locationsSlfromAlforl∈Λvia (18).
forl∈Λ, n∈N do form∈Λdo
Construct the candidate setYl,n,m as in (29).
end for
Compute the VP M S(zn,l)value via (30).
end for
Findz∗=argmin{VP M S(zn,l)|n∈N, l∈Λ}.
Evaluate the fitness of the best locationf(z∗).
Update the archiveA ← A ∪(z∗, f(z∗)).
Compute theW¯tvalue using (33).
ifW¯t−1>W¯t andb > Blower then
b=Bupper //Stop sampling.
else
Set b←b+ 1.
end if end while forl∈Λ do
Retrieve the archive informationA∗
l as in (17).
Construct the archive sample setY∗
l via (26).
Calculate the probability measurePlˆ onY∗
l using (22).
Compute the effective fitnessfef fˆ (xl)as in (27).
end for
Fig. 3 illustrates the benefit of including additional archive
points. The solution is located at(0,0), whilst its disturbance
region is from −1 to 1 in x- and y-directions. The black
solid circles denote the archive points, among which three are located within and two outside the disturbance region. The grey solid circles represent the disturbed locations of this solution. If we restrict ASA to the disturbance region, the minimum Wasserstein distance we can obtain from the two black solid points and one grey solid point to be
addition-ally evaluated is 2.276. If we set the approximation region
parameter κ as 120%, the grey squiggle in Fig. 3 denotes
the extension region with respect to the solution’s disturbance region. Two additional archive points can be used to estimate effective fitness. Accordingly, the best Wasserstein distance value we can obtain from the four black and one grey points
reduces to1.2935. This example demonstrates that an enlarged
approximation region may reduce the Wasserstein distance.
Y
X
1.0 1.0
0.5 0.5
-0.5 -0.5 Disturbance Region
Decision Space
-1.0
-1.0
Solution’s disturbed location Archive sample
[image:8.612.370.499.481.626.2]Solution location Extension Region
Fig. 3. Using approximation region in WASA.
2) Myopic sampling location selection: Given the archive
samples of each individual, PMS myopically selects the best sampling point. This myopic strategy iteratively builds candi-date sets by combining a new sample at one disturbed location of any individual with the archive samples of any individual, as described in the following equation:
withn∈N,m∈Λandl∈Λ. The myopic selection criterion is based on the average Wasserstein distance for the entire
population. Let VP M S(zn,l) represent the average modified
Wasserstein distance value by sampling the disturbed location
zn,l. Then, we can write the VP M S(zn,l)value as follows:
VP M S(zn,l) = X
m∈Λ
1Rm(zn,l)M(Yl,n,m,Zmˆ ) (30)
where1Rm(zn,l)is an indicator function, defined as
1Rm(zn,l) =
1, if zn,l∈ R
m
0, otherwise (31)
that controls that a sample only contributes to an individual’s Wasserstein distance calculation if it is within its approxima-tion region.
Disturbance Regionx2
Disturbance Regionx1
X Y
0.5 1 1.5
-0.5 -1.0 -1.5
0.5
-0.5 1.0
-1.0 0.9551
0.7603 0.6737
0.7736
1.0625
0.9877 0.9866
0.9196
Decision Space
1.0770
0.8197
Solution’s disturbed location Archive sample
Solution location
Best sampling location
[image:9.612.77.262.249.422.2]Extension Region
Fig. 4. TheVP M Svalue computation in PMS.
Fig. 4 explains how to compute the VP M S value in the
PMS strategy. As shown in Fig. 4, two candidate solutions
x1 and x2 are respectively located at (−0.666,−0.333) and
(0.666,0.333). The disturbance region of each solution is
represented by6Latin hypercube samples (grey solid circles).
The approximation region parameter κ is set to be 130%.
The grey squiggle is the extension region with respect to the disturbance region. Given the budget to sample one new point, we need to determine which grey point is the best
sampling location for these two solutions (x1 andx2) when
it is combined with the archive points (black). Note that the grey points outside the overlapped approximation region, for
instance,(−1.5340,−0.6312), only contribute to one solution.
The VP M S value for each grey point is shown in Fig. 4.
It can be observed that the sample location (0.3000,0.5100)
(triangle) allows for the smallest average Wasserstein distance for these two solutions.
3) Sampling budget adjustment: PMS allows the automatic
reduction of the sampling budget used during an iteration of the EA if the archive already provides plenty of information on candidate individuals. The sampling budget is adaptively deter-mined by the average Wasserstein distance over all individuals. We attempt to decrease this average distance monotonously. Considering a progressing evolution, we like to derive
im-proved estimates for effective fitness. Given VP M S(zn,l) for
n∈N andl∈Λ, the best sampling location can be identified
as follows:
z∗=argmin{VP M S(zn,l)| n∈N, l∈Λ}. (32)
Then, we can compute the average modified Wasserstein
distanceW¯ at the current populationtas follows:
¯
Wt=
X
l∈Λ
1Rl(z∗)M(z∗∪Sl,Zlˆ) + (1−1Rl(z∗))M(Sl,Zlˆ).
(33) PMS stops sampling for the current population when the current average Wasserstein distance using the usable samples is less than the recorded average Wasserstein distance of the
previous populationt−1. In other words,
¯
Wt<W¯t−1. (34)
In practical use, we suggest to assign lower and upper limits for the number of new samples evaluated in each iteration. The lower limit ensures that a minimum additional knowledge on the underlying fitness landscape is collected in each iteration. It also prevents getting permanently stuck in an artificial optimum of a false approximation model. The upper bound prevents the spending of a large number of samples in the current population. Given that EAs are iterative search methods, the samples must also be allocated to the future population rather than extensively sampling the fitness for the current population.
IV. EMPIRICALRESULTS
In this section, we examine the effect of varying algorithmic parameters on the performance of the PMS strategy. Moreover, we empirically compare the WASA strategies with several other ASA approaches from the literature using a variety of benchmark problems with different landscape features as well as a real-life robust design problem. All results are averaged over 30 independent runs with different random seeds.
A. Experimental Setup for Artificial Benchmark Problems
1) Overview of Artificial Benchmark Problems: We have
chosen six artificial benchmark problems from the literature, their mathematical formulations can be found in Appendix C of the online supplement. Fig. 5 provides one-dimensional visualisations of the original and effective fitness landscapes. The test problems have different characteristics:
• TP 1, taken from [23], has a discontinuous unimodal
original fitness landscape. The peaks of the original and effective fitness landscapes are asymmetric and located next to each other. This problem characteristic can test an algorithm’s ability to precisely identify the peak of effective fitness at the discontinuous landscape.
• TP 2, adopted from [23], can be viewed as the continuous
version of TP 1.
• TP 3, adopted from [18], has multimodal original and
effective fitness landscapes. The global optimum of the
original fitness(x= 1)is a local optimum of the effective
estimates in the early phase of optimisation may misdirect the EA towards the wrong region.
• TP 4, taken from [23], has two global minima in the
effective fitness landscape. The global minimum of the original fitness is a local maximum of the effective fitness.
• TP 5, adapted from [23], combines the problem
charac-teristics of TP 2 and TP 3.
• TP 6, taken from [8], has the global minima of the
effective fitness landscape as being the local minima of the original fitness landscape.
2) Evolutionary Algorithm: Essentially, the archive-based
approximation is a part of the EA’s fitness evaluation proce-dure. Therefore, it is straightforward to integrate our proposed sampling strategies into any evolutionary algorithm. We have adopted the covariance matrix adaptation evolution strategy (CMA-ES) for the experiments. CMA-ES is implemented based on the MATLAB toolbox [24]. We have modified the fitness evaluation procedure in this toolbox and integrated the various sampling strategies. The used parameter settings of the CMA-ES toolbox are listed in Table I.
TABLE I
THECMA-ESPARAMETER SETTINGS
CMA-ES Parameters Selected Settings
(µ, λ) (4,8)
initial standard deviation 1
4 search interval width
recombination equally weighted recombination
initial point centre of search interval
total number of evaluations 1,600
3) Solution Selection & Performance Measure: We
em-ploy the best observed individual, i.e. the individual with best estimated effective fitness, at the final generation as the solution that would be reported to the decision-maker. The actual effective fitness of the selected solution is evaluated by
10,000 Monte-Carlo samples generated from the underlying
noise. Moreover, we look at the algorithm’s convergence and the average effective fitness over the whole run. Ideally, we would expect the sampling approach to have a fast convergence and to provide a high-quality solution at the final generation.
4) Disturbance Generation for WASA: The performance of
WASA is closely associated with the way the approximate
uncertainty set Zlˆ is generated. We use 243 Latin hypercube
disturbances for all individuals within a generation, which reduces the variance in comparing the effective finesses in an uncertain environment. To avoid over-fitting to a specific set of disturbances, we change the set of disturbances at each iteration of the EA.
B. Performance of the PMS Strategy Depending on Approxi-mation Region Parameter
We numerically study the effect of using various
approxi-mation region parameters (κ=100%, 120%and infinity). The
lower and upper limits of the sampling budget at each iteration
are fixed at4 and8, respectively. Fig. 6 presents the
conver-gence of the average effective fitness of the best observed solution.
As can be seen, the convergence towards high-performance solutions can be accelerated by using a proper approximation region parameter. Given the same amount of evaluations,
PMS-120%performs better than PMS-100%. The superiority
of using PMS-120% is significant before 1,000 evaluations,
because early in the run, information in the archive is sparse, and the wider approximation region can use more archive samples in the individual’s effective fitness estimation. At
the end of the run, the PMS-120% strategy is able to find
better solutions than all other strategies in all test problems, indicating that a proper setting of the approximation region prevents CMA-ES from early convergence towards local op-tima by incorporating more archive samples in the effective fitness estimation.
In all benchmark problems, the average effective fitness of
using PMS-infinity deteriorates during the first 100
evalua-tions, though this value is improved quickly at later evalu-ations. The reason is that the new sampling locations deter-mined by PMS-infinity are always located at the centre of a cluster of individuals when the archive is empty or contains only few samples, which actually misleads the EA search process. This negative effect becomes serious in test problems TP 5 and TP 6, because the problem characteristics demand that the robust approach is able to identify the correct search area early on. Otherwise, the EA search process converges towards local optima.
To support Fig. 6, Table II reports on the average
effec-tive fitness obtained over all 1,600 evaluations of the run.
Again, we can observe that PMS-120% provides the fastest
convergence pattern among these three strategies for all test functions. PMS-infinity displays good convergence in TP 1, 2 and 4. Additionally, Table III presents the performance of the final solution at the end of the EA search process.
These results show that PMS-120%has the best performance
in all benchmark problems, and PMS-infinity presents a
per-formance advantage over PMS-100%. However, PMS-infinity
performs worse than PMS-120%in most of the test functions.
The results confirm the theoretical ground discussed in Section III, namely that a moderate increase of the approximation region beyond the disturbance region is useful, but too much may lose its benefit.
TABLE II
AVERAGE EFFECTIVE FITNESS OVER1,600EVALUATIONS
Test Problem Mean±Std. err.
PMS-100% PMS-120% PMS-infinity
TP 1 0.150±0.003 0.140±0.003 0.145±0.002 TP 2 0.674±0.014 0.634±0.014 0.651±0.014 TP 3 0.901±0.015 0.848±0.025 0.890±0.021
TP 4 0.192±0.001 0.190±0.001 0.191±0.001
TP 5 0.528±0.009 0.495±0.018 0.527±0.022
TP 6 0.458±0.006 0.452±0.006 0.469±0.008
0 1 2 3 4 5 6 7 8 9 10 0
0.2 0.4 0.6 0.8 1 1.2
0 1 2 3 4 5 6 7 8 9 10 0
0.1 0.2 0.3 0.4 0.5 0.6 0.7 0.8 0.9 1
-2 -1.5 -1 -0.5 0 0.5 1 1.5 2 0
0.2 0.4 0.6 0.8 1 1.2 1.4 1.6 1.8
0 0.1 0.2 0.3 0.4 0.5 0.6 0.7 0.8 0.9 1 0
0.1 0.2 0.3 0.4 0.5 0.6 0.7 0.8
0 1 2 3 4 5 6 7 8 9 10 -1.5
-1 -0.5 0 0.5 1 1.5 2 2.5 3
0 0.1 0.2 0.3 0.4 0.5 0.6 0.7 0.8 0.9 1 0
[image:11.612.103.511.55.259.2]0.2 0.4 0.6 0.8 1 1.2
Fig. 5. 1-D visualisation of original and effective fitness of the 5-D test problems. Solid line: original fitness landscape. Dash line: effective fitness landscape.
0 400 800 1200 1600
0.1 0.2 0.3 0.4 0.5
0 400 800 1200 1600
0.6 0.8 1 1.2 1.4
0 400 800 1200 1600
1 1.5 2 2.5 3
0 400 800 1200 1600
0.18 0.2 0.22 0.24 0.26 0.28
0 400 800 1200 1600
0.4 0.6 0.8 1 1.2 1.4 1.6
0 400 800 1200 1600
[image:11.612.79.533.296.511.2]0.42 0.46 0.5 0.54 0.58
Fig. 6. Convergence comparison with respect to evaluations for various approximation region parameters.
TABLE III
EFFECTIVE FITNESS OF THE SOLUTION AT1,600EVALUATIONS
Test Problem Mean±Std. err.
PMS-100% PMS-120% PMS-infinity
TP 1 0.104±0.006 0.098±0.002 0.099±0.001
TP 2 0.561±0.007 0.533±0.006 0.548±0.005
TP 3 0.676±0.031 0.569±0.022 0.659±0.027
TP 4 0.182±0.002 0.177±0.002 0.177±0.001 TP 5 0.358±0.011 0.301±0.009 0.337±0.004
TP 6 0.431±0.009 0.413±0.006 0.436±0.007
Best results and those statistically not different from best are highlighted in bold.
C. Performance of the PMS Strategy with Various Sampling Budget Limits
In this experiment, we investigate the convergence pattern with varying lower and upper sampling budget limitations. We consider the setting where the sampling budget per generation
is allowed to change between4and8as default, which is
ab-breviated as the PMS-[4,8]strategy. We firstly test the effect of
rising the lower limit of PMS-[4,8]. As such, we consistently
use 8 evaluations throughout the search process and denote
this strategy as PMS-[8,8]. Secondly, we study the impact
of increasing the upper limit on the convergence behaviour.
Therefore, we include PMS-[4,10]in this experiment, whose
upper limit is set to10. The approximation region is fixed at
[image:11.612.61.288.573.660.2]120% of each direction of an individual’s perturbed region.
Fig. 7 displays the results of the various sampling strategies for all test problems.
As shown in Fig. 7, PMS-[4,8] and PMS-[8,8]have
sim-ilar convergence patterns at early search iterations because both strategies implement eight evaluations when the archive has few usable samples. Nevertheless, the convergence of
0 400 800 1200 1600 0.1
0.2 0.3 0.4 0.5
0 400 800 1200 1600
0.5 0.7 0.9 1.1 1.3
0 400 800 1200 1600
1 1.5 2 2.5 3
0 400 800 1200 1600
0.18 0.2 0.22 0.24 0.26 0.28
0 400 800 1200 1600
0.5 0.7 0.9 1.1 1.3 1.5
0 400 800 1200 1600
[image:12.612.60.289.568.654.2]0.42 0.46 0.5 0.54 0.58
Fig. 7. Convergence comparison with the evaluations for various sampling budget limits.
archive has a sufficient number of samples, indicating that
PMS-[4,8] saves evaluations when the average Wasserstein
distance is monotonously decreasing anyway. Moreover, we
observe that the convergence of PMS-[4,10] is slow at early
iterations. This is because PMS-[4,10] is allowed to spend
more evaluations exploring the correct search directions at early iterations.
TABLE IV
AVERAGE EFFECTIVE FITNESS OVER1,600EVALUATIONS
Test Problem Mean±Std. err.
PMS-[4,8] PMS-[4,10] PMS-[8,8]
TP 1 0.140±0.003 0.152±0.002 0.151±0.003
TP 2 0.634±0.014 0.628±0.012 0.629±0.005
TP 3 0.848±0.025 0.897±0.021 0.876±0.027
TP 4 0.190±0.001 0.194±0.001 0.193±0.001
TP 5 0.495±0.018 0.540±0.029 0.514±0.028
TP 6 0.452±0.006 0.457±0.008 0.453±0.008
Best results and those statistically not different from best are highlighted in bold.
TABLE V
EFFECTIVE FITNESS OF THE SOLUTION AT1,600EVALUATIONS
Test Problem PMS-[4,8] MeanPMS-±[4Std. err.,10] PMS-[8,8]
TP 1 0.098±0.002 0.094±0.001 0.093±0.003 TP 2 0.533±0.006 0.498±0.009 0.535±0.002
TP 3 0.569±0.022 0.542±0.028 0.565±0.031
TP 4 0.177±0.002 0.175±0.001 0.176±0.001
TP 5 0.301±0.009 0.269±0.018 0.294±0.016
TP 6 0.413±0.006 0.410±0.008 0.413±0.008
Best results and those statistically not different from best are highlighted in bold.
Again, Table IV and V summarise the overall performance and the effective fitness value of the final solution, respectively.
We observe that strategies PMS-[4,8]and PMS-[8,8]perform
similarly at the end of EA search process, but PMS-[4,8]
converges faster than PMS-[8,8], indicating that our sampling
budget adjustment can save evaluations without sacrificing the
performance of the final solution. PMS-[4,10] provides the
best final solution in all test problems, but converges more slowly.
D. Average Performance Comparison
We verify the performance of the proposed strategies, namely EFS and PMS, by comparing with the following archive-based approaches from the literature:
1) SEM: The strategy randomly samples one location
within the individual’s perturbed area [8].
2) SEMAR: This is the SEM strategy integrated with the archive sample approximation strategy [18].
3) ABRSS: This strategy is based on an archive sample approximation approach consisting of two main steps. For each disturbed location, the first step is to identify the closest sample point in the archive, and the second step is to check whether this disturbed location is also the closest disturbed location of its selected archive sample point [16]. If this is the case, the selected archive sample point will be used in the effective fitness estimation; otherwise, this disturbed location will be considered for an additional sampling.
4) ABRSS+OP: This strategy implements ABRSS to de-termine the additional sample points, but assigns the optimal probabilities that are obtained from the modified Wasserstein distance for all sample points involved in the effective fitness estimation.
Note that all sampling strategies are inserted into the same CMA-ES, so that all performance differences can be attributed to the sampling strategy alone.
The PMS strategy sets the approximation region parameter
κas120%and fixes the lower and upper limits for the number
of samples per iteration at4and8, respectively. Fig. 8 displays
by the mean squared error between the true and estimated effective fitness.
As shown in Fig. 8, the SEM approach provides the worst results for all test problems, because this approach does not use an archive and one new sample is not sufficient to estimate the effective fitness. Compared to SEM, the archive-based approaches show a good convergence on most test problems. SEMAR and ABRSS exhibit similar convergence behaviour on most test problems. Since the ABRSS+OP approach im-plements the optimal probabilities, its convergence is faster than ABRSS and SEMAR in the most of test problems. Nevertheless, ABRSS+OP performs worse than the WASA-based strategies, i.e., EFS and PMS, indicating that the Wasser-stein distance metric provides an advantage in selecting good sampling locations. Additionally, the results demonstrate the good performance of PMS which converges faster than EFS
over the first 1,000 evaluations in all problems.
The effective fitness of the best observed solution obtained
from various strategies averaged over 1,600 evaluations is
reported in Table VI. The results confirm the importance of good sampling strategy design. We find that the WASA sampling strategies converge faster than other methods. For strategies PMS and EFS, we observe that the convergence of PMS is more rapid than EFS for all test problems except TP 2 and 6. Table VII displays the performance of the final solution obtained from various approaches. The result once again confirms the superiority of WASA sampling strategies and the performance advantage of PMS over EFS.
The results of average estimation error in Fig. 9 confirm our findings from previous convergence comparisons. The SEM approach consistently exhibits large effective fitness estimation errors. The SEMAR and ABRSS strategies reduce the average estimation error when the number of evaluations is small, because they reuse past sampling information. However, SEMAR and ABRSS lack a good mechanism to determine the probability weights for the samples used in the effective fitness estimation. This deficiency might lead to biases in the estimation. In some cases, the average estimation errors of SEMAR and ABRSS are actually increasing over the run. By contrast, the approaches that adopt optimal probabilities, i.e. ABRSS+OP, EFS and PMS, keep decreasing the average estimation error throughout the run; and PMS is the fastest approach in decreasing the average estimation error.
E. Robust Multi-point Airfoil Shape Optimisation under Un-certain Manufacturing Errors
Finally, we test the proposed strategies on a simple real-world problem. We consider a multi-point airfoil shape optimi-sation problem with manufacturing errors. Although advances in high-performance computing have reduced the CPU time with respect to the performance evaluation of airfoil shape, this robust optimisation problem still requires a significant computational effort because algorithms might need thousands of evaluations under various possible manufacturing errors. Therefore, it is an ideal testbed for examining the performance of various sampling approaches under the condition of limited evaluation budget.
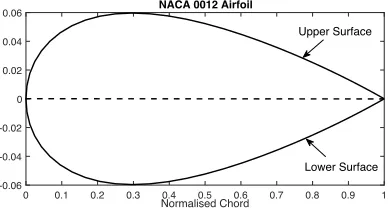
We consider the subsonic2-D airfoil design problem, which
is a variant obtained from [3]. The baseline shape is NACA 0012 airfoil [25], which is illustrated in Fig. 10. We implement
10 Hicks-Henne bump functions [26]fi(z)for i= 1, . . . ,10
with the upper and lower surfaces of NACA 0012 (denoted as yb
u(z)andybl(z)) to parameterise the upper surfaceyu(z)and
the lower surface yl(z). They are defined as follows:
yu(z) =ybu(z) +
6
X
i=1
θifi(z)
and
yl(z) =ybl(z) +
10
X
i=7
θifi(z),
where z is a non-dimensional abscissa, and θi is the design
variable on thei-th Henne bump function. These
Hicks-Henne bump functions combined with design variables can be used to tune the upper and lower surfaces. The definitions of Hicks-Henne bump functions and the ranges of the design variables can be found in Appendix D of the online supple-ment.
The “fitness” of the airfoil shape is defined as the average
lift-to-drag ratio over three flow velocities (M1 = 0.5 mach,
M2 = 0.55 mach and M3 = 0.6 mach) when Reynolds
number (Re) and Angle of Attack (AoA) are 300,000 and
4◦, respectively. Thus, the fitness functionf(θ)can be written
as follows:
f(θ) =1
3(C1+C2+C3)
where
C1=CL/D(M1, Re, AoA, θ1,· · ·, θ10)
C2=CL/D(M2, Re, AoA, θ1,· · ·, θ10)
C3=CL/D(M3, Re, AoA, θ1,· · ·, θ10)
whereCL/D denotes the lift-to-drag ratio. We assume that all
design variables are affected by uniformly disturbed manufac-turing errors. The range of manufacmanufac-turing error for all design
variables is fixed as[−0.001,0.001]. The overall robust design
problem can be formulated as
max fef f(θ) =E[f(θ+ξ)] =1
3(C1+C2+C3)
where
C1=CL/D(M1, Re, AoA, θ1+ξ1,· · · , θ10+ξ10)
C2=CL/D(M2, Re, AoA, θ1+ξ1,· · · , θ10+ξ10)
C3=CL/D(M3, Re, AoA, θ1+ξ1,· · · , θ10+ξ10)
ξi∈ U(−0.001,0.001), i= 1, . . . ,10.
In this experiment, the airfoil shape of lift-to-drag ratios at various Mach numbers are evaluated by Drela’s XFOIL [27]. This software is an open-source aerodynamic analysis package for subsonic isolated airfoils, which allows the use of relatively lower computational effort than advanced CFD programs. For
this problem, we fix the (µ, λ) parameters in CMA-ES at
(5,10) and choose the total evaluations as 1,200. The lower
0 400 800 1200 1600 0.1
0.3 0.5 0.7 0.9
0 400 800 1200 1600
0.6 0.8 1 1.2 1.4 1.6 1.8 2
0 400 800 1200 1600
1 1.5 2 2.5 3
0 400 800 1200 1600
0.18 0.2 0.22 0.24 0.26 0.28 0.3 0.32
0 400 800 1200 1600
0.3 0.8 1.3 1.8 2.3 2.8
0 400 800 1200 1600
[image:14.612.91.530.53.522.2]0.42 0.46 0.5 0.54 0.58 0.62
Fig. 8. Convergence comparison of different sampling strategies with respect to evaluations.
0 400 800 1200 1600
0 0.02 0.04 0.06 0.08 0.1 0.12
0 400 800 1200 1600
0 0.1 0.2 0.3 0.4 0.5 0.6
0 400 800 1200 1600
0 0.1 0.2 0.3 0.4 0.5 0.6 0.7 0.8 0.9 1
0 400 800 1200 1600
0 0.01 0.02 0.03 0.04 0.05 0.06 0.07
0 400 800 1200 1600
0 0.2 0.4 0.6 0.8 1 1.2 1.4
0 400 800 1200 1600
0 0.02 0.04 0.06 0.08 0.1 0.12 0.14 0.16
Fig. 9. Average estimation error comparison of different sampling strategies with respect to evaluations.
0 0.1 0.2 0.3 0.4 0.5 0.6 0.7 0.8 0.9 1
Normalised Chord
-0.06 -0.04 -0.02 0 0.02 0.04
0.06 NACA 0012 Airfoil
[image:14.612.80.525.55.279.2]Lower Surface Upper Surface
Fig. 10. The baseline shape of the robust design problem.
whereas the evaluation budget of other sampling approaches is
fixed at 10, that is, each solution is evaluated once. The other
[image:14.612.77.530.291.523.2]experimental setup is exactly same as in previous experiments.
Fig. 11 shows the convergence of the average effective fitness of the currently best solution based on the estimated effective fitness values.
As can be seen in Fig. 11, the convergence of WASA sampling strategies is considerably faster than other sam-pling approaches, which clearly confirms the superiority of WASA sampling strategies in this real-world problem. The non-WASA sampling strategies (SEM, SEMAR, ABRSS and ABRSS+OP) exhibit similar convergence patterns. For EFS and PMS, the solutions at 400 evaluations are even better than the solutions obtained from the other sampling approaches
after 1,200 evaluations. In comparison to EFS, we observe
that PMS provides a good convergence rate at the first 200
[image:14.612.78.273.565.670.2]TABLE VI
AVERAGE EFFECTIVE FITNESS OVER1,600EVALUATIONS
Test Problem Mean±Std. Err.
SEM SEMAR ABRSS ABRSS+OP EFS PMS
TP 1 0.260±0.006 0.171±0.007 0.156±0.004 0.160±0.006 0.144±0.003 0.140±0.003 TP 2 1.018±0.008 0.728±0.017 0.702±0.017 0.676±0.010 0.625±0.015 0.634±0.014 TP 3 1.304±0.024 1.121±0.035 1.164±0.031 1.012±0.040 0.902±0.035 0.848±0.025 TP 4 0.213±0.001 0.199±0.001 0.200±0.001 0.198±0.001 0.196±0.001 0.190±0.001 TP 5 1.280±0.010 0.853±0.021 0.783±0.022 0.753±0.031 0.497±0.018 0.495±0.018 TP 6 0.519±0.007 0.485±0.008 0.471±0.008 0.474±0.011 0.462±0.007 0.452±0.006
Best results and those statistically not different from best are highlighted in bold.
TABLE VII
EFFECTIVE FITNESS OF THE SOLUTION AT1,600EVALUATIONS
Test Problem Mean±Std. Err.
SEM SEMAR ABRSS ABRSS+OP EFS PMS
TP 1 0.267±0.020 0.100±0.006 0.098±0.003 0.096±0.006 0.095±0.003 0.098±0.002 TP 2 1.000±0.052 0.548±0.011 0.554±0.024 0.535±0.007 0.528±0.002 0.533±0.006 TP 3 1.131±0.075 0.873±0.054 0.823±0.071 0.769±0.042 0.682±0.031 0.569±0.022 TP 4 0.205±0.004 0.187±0.009 0.184±0.003 0.185±0.002 0.181±0.003 0.177±0.002 TP 5 1.005±0.076 0.662±0.044 0.479±0.057 0.434±0.053 0.335±0.012 0.301±0.009 TP 6 0.471±0.013 0.455±0.011 0.429±0.009 0.430±0.011 0.428±0.005 0.413±0.006
Best results and those statistically not different from best are highlighted in bold.
0 200 400 600 800 1000 1200
[image:15.612.114.502.86.169.2]40 45 50 55 60 65 70 75
Fig. 11. Convergence comparison of various sampling strategies with respect to evaluations in the robust airfoil shape optimisation problem.
artificial test functions presented in Section IV.D.
Table VIII reports both the average effective fitness over 1,200 evaluations (abbreviated as A.E.F.) and the effective fitness of the solution at 1,200 evaluations (abbreviated as E.F.). The results show that PMS provides the fastest con-vergence among the six approaches. The concon-vergence of EFS is worse than that of PMS but still much better than those of
TABLE VIII
PERFORMANCE OF VARIOUS SAMPLING APPROACHES IN THE ROBUST AIRFOIL SHAPE OPTIMISATION PROBLEM
Method Mean±Std. Err. A.E.F. E.F. SEM 67.665±0.434 71.410±0.434 SEMAR 66.140±1.011 71.657±0.305 ABRSS 66.359±0.721 71.638±0.311 ABRSS+OP 67.742±0.987 72.035±0.277 EFS 68.453±0.239 72.614±0.089
PMS 69.257±0.233 72.780±0.068
Best results and those statistically not different from best are highlighted in bold.
the non-WASA approaches. The optimal probabilities used in the effective fitness estimation have improved performance of ABRSS+OP in this test problem. Compared to ABRSS and SEMAR, ABRSS+OP has a faster convergence and provides better final solutions, though it is still worse than the WASA sampling strategies.
V. CONCLUSION
When using evolutionary algorithms to search for a ro-bust solution, estimating the effective fitness is challenging. Storing previous evaluations in an archive and using this information to improve the fitness estimate, the so-called archive sample approximation method, has been proposed by several authors to improve the estimation accuracy without increasing the sampling budget. A crucial part of ASA is the sampling strategy, i.e., to decide what new solutions should be evaluated. In this paper, we used the Wasserstein distance metric to approximate an upper bound for the error and proposed two Wasserstein-based sampling strategies to suggest promising sampling locations. Minimizing the upper bound cannot guarantee minimization of the actual error, however, knowing that we have no information on the fitness function apart from previous samples, it is a promising approach. One sampling strategy considers the sampling contribution from each individual’s perspective, and allocates an equal number of evaluations to each individual. The second strategy approximates the sampling contribution for all individuals. The empirical results on various benchmark problems and robust airfoil shape optimisation demonstrate the benefit of using Wasserstein-based sampling strategies and the advantage of considering the population contribution in the sampling strategy design.
[image:15.612.72.287.320.470.2]the run, so parameter κ controlling the extension could be reduced over the run. The idea should be tested also with other distributions for the disturbances. It also would be inter-esting to compare WASA with surrogate-based approaches. The Wasserstein distance metric might even be helpful in constructing better surrogate models. Finally, the development of WASA to address more complex real-world applications would be valuable.
ACKNOWLEDGMENT
This research utilised Queen Mary’s MidPlus computational facilities, supported by QMUL Research-IT and funded by EPSRC grant EP/K000128/1.
REFERENCES
[1] H.-G. Beyer and B. Sendhoff, “Robust optimization – a comprehensive survey,”Computer Methods in Applied Mechanics and Engineering, vol. 196, no. 33, pp. 3190 – 3218, 2007.
[2] Y. Jin and J. Branke, “Evolutionary optimization in uncertain environments-a survey,”IEEE Transactions on Evolutionary Computa-tion, vol. 9, no. 3, pp. 303–317, 2005.
[3] Y.-S. Ong, P. B. Nair, and K. Y. Lum, “Max-min surrogate-assisted evolutionary algorithm for robust design,”IEEE Transactions on Evo-lutionary Computation, vol. 10, no. 4, pp. 392–404, 2006.
[4] H. Fu, B. Sendhoff, K. Tang, and X. Yao, “Robust optimization over time: Problem difficulties and benchmark problems,”IEEE Transactions on Evolutionary Computation, vol. 19, no. 5, pp. 731–745, 2015. [5] S. Salomon, G. Avigad, R. C. Purshouse, and P. J. Fleming, “Gearbox
design for uncertain load requirements using active robust optimization,”
Engineering Optimization, vol. 48, no. 4, pp. 652–671, 2016. [6] M. Rattray and J. Shapiro, “Noisy fitness evaluation in genetic
al-gorithms and the dynamics of learning,” in Foundations of Genetic Algorithms. Morgan Kaufmann, 1997, pp. 117–139.
[7] H.-G. Beyer and B. Sendhoff, “Evolution strategies for robust op-timization,” in 2006 IEEE International Conference on Evolutionary Computation, 2006, pp. 1346–1353.
[8] S. Tsutsui and A. Ghosh, “Genetic algorithms with a robust solution searching scheme,”IEEE Transactions on Evolutionary Computation, vol. 1, no. 3, pp. 201–208, 1997.
[9] H.-G. Beyer and B. Sendhoff, “Towards a steady-state analysis of an evolution strategy on a robust optimization problem with noise-induced multi-modality,”IEEE Transactions on Evolutionary Compu-tation, vol. 21, no. 4, pp. 629–643, 2017.
[10] J. Branke, C. Schmidt, and H. Schmeck, “Efficient fitness estimation in noisy environments,” inProceedings of the 3rd Annual Conference on Genetic and Evolutionary Computation. Morgan Kaufmann, 2001, pp. 243–250.
[11] A. Di Pietro, L. While, and L. Barone, “Applying evolutionary algo-rithms to problems with noisy, time-consuming fitness functions,” in
Proceedings of the 2004 Congress on Evolutionary Computation, vol. 2, 2004, pp. 1254–1261.
[12] B. Huang and X. Du, “A robust design method using variable transforma-tion and gauss-hermite integratransforma-tion,”International Journal for Numerical Methods in Engineering, vol. 66, no. 12, pp. 1841–1858, 2006. [13] S. H. Lee, W. Chen, and B. M. Kwak, “Robust design with arbitrary
distributions using gauss-type quadrature formula,”Structural and Mul-tidisciplinary Optimization, vol. 39, no. 3, pp. 227–243, 2009. [14] P. Stagge, “Averaging efficiently in the presence of noise,” in
Interna-tional Conference on Parallel Problem Solving from Nature. Springer, 1998, pp. 188–197.
[15] J. Branke and C. Schmidt, “Selection in the presence of noise,” in
Proceedings of the 2003 International Conference on Genetic and Evolutionary Computation. Springer, 2003, pp. 766–777.
[16] J. Kruisselbrink, M. Emmerich, and T. B¨ack, “An archive maintenance scheme for finding robust solutions,” in International Conference on Parallel Problem Solving from Nature. Springer, 2010, pp. 214–223. [17] J. Branke and X. Fei, “Efficient sampling when searching for robust
solutions,” inInternational Conference on Parallel Problem Solving from Nature. Springer, 2016, pp. 237–246.
[18] J. Branke,Evolutionary optimization in dyamic environments. Kluwer, 2001.
[19] A. Saha, T. Ray, and Smith, “Towards practical evolutionary robust multi-objective optimization,” in2011 IEEE Congress of Evolutionary Computation, 2011, pp. 2123–2130.
[20] A. Cervantes, D. Quintana, and G. Recio, “Efficient dynamic resampling for dominance-based multiobjective evolutionary optimization,” Engi-neering Optimization, vol. 49, no. 2, pp. 311–327, 2017.
[21] C. Villani,Optimal transport: old and new. Springer, 2008, vol. 338. [22] P. Billingsley,Probability and measure. John Wiley & Sons, 2008. [23] I. Paenke, J. Branke, and Y. Jin, “Efficient search for robust solutions
by means of evolutionary algorithms and fitness approximation,”IEEE Transactions on Evolutionary Computation, vol. 10, no. 4, pp. 405–420, 2006.
[24] N. Hansen, “CMA-ES source code.” [Online]. Available: https://www.lri.fr/ hansen/cmaesintro.html
[25] I. H. Abbott and A. E. Von Doenhoff,Theory of wing sections, including a summary of airfoil data. Courier Corporation, 1959.
[26] R. M. Hicks and P. A. Henne, “Wing design by numerical optimization,”
Journal of Aircraft, vol. 15, no. 7, pp. 407–412, 1978.
[27] M. Drela, “Xfoil: An analysis and design system for low reynolds number airfoils,” in Low Reynolds Number Aerodynamics. Springer, 1989, pp. 1–12.
Xin Fei is a Ph.D. candidate of the Operational Research and Management Science Group at War-wick Business School, University of WarWar-wick. His research interests mainly lie in efficient information collection and stochastic optimisation.
J ¨urgen Branke (M’02) received his Ph.D. degree from University of Karlsruhe, Karlsruhe, Germany, in 2000. He is a Professor of Operational Research and Systems with the Warwick Business School, University of Warwick, Coventry, U.K. He has been an active researcher in the area of evolutionary optimization since 1994 and has published more than 170 papers in international peer-reviewed jour-nals and conferences. His research interests include multiobjective optimization, handling of uncertainty in optimization, dynamically changing optimization problems, simulation-based optimisation and the design of complex systems. He is area editor of the Journal of Heuristics and the Journal on Multi-Criteria Decision Analysis, as well as associate editor of IEEE Transactions in Evolutionary Computation and the Evolutionary Computation Journal.