Radio Resource Sharing Framework for Cooperative
Multi-operator Networks with Dynamic Overflow
Modelling
Raouf Abozariba, Md Asaduzzaman and Mohammad Patwary
Abstract—Due to the exponentially growing wireless appli-cations and services, traffic demand is increasing rapidly. To cope with such growth wireless network operators seek for radio resource cooperation strategies for their users with the highest possible grade of service (GoS). In this paper we propose a set of analytical models for dynamic spectrum access (DSA) to attain intra-network resource sharing agreements and adopt such strategies by sharing radio resources. The proposed models focus on reducing blocking probability for a secondary network to attain wireless services as a trade-off with a marginal increase of blocking probability of a primary network in return of monetary rewards. We derived the global balance equation and an explicit expression of the blocking probability for each resource sharing model. The robustness of the proposed analytical models is evaluated under different scenarios by considering varying traffic intensities, different network sizes and adding reserved resources. The results show that the blocking probabilities can be reduced significantly with the proposed DSA framework in comparison to the existing local spectrum access schemes.
Index Terms—Dynamic spectrum access, overflow modelling, resource sharing, blocking probability.
I. INTRODUCTION
As a result of increasing demand for wireless services and applications in recent years there has been a significant inter-est in qualitative and quantitative measurements of licensed and unlicensed spectrum use. Researchers, telecommunication companies and regulatory bodies have conducted studies to capture the overall spectrum utilisation within time and space. These studies have given a notable amount of insight on spectrum use as found in the literature [1, 2]. Most of these studies have shown that a large amount of allocated spectrum are under-utilised resulting in a waste of valuable spectrum bandwidths, so-calledspectrum holes[3–6]. On the other hand, deterioration of grade of service is inevitable for some network operators due to the shortage of bandwidths.
Most of the current radio spectrum resource distribution are based on the static spectrum allocation principles which
Raouf Abozariba, Sensing, Processing and Communication Research Group, Faculty of Computing, Engineering and Sciences, Staffordshire Uni-versity, College Road, Stoke-on-Trent ST4 2DE, United Kingdom. Tel: +441782294861, Email: [email protected].
Md Asaduzzaman, Math Stat Group, Faculty of Computing, Engi-neering and Sciences, Staffordshire University, College Road, Stoke-on-Trent ST4 2DE, United Kingdom. Tel: +441782294707, Email: [email protected].
Mohammad Patwary, Sensing, Processing and Communication Research Group, Faculty of Computing, Engineering and Sciences, Staffordshire Uni-versity, College Road, Stoke-on-Trent ST4 2DE, United Kingdom. Tel: +441785293546, Email: [email protected].
has been identified as a major concern of spectrum scarcity within the future generations of cellular networks [7]. Effi-cient spectrum sharing is considered as one of the promising approaches to enhance networks’ Grade of Service (GoS). In order to cope with increasing demand of wireless services and applications and to improve the spectrum utilisation, dynamic spectrum access (DSA) and other technologies, such as spectrum aggregations, are proposed in the literature to solve these current spectrum inefficiency problems [3, 8–12].
Resource allocation in DSA systems is broadly categorised by the roles of primary networks, known as the passive and active primary network models. The passive model assumes that a primary network is unaware of the operations of secondary networks (secondary networks perform spectrum sensing to determine idle spectrum for opportunistic use) and it does not require any modification for the primary network systems. However, the passive model is considered to have high complexities due to added tasks such as spectrum sensing and control overhead. In contrast, spectrum sensing in the active model is not required by secondary networks because it is assumed that a cooperation between network operators exist. Under such cooperation, information about the allocation, oc-cupancy and characteristics of channels and other parameters are exchanged. As a result, primary networks are benefited economically by leasing their unused spectrum resources to secondary networks at the expense of marginal performance degradation while the secondary network increases GoS to a desired level. However, the marginal performance degradation of a primary network depends on its current GoS. The current GoS of primary networks and the required GoS of secondary networks along with overall GoS requirement defines the basis of DSA agreements between concerned networks.
To legalise spectrum sharing, a number of spectrum reg-ulators such as the Federal Communications Commission (FCC) approved the use of unlicensed devices in a number of licensed bands under restricted conditions [5]. Consequently, innovative techniques are needed that can offer exploiting the available spectrum. However, the legalising process remains to be limited in certain geographical areas and certain frequency bands.
operators, and investigating the potential benefits of such interactions. Our findings can be summarised as follows:
• Pre-agreed spectrum sharing with overflow modelling can
be beneficial to the network operators even if it comes with certain regulatory and operational limits.
• A network with dynamic and real time overflow capabili-ties can improve the system performance even for limited overflow traffic such as in the uni-directional overflow model.
• Overflow mechanism in DSA is effective for reducing the
overall blocking probability of the network and maximal reduction of blocking probability can be attained with reserved resources.
• Dynamic overflow modelling provides an intra-network
agreement platform to gain access to the under-utilised frequency bands by using additional spectrum from co-existing operators.
The remainder of the paper is organised as follows. Related work is presented in Section II. The detailed description of the system model is given in Section III. The proposed dynamic resource sharing algorithm is presented in Section IV, while the scenario specific DSA mechanism with overflow models are studied in Subsections IV-A, IV-B, IV-C and IV-D. Analytical results are provided in Section V, followed by concluding remarks in Section VI.
II. RELATEDWORK
Resource sharing mechanisms in multi-operators networks have been studied extensively in the context of DSA and Cog-nitive Radio Networks (CRNs) [13–18]. In [13], the benefits of Authorised Spectrum Access are shown by considering different methods to optimise the network’s resources, and simulating an LTE network where a Mobile Network Operator is allowed to use the 2300 MHz band as an ASA licensee. The authors of [14] studied a spectrum sharing problem in an unlicensed band, where multiple networks coexist and interfere with each other. A cognitive radio system based on scheduling technology has been modelled in [19]. The more recent study [15] proposed a control-free DSA algorithm for CRNs.
Although intensive research has been done on resource sharing mechanisms, only a few studies addressed the blocking probability reduction when considering dynamic pre-agreed overflow traffic in coexisting networks [19–22]. A continuous-time Markov chain model to analyse the performance of three co-located cognitive systems with various priority classes and bandwidth requirements was presented in [21]. In [22], call arrivals (demand) from primary users and secondary users in the opportunistic spectrum sharing system are modelled by a Markovian arrival process which captures correlation in the aggregate arrival process consisting of the two types of call arrivals. A Markov chain analysis for spectrum ac-cess in licensed bands for cognitive radios is presented and forced termination probability, blocking probability and traffic throughput are derived in [23].
In [24], the authors focused on performance modelling for heterogeneous wireless networks based on a hierarchical overlay infrastructure. In particular, the new traffic blocked
in a network due to capacity limit can be overflowed to the networks with available capacity at the higher tiers. Such traffic overflow is considered a uni-directional overflow. While in [25], the authors considered a speed-sensitive call admission control scheme to assign overflowed calls to appropriate tiers. If the new calls of fast-speed users in a low tier network are blocked due to capacity limits, the blocked new calls are overflowed to a high-tier network for possible service. If the blocked new calls are from slow-speed users in a high tier network, they are overflowed to a low-tier network. Blocked calls from fast-speed users are overflowed to the higher tier networks with larger coverage and blocked calls from slow-speed users are overflowed to the lower tier networks with smaller coverage. Such multi-tier traffic mechanism is called bi-directional overflow which can support hierarchical hetero-geneous overlay systems. In [26], a load sharing scheme was considered, an incoming voice call is preferably distributed to the cell, and overflows to the WLAN only if there is not sufficient free bandwidth for a voice call in the cell. Dynamic transfer of ongoing voice calls in the WLAN to the cell via vertical handoff whenever the cell has free bandwidth to accommodate more voice calls. Meta information of data calls that can be passed to the network layer is exploited. This scheme is also considered a bi-directional overflow model.
Five overflow policies were discussed in [27], the approach taken is to allow the new calls and handovers to compete on a first-come first-served basis. The authors developed an analytical method that treats overflow in a unified manner to allow the approximate performance of overflow strategies.
The models discussed in the aforementioned literature are specific to hierarchal admission, type of service and mobility of users. We, on the other hand, present a detailed comparisons between various possible models for DSA, in particular, we show that for an operator, the blocking probability is a non-linear function of degree of interaction within multi-service multi-operator scenarios, which can be more reliable frame-work to be used to attain intra-operator agreement for DSA.
Moreover, our analytical models have been derived specif-ically to allow for more general analysis which is crucial for the new emerging DSA applications (e.g., cognitive radio technology) and future generation of wireless telecommuni-cations. Our investigation was conducted in order to gain a better understanding of the behaviour of the DSA networks with regard to GoS.
III. SYSTEMMODEL ANDASSUMPTIONS
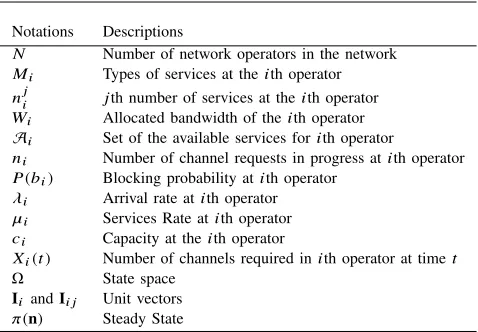
TABLE I: Symbols Used for the Analytical Modelling
Notations Descriptions
N Number of network operators in the network Mi Types of services at theith operator nij jth number of services at theith operator Wi Allocated bandwidth of theith operator
Ai Set of the available services forith operator
ni Number of channel requests in progress atith operator P(bi) Blocking probability atith operator
λi Arrival rate atith operator µi Services Rate atith operator ci Capacity at theith operator
Xi(t) Number of channels required inith operator at timet Ω State space
Ii andIi j Unit vectors π(n) Steady State
borrow spectrum bandwidths, respectively. Network operators are expected to interact with each other by acquiring or leasing spectrum bandwidths owned by coexisting network operators in the same region. Secondary systems are not expected to use the infrastructure of primary system, but only acquire the right to use the incumbent spectrum of primary networks on temporal and spatial basis.
In this system model, the operators are expected to interact with each other by adjusting their actions to enhance mutual benefits. This is carried out by employing the best possible strategy for secondary and primary system with a given set of constraints to control their blocking probabilities. As shown
OP1 OP2 OPN
W1 W2 WN
[image:3.612.63.292.427.563.2]λ1 λ2 λN
Fig. 1: System Model: Coexisting Network Operators in a DSA
in Figure 1, a given geographical area is covered with radio signals by a set of network operators. The operators are working in an overlapped manner to provide their respective users with a preset number of services.
We assume that each network operator supports a number of services. We denote the services as
n=
* . . . . . .
,
n1
1 n21 . . . n M1
1 n12 n22 . . . nM2
2
..
. ... . .. ...
n1
N n2N . . . n MN
N
+ / / / / / /
-wherenijcorresponds to the type of services of theith operator, i=1,2, . . . ,N, j = 1,2, . . . ,Mi.
Each service supported by the network is realised by a particular data rate, which are only supportive of particular operating bands such as 791-821 MHz, 880-915 MHz, and 1920-1980 MHz. Each nij has a capacity cij, i =1,2, . . . ,N, j = 1,2, . . . ,Mi. Hence, the capacity matrix can be written as follows:
C=
* . . . . . .
,
c11 c12 . . . cM1
1 c12 c22 . . . cM2
2
..
. ... . .. ...
c1N c2N . . . cMN
N
+ / / / / / /
-.
We assume that the network operators consider a loss model, where there are no waiting places in the system, and it blocks the arriving channel requests when all servers are busy [28]. Unlike the queueing type models, loss models are stable and the closed form analytical solution of blocking probability exists irrespective of traffic intensity. However, no closed form solution exists for infinite buffer queueing models if traffic intensity is greater than one, that is, if arrival rate is greater than departure rate.
Although multiple network operators are serving in the same geographical area, due to the variation of the service provi-sion options among networks, there may exist a variation of services which feature specific peak time slots. Subsequently, the overall spectrum utilisation may vary from one operator to another at certain intervals. This may lead the network operators into a situation when one operator experience high demand while the resources of other coexisting operators in the region are under-utilised. This means overloaded operators may utilise the underloaded spectrum resources of adjacent operators. In this paper we present an analytical framework to enhance the overall GoS among the network operators. Such GoS enhancement is achieved by cooperative resource sharing between network operators in the form of dynamic traffic overflow modelling.
as a consequence, higher exchange of information will intro-duce more overhead. Moreover, the realisation of the models presented in this paper may require new technologies in the form of coordination, signalling protocols, network elements and client devices which will entail additional computational power. Measurements and analysis of such communication and computation overheads would be of great value, but are beyond the scope of this article.
A. Formulation of Agreements
One assumption in this paper is that the network operators involved in the cooperation are in some form of agreement to share their resources as predicted in the future generations of cellular networks [29, 30]. The nature of such resource sharing agreements depends on several factors such as service quality and resource availability. The agreements facilitate more control over trade-offs between GoS provision and pricing. Examples of such spectrum sharing agreements which may be motivated by monetary compensation are found in [31–34].
The level of cooperation and terms of agreements can have many forms depending on the policy of the operators. In this context, overflow traffic can be initiated from an Operatorito Operator j when the blocking probability at the Operatori is
P(bi) ≥i, (1)
wherei is a very small blocking probabilitythresholdof the Operator i. Under an agreement, Operator j receives some monetary compensation for leasing resources to the Operator i. The amount of reward that Operator j will receive from Operatori can be written in the mathematical form given by
ri j(t)=r0j+ f
d(bj)(t),ri j∗ (t),qi j(t)
, (2)
subject to
P(b∗j) < j, (3)
where r0j ≥ 0 is a fixed reward received by the Operator j due to the agreement, P(bj)(t) is the blocking probability of Operator j due to its own arrivals at timet, P(b∗j)(t) is the new blocking probability of Operator j as a result of its own arrivals as well as the overflow traffic from Operatori at time t, ri j∗(t) is the reward received from Operator i due to the admission of a unit arrival to Operator j at time t, qi j(t) is the amount of traffic overflowed from Operatori to j during time periodt,j is the blocking probabilitythresholdfor the Operator j and
d(bj)=P(b∗j)(t)−P(bj)(t). (4)
The second part of the reward function
fd(bj)(t),ri j∗(t),qi j(t)
may take any form (for instance, linear, exponential, etc.) agreed by both the Operator i and j during the contractual period. In the simplest case, the function may be a linear function which can be defined as
f(.)=rik∗ (t) ·qi j(t) ·
f
1+d(bj)(t)
g
. (5)
In the event where P(b∗j) = j, operator j could decide to block any further overflow traffic from operator i. Obviously
in this case, operator j will not suffer from any further performance degradation. The monetary compensation ri j(t) is proportional to the performance degradation incurred by overflow traffic form operatori to operator j. In this form of agreement, both operators may have incentives to participate in spectrum sharing: either to improve the performance, rep-resented in reducing the blocking probability, or increase in revenues at the expense of marginal performance degradation. In this agreement, Operator j charges higher rate ri j(t) as P(b∗j) → j. Note that a more realistic approach is when Operator i considers modifying the reward according to the benefit gained by overflow traffic, such that equation (2) can be written as
ri j(t)=r0j
+ fαi(t),P(b∗i)(t),d(bj)(t),ri j∗(t),qi j(t)
, (6)
subject to
P(b∗j)< j, (7)
and
ri j(t)< αi(t), (8)
where αi(t) is the revenue due to overflow traffic from the Operatorito Operator jat timetandP(b∗i)(t) is the blocking probability of the Operatori at time t. Such agreements are dynamic in nature and they change at each time slot t as a function of the demands and rewards paid to Operator j. The best sharing agreement can not be determined without analysing the blocking probabilities for each network individ-ually. In the next section, we present four possible scenarios with different overflow mechanisms in order to focus on the impact of spectrum sharing on the blocking probabilities.
IV. PROPOSEDDYNAMICRESOURCESHARING ALGORITHM
A predefined level of GoS is essential for network operators when designing or upgrading a cellular network. It constitutes one of the incentives for network operators to participate in spectrum sharing. As the number of users increase, the network operators are required to provide the users with a fixed radio resources. Cooperation among network operators in the form of dynamic resource sharing is a solution to maintain such a predefined GoS. There are two fundamental aims of such dynamic resource sharing:
• Enhanced netwsork wide GoS with efficient spectrum
utilisation.
• Additional revenue generation by negotiated dynamic
sub-contraction of under-utilised spectrum within each network operator.
operatori can overflow to the available spectrum of adjacent operator(s), subject to accessibility and availability.
Algorithm 1Generic service selection
1: Initialisation: Number of Operators in the network = N 2: fori=1 : 1 :N do
3: ifith operator is blocked and jth operator is available
then
4: Ai={Cik} ∪ {Ckj} ∀ j ∈ {1,2, . . . ,N}and j ,i
5: whereAiis the set of accessible services for operator i
6: Apply overflow Model 1 & 2. 7: % If reserved capacity is available.
8: else ifith operator & jth operator are blockedthen
9: Ai={Cik} ∪ {R}
10: Where Rdenotes to a reserved capacity
11: Apply overflow (Model 3) with reserved capacity 12: else
13: Apply Non-Sharing formula 14: end if
15: end for
16: return
To study the proposed algorithm, we have developed four different models based on a loss system with overflow and evaluated and compared each of these models through numer-ical analysis.
A. Non-Sharing Model
Consider a network consisting of two operators for a cellular communications network. We assume that the two operators are in an agreement to share the spectrum if they can both support the same services. However in this model there are no services in common in order for the operators to deploy resource sharing. Hence, we name this model a Non-Sharing Model. A state of this network is a vectorn=(n1,n2), where ni is the number of channel requests in progress inith operator. The topology of the network is depicted in Figure 2.
Blocking Blocking
λ1 λ2
µ1 µ2
[image:5.612.325.550.358.454.2]Operator 2 Operator 1
Fig. 2: Non-Sharing network with two operators
Let λ1 andλ2 be the arrival rates to the Operator 1 and 2 respectively, and the service rates be µ1 and µ2 and capacity c1 and c2, where both inter-arrival and service times are exponentially distributed random variables (r.v.). The blocking probability at theith operator (i=1,2) for such an Erlang loss network can be calculated by
P(bi)=
1
ci!
λi
µi !ci
ci
X
ni=0
1
ni!
λi
µi !ni
−1
. (9)
The blocking probabilityP(bi) is defined as the probability that an arrival of user at operator i is blocked because the capacity is saturated.
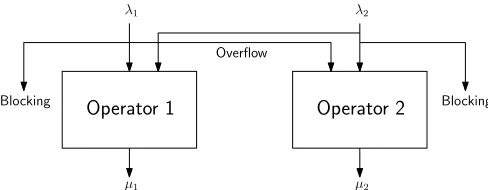
B. Sharing Model 1 (Uni-directional overflow)
We now consider a network with two operators with capac-ityc1 andc2 for Operator 1 and Operator 2, respectively. As assumed for the Non-Sharing Model, (discussed in subsection IV-A), here we assume that the two operators are in an agreement to share the spectrum if they can both support the same service. However, in this model, we consider a case where only Operator 1 can have access to the resources of Operator 2, while Operator 2 is not allowed to overflow to Operator 1 resources. Channel requests for Operator 1 and 2 follow Poisson processes with rate λ1 and λ2 for Operator 1 and 2, respectively, i.e. inter-arrival times are exponentially distributed random variables (r.v.). The service rate at Operator 1 (Operator 2) is exponentially distributed with mean µ−1 1 (respectively µ−1
2 ). If allc1 capacity are occupied at Operator 1, a channel request arriving at Operator 1 is overflowed to Operator 2 if capacity is available, and blocked otherwise. Our goal is to minimise the proportion of blocked channel requests for each operator. Figure 3 shows a detailed flow of channel requests for such network.
Blocking Blocking
Overflow
λ1 λ2
µ1 µ2
Operator 1 Operator 2
Fig. 3: A two-operator network with uni-directional overflow (Model 1)
Let X1(t) be the number of channels required in Operator 1 and X2(t) in Operator 2 at time t. Also X12(t) denotes the number of channels required in Operator 2 overflowed from Operator 1 at time t. The assumption of exponential distribution enables us to model the network as a continuous-time Markov chainX= X1(t),X12(t),X2(t),t≥0 with state space given by
Ω=n=(n
1,n12,n2) :n1 ≤c1,n2+n12≤c2 , (10) whereni,i =1,2, is the number of channels required at the ith operator and n12 is the number of channels required at Operator 2 overflowed from Operator 1. The transition rates
Q= q(n,n0),n,n0∈ Ω are given by
q(n,n0)=
λ1 n0=n+I1 or n0=n+I12, if n1 =c1
λ2 n0=n+I2
niµi n0=n−Ii, i=1,2
n12µ1 n0=n−I12
0 otherwise,
[image:5.612.70.279.518.617.2]new channel request finds all capacities are occupied in both operators 1 and 2.
Let π(n) = limt→∞P X(t) = n denote the equilibrium
distribution that there are n channel requests in progress in both operators. This equilibrium distribution ofXis the unique distribution π(n),n ∈ Ω that satisfies the global balance
equation as shown in (12), where 1{ · } denotes the indicator
function of the event or set of{·}. We now derive thedetailed
balance equationsfrom theglobal balance equation (12),
λi π(n−Ii)+π(n−I12)= niµi+n12µ1·π(n) (13) Equation (13) has an explicit solution which is given by
π(n)=K−1(λ1/µ1)
(n1+n12)(λ
2/µ2)n2 (n1+n12)!n2!
, ∀ n∈Ω (14)
and
K =X
n∈Ω
(λ1/µ1)(n1+n12)(λ2/µ2)n2 (n1+n12)!n2!
. (15)
This equilibrium distribution is a truncated multidimensional Poisson distribution from where blocking probability can be derived. The blocking probability for operator i, i =1,2, is then given by
P(bi)=
X
n∈Ti π(n)
= X
n∈Ti
(λ1/µ1)(n1+n12)(λ2/µ2)n2 (n1+n12)!n2! ·
X
n∈Ω
(λ1/µ1)(n1+n12)(λ2/µ2)n2 (n1+n12)!n2!
−1
, (16)
where
T1 =n∈Ω|(n1 =c1∩n12+n2=c2), (17)
and
T2=n∈Ω|(n12+n2=c2) . (18)
C. Sharing Model 2 (Bi-directional overflow)
We shall now extend Sharing Model 1 by adding an over-flow strategy from Operator 2 to Operator 1, see Figure 4. We assume that the two operators are in an agreement to share the spectrum and both operators can support the same services. In this model, we consider a case where Operator 1 can have access to the resources of Operator 2, and likewise, Operator 2 can have access to Operator’s 1 resources. Therefore, this model is called a bi-directional overflow model. If all c1 capacity are occupied at Operator 1 a channel request arriving at Operator 1 is overflowed to Operator 2 if capacity is available, and blocked otherwise. Similarly a channel request arriving at Operator 2 is overflowed to Operator 1 if capacity c2 is occupied and there is a free capacity at Operator 1.
Blocking Blocking
Overflow
λ1 λ2
µ1 µ2
[image:6.612.314.558.54.149.2]Operator 1 Operator 2
Fig. 4: A two-operator network with bi-directional overflow (Model 2)
The state space for such a process can be given by
Ω=n=(n
1,n12,n2,n21) :n1+n21≤c1,n2+n12≤c2 . (19) Deriving the global balance equation and detailed balance
equations we obtain the following solution of the
steady-state distribution and the expression for blocking probability calculation for each operator
π(n)=K−1(λ1/µ1)
(n1+n12)(λ
2/µ2)(n2+n21) (n1+n12)! (n2+n21)!
, ∀ n∈Ω (20) and
K =X
n∈Ω
(λ1/µ1)(n1+n12)(λ2/µ2)(n2+n21) (n1+n12)! (n2+n21)!
. (21)
The blocking probability can be derived from the steady-state distribution (20). The blocking probability for operatori, i=1,2, is then given by
P(bi)=
X
n∈Ti π(n)
=X
n∈Ti
(λ1/µ1)(n1+n12)(λ2/µ2)(n2+n21) (n1+n12)! (n2+n21)! ·
X
n∈Ω
(λ1/µ1)(n1+n12)(λ2/µ2)(n2+n21) (n1+n12)! (n2+n21)!
−1
, (22)
where
T1=n∈Ω|(n1+n21=c1∩n12+n2=c2) , (23)
and
T2 =n∈Ω|(n1+n21=c1∩n12+n2 =c2) . (24)
D. Sharing Model 3 (Bi-directional overflow with reserved capacity)
f
λ1 1{n1<c1}(n)+1{n1=c1,n12+n2<c2}(n)
+λ 2(n)+
2 X
i=1
niµi+n12µ1
g
·π(n)=λ1π(n−I1) +π(n−I12)1{n1=c1,n12+n2<c2}(n)
+λ
2π(n−I2)+ 2 X
i=1
(ni +1)µiπ(n+Ii)+(n12+1)µ1π(n+I12), (12)
Blocking
Overflow
λ1 λ2
µ1 µ2
Overflow
µ2
Operator 1 Operator 2 Reservedcapacity Blocking
Fig. 5: A two-operators network with bi-directional overflow and reserved resources (Model 3)
Let X1(t) be the number of channel requests in Operator 1 and X2(t) be the number of channel requests in Operator 2 at timet. AlsoX12(t) denotes the number of channel requests in Operator 2 overflowed from Operator 1 and X21(t) denotes the number of channel requests in Operator 1 overflowed from Operator 2 at time t. Capacity at Operator 1 and 2 are denoted by c1 and c2 respectively. If there is no available channels to admit the new traffic in Operator 2 and Operator 1 then the request will be transferred to the reserved resource with capacity c3. A state of the network can be written as
X = X1(t),X12(t),X2(t),X21(t),X23(t),t ≥ 0 with state space given by
Ω=n=(n
1,n12,n2,n21,n23) : n1+n21≤c1,
n2+n12 ≤c2,n23≤c3 , (25)
where ni, i =1,2, is the number of channel requests at the ith operator and ni j is the number of requests overflowed at operator j from operatori,i,j ∈ {1,2,3}. The transition rates
Q= q(n,n0),n,n0∈Ω are given by
q(n,n0)=
λ1 n0=n+I1 or n0=n+I12 if n1 =c1
λ2 n0=n+I2 or n0=n+I21 if n2 =c2 or n0=n+I23 if n2=c2 andn1+n21=n2
niµi n0=n−Ii, i=1,2
ni jµi n0=n−Ii j, i,j ∈ {1,2}
n23µ2 n0=n−I23
0 otherwise.
(26)
The global balance equation of the system can be derived
as The detailed balance equations obtained from the global
balance equation (27) is given by
λi π(n−Ii)+π(n−Ii j−I23) = niµi+ni jµi+n23µ2·π(n). (28) The explicit solution of the detailed balance equations after normalisation (Pπ(n)=1) we get
π(n)=K−1(λ1/µ1)
(n1+n12)(λ
2/µ2)(n2+n21+n23) (n1+n12+n23)! (n2+n21)!
, ∀ n∈Ω
(29) and
K=X
n∈Ω
(λ1/µ1)(n1+n12)(λ2/µ2)(n2+n21+n23) (n1+n12)! (n2+n21+n23)!
. (30)
The blocking probability can be derived from the steady-state distribution (29). The blocking probability for Operatori,i= 1,2, is then given by
P(bi)=
X
n∈Ti π(n)
= X
n∈Ti
(λ1/µ1)(n1+n12)(λ2/µ2)(n2+n21+n23) (n1+n12)! (n2+n21+n23)! ·
X
n∈Ω
(λ1/µ1)(n1+n12)(λ2/µ2)(n2+n21+n23) (n1+n12)! (n2+n21+n23)!
−1 , (31)
where
T1=n∈Ω|(n1+n21=c1∩n12+n2=c2) , (32)
and
T2=n∈Ω|(n1+n21=c1∩n12+n2 =c2∩n23=c3) . (33)
[image:7.612.50.300.513.610.2]The models discussed in this paper can be summarised by Figure 6. Even though the models discussed in this paper only consider the interactions between two operators, it can be extended to include more operators with added complexity, for instance, if there are more than two operators in the network, there can be a number of different interactions between operators.
V. ANALYSIS ANDRESULTS
In this section we investigate the robustness of the analytical models which are discussed in Section IV, with different of-fered load (0−30) assuming service rate is always 1, number of server (0−25) and reserved capacity (0,1) across the network. The performance of the proposed resource sharing framework is examined. For the analytical results, it is reasonable that we compare the four scenario specific model configurations: Non-Sharing Model, Sharing Model 1, Sharing Model 2 and Sharing Model 3.
A. Performance comparison between Non-Sharing Model and Model 1
f
λ1 1{n1+n21<c1}+1{n1+n21=c1,n12+n2<c2}
+λ
2 1{n21+n2<c2}+1{n12+n2=c2,n1+n21<c1}+1{n12+n2=c2,n1+n21=c1,n23<c3}
+ 2 X
i=1
niµi+
X
i,j∈ {1,2}
ni jµi +n23µ2
g
·π(n)=λ1π(n−I1)+π(n−I12)1{n1+n21=c1,n12+n2<c2}
+λ
2π(n−I2) +π(n−I21)1{n12+n2=c2,n21+n2<c2}+π(n−I23)1{n12+n2=c2,n21+n2=c2,n23<c3}
+ 2 X
i=1
(ni+1)µiπ(n+Ii)+ X
i,j∈ {1,2}
(ni j+1)µiπ(n+Ii j)+(n23+1)µ2π(n+I23). (27)
Blocking
Non-Overflow Overflow Overflow
New Channel Request rateλi
Resources for Minimum GoS?
Sharing Agreements
Resources for Minimum QoS?
Reserved Capacity?
Network Operatori
Network Operatorj Yes
No
Yes
No
No Yes
No
Yes
Reserved
Fig. 6: The flowchart for the proposed overflow models
for the proposed overflow model for Operator 1 is reduced in comparison to the Non-Sharing Model. However, for the overflow model, the blocking probability for both Operator 1 and 2 converges as λ1 → 30. This is due to the fact that the uni-directional sharing model only allows overflow from Operator 1 to Operator 2. Thus, the capacity for both operators reach saturation gradually as the offered load increases. In addition, for the same offered load in Non-Sharing Model and uni-directional overflow model, it is seen that at Operator 1 with our proposed overflow model whenλ1>10, the blocking probability is lower than those for Non-Sharing Model. This shows superiority of our proposed model over Non-Sharing Model.
To realise the impact of our overflow model on Operator 2 with different offered load values, we have experimented with fixed offered load at Operator 1 as 10 and varied it for Operator 2 from 0 to 30, see Figure 7b. It is evident that the blocking probability of Operator 2 is higher for Model 1, except for when λ2 <10, because of the additional overflow load from Operator 1. Meanwhile, the blocking probability for Operator 1 has decreased as compared to when employing the Non-Sharing Model. It is evident from Figure 7b that the blocking probability for the uni-directional model at Operator 1 is lower than those for Non-Sharing Model. However, in the proposed model, the blocking probability increase with the increase of offered load. This is due to the reason that as λ2 → 30, the capacity gain obtained from sharing decrease with the decrease of the capacity of Operator 2.
[image:8.612.61.422.55.358.2]To demonstrate the trade-off agreements between operators, Figure 8 shows a zoomed region from the boxed area in Figure 7a. We show in the figure that Operator 1 improves its blocking probability by 0.174 while a degraded performance of blocking probability reduction by 0.098 for Operator 2 with offered loads 15 and 10 for operator 1 and 2, respectively, and capacity 10 for both operators. In this case, Operator 2 is expected to gain monetary reward, which may be calculated by using either equation (2) or (6) according to the agreements made during a contractual period.
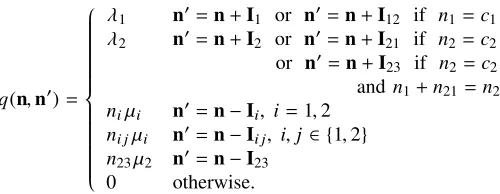
In terms of performance under different number of server, we have compared the blocking probability for Non-Sharing Model with uni-directional overflow model where the number of server at Operator 1 varies from 5 to 25. The number of server is fixed at 10 for Operator 2. For simplicity, in this configuration, we set λ1 = λ2 = 10 and µ1 = µ2 = 1. According to the analytical results, see Figure 9a, the blocking probability at Operator 1 for our proposed model is lower than that for Non-Sharing Model. However, as c1 → 25, the advantage over the Non-Sharing Model becomes less visible due to the fact that Operator 1 increases its own capacity by overflow to Operator 2. Thus, it becomes less dependant on Operator 2, which results in lower overflow levels. In addition, it is also noticed that the blocking probability for Operator 2 with both models are almost the same when the number of server exceed 10.
In order to test the impact of varying the number of server at Operator 2, we have kept the number of server at Operator 1 fixed at 10. For this configuration, we have fixed the offered load for Operator 1 and 2 at 10. The comparison is intended to be representative of the performance in terms of blocking probability at Operator 2, see Figure 9a. It can be seen that as c1 → 25, the blocking probability of Operator 1 and 2 decreases. The overflow model performs slightly better than Non-Sharing Model, while the overflow model at Operator 1 achieves the lowest blocking probability. This analysis is used to show that a non-sharing approach where the operators do not share resources, although in certain cases might perform better than the overflow model, does not perform well when the offered load is high.
B. Performance comparison between Non-Sharing Model, Model 1 and Model 2
0 5 10 15 20 25 30
0.0
0.1
0.2
0.3
0.4
0.5
0.6
0.7
Offered load at Operator 1
Blocking probability
Gain and degradation Blocking prob. (Operator 1) (Non−sharing)
Blocking prob. (Operator 2) (Non−sharing) Blocking prob. (Operator 1) (Model 1) Blocking prob. (Operator 2) (Model 1)
(a)
0 5 10 15 20 25 30
0.0
0.1
0.2
0.3
0.4
0.5
0.6
0.7
Offered load at Operator 2
Blocking probability
Blocking prob. (Operator 1) (Non−sharing) Blocking prob. (Operator 2) (Non−sharing) Blocking prob. (Operator 1) (Model 1) Blocking prob. (Operator 2) (Model 1)
[image:9.612.56.539.67.320.2](b)
Fig. 7: Comparison of blocking probability for Non-Sharing Model with Model 1 with c1 = c2 = 10 for (a) λ1 = 0 : 30,
λ2=10 and (b) λ1=10,λ2=0 : 30
13 14 15 16 17
0.15
0.20
0.25
0.30
0.35
0.40
0.45
0.50
Offered load at Operator 1
Blocking probability
[image:9.612.57.280.385.615.2]Blocking prob. (Operator 1) (Non−sharing) Blocking prob. (Operator 2) (Non−sharing) Blocking prob. (Operator 1) (Model 1) Blocking prob. (Operator 2) (Model 1)
Fig. 8: Gain and degradation performance trade-off between Operator 1 and 2 for Non-sharing and Uni-directional model
blocking probability for the case where the offered load is varied from (0−30) assuming µ1 = µ2 = 1 and c1 = 10. We see that the blocking probability for Operator 1, when considering Model 1, is lower than in Model 2, especially in the region where the offered load is between 5 and 15. The performance of Operator 2 in Figure 10b is identical to the
performance in Figure 10a for Model 2 since the traffic load is always distributed uniformly over the two operators.
The other results in Figure 11a and 11b, represent a com-parison of the bi-directional model with the uni-directional and Non-Sharing Model for varying number of server. When considering individual operators it is evident from the results that Model 1 present better GoS as compared to the other two models. These results show comparisons in achieving lower blocking probability for an operator using baseline assumptions for several parameters.
C. Performance comparison between Non-Sharing Model and Model 3
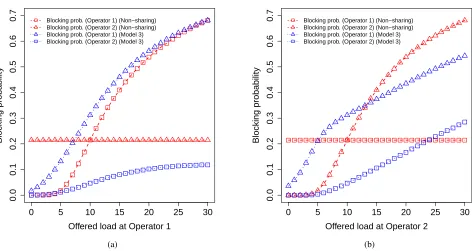
Figure 12a and Figure 12b present the comparison of block-ing probabilities for Non-Sharblock-ing Model and Model 3. Figure 12a shows the effect of increasing traffic intensity at Operator 1, where we demonstrate that the blocking probability is lower when considering the Non-Sharing Model as compared to Model 3. The reason for this is that in Model 3 when the traffic at Operator 2 requires more capacity the setup allows for overflow to Operator 1 first rather than to the reserved capacity which is set to 5. This creates more traffic intensity at Operator 1, which explains the observed blocking probabilities at Operator 1 in Model 3.
5 10 15 20 25
0.0
0.2
0.4
0.6
0.8
1.0
Number of server at Operator 1
Blocking probability
Blocking prob. (Operator 1) (Non−sharing) Blocking prob. (Operator 2) (Non−sharing) Blocking prob. (Operator 1) (Model 1) Blocking prob. (Operator 2) (Model 1)
(a)
5 10 15 20 25
0.0
0.2
0.4
0.6
0.8
1.0
Number of server at Operator 2
Blocking probability
Blocking prob. (Operator 1) (Non−sharing) Blocking prob. (Operator 2) (Non−sharing) Blocking prob. (Operator 1) (Model 1) Blocking prob. (Operator 2) (Model 1)
[image:10.612.62.537.94.340.2](b)
Fig. 9: Comparison of blocking probability for Non-Sharing Model with Model 1 with λ1 = λ2 =10 for (a) c1 =5 : 25, c2=10 and (b) c1 =10,c2=1 : 25
0 5 10 15 20 25 30
0.0
0.1
0.2
0.3
0.4
0.5
0.6
0.7
Offered load at Operator 1
Blocking probability
Blocking prob. (Operator 1) (Non−sharing) Blocking prob. (Operator 2) (Non−sharing) Blocking prob. (Operator 1) (Model 1) Blocking prob. (Operator 2) (Model 1) Blocking prob. ( Operator 1 or 2) (Model 2)
(a)
0 5 10 15 20 25 30
0.0
0.1
0.2
0.3
0.4
0.5
0.6
0.7
Offered load at Operator 2
Blocking probability
Blocking prob. (Operator 1) (Non−sharing) Blocking prob. (Operator 2) (Non−sharing) Blocking prob. (Operator 1) (Model 1) Blocking prob. (Operator 2) (Model 1) Blocking prob. (Operator 1 or 2) (Model 2)
(b)
Fig. 10: Comparison of blocking probability for Non-Sharing Model with Model 1 and Model 2 with c1 =c2 =10 for (a)
[image:10.612.57.541.443.694.2]5 10 15 20 25
0.0
0.2
0.4
0.6
0.8
Number of server at Operator 1
Blocking probability
Blocking prob. (Operator 1) (Non−sharing) Blocking prob. (Operator 2) (Non−sharing) Blocking prob. (Operator 1) (Model 1) Blocking prob. (Operator 2) (Model 1) Blocking prob. (Operator 1 or 2) (Model 2)
(a)
5 10 15 20 25
0.0
0.2
0.4
0.6
0.8
Number of server at Operator 2
Blocking probability
Blocking prob. (Operator 1) (Non−sharing) Blocking prob. (Operator 2) (Non−sharing) Blocking prob. (Operator 1) (Model 1) Blocking prob. (Operator 2) (Model 1) Blocking prob. (Operator 1 or 2) (Model 2)
[image:11.612.60.539.94.340.2](b)
Fig. 11: Comparison of blocking probability for Non-Sharing Model with Model 1 and Model 2 with λ1 =λ2 =10 for (a) c1=1 : 25,c2 =10 and (b) c1=10,c2=1 : 25
0 5 10 15 20 25 30
0.0
0.1
0.2
0.3
0.4
0.5
0.6
0.7
Offered load at Operator 1
Blocking probability
Blocking prob. (Operator 1) (Non−sharing) Blocking prob. (Operator 2) (Non−sharing) Blocking prob. (Operator 1) (Model 3) Blocking prob. (Operator 2) (Model 3)
(a)
0 5 10 15 20 25 30
0.0
0.1
0.2
0.3
0.4
0.5
0.6
0.7
Offered load at Operator 2
Blocking probability
Blocking prob. (Operator 1) (Non−sharing) Blocking prob. (Operator 2) (Non−sharing) Blocking prob. (Operator 1) (Model 3) Blocking prob. (Operator 2) (Model 3)
(b)
[image:11.612.65.537.443.694.2]compared to Non-Sharing Model. The number of server setup which is used for Figure 12a and Figure 12b are illustrated in Table II.
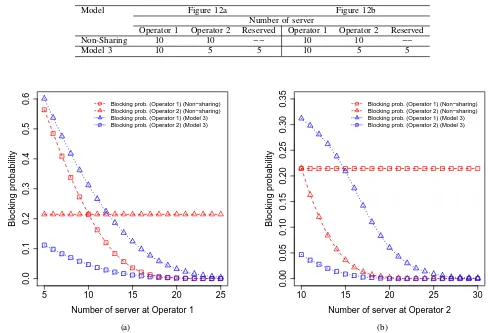
The effect of number of server on blocking probability at Operator 1 and Operator 2 for Non-Sharing Model and Model 3 is presented in Figure 13a and Figure 13b, respec-tively. The traffic intensity is kept fixed for both operators. The results in Figure 13a shows that the blocking probability for the Non-Sharing Model at Operator 1 is lower than Model 3. The reason is related to the traffic overflow from Operator 2, which adds an extra traffic at Operator 1. On the other hand, the blocking probability in Model 3 presents higher gain from the overflow flexibility, which benefits from the extra capacity provided by both Operator 1 and the reserved capacity. From Figure 12 and 13 we notice that for a particular operator, Model 3 does not always guarantee the enhancement of the grade of service (GoS), instead the Non-Sharing Model can serve a higher GoS. The number of server setup which is used for Figure 13a and Figure 13b are illustrated in Table III.
D. Evaluation of models under homogeneous traffic intensity
We have compared the blocking probability for Non-Sharing Model, sharing Model 1, 2 and 3, see Table IV. The table shows the overall network blocking probability for each model configuration. Note that we defined the overall blocking prob-ability of the networks as
P(b)=
n X
i=1
P(b1)g(λ1, µ1)+P(b2)g(λ2, µ2)+
. . . +P(bn)g(λn, µn), (34)
where P(bi) is the blocking probability at operator i and
g(λi, µi) is a function of arrival rate and service rate for the ith operator, which give the weight for theith operator. In our case we assumed
g(λi, µi)=
λi/µi
λ1/µ1+λ2/µ2+. . .+λn/µn
. (35)
With three different offered loads (0.25, 0.5, and 1) at Operator 1 and 2, we calculate the blocking probability for individual operators and overall network. To evaluate the models under homogeneous traffic intensity, in Table IV we present a case where the four models have equal total capacity. In Model 3, c1 = 2 and c2 = 1, however, Operator 2 can overflow to the reserved capacity (c3 = 1) in case of no capacity is available at Operator 2 and Operator 1. Table IV shows that Model 3 has a clear advantage over Non-Sharing Model and Model 1 in terms of overall blocking probability. On the other hand, Model 3 has higher blocking probability in comparison to Model 2, this is because the overflow capacity available to Operator 1 is less in Model 3 than in Model 2 which provokes lower resource sharing efficiency.
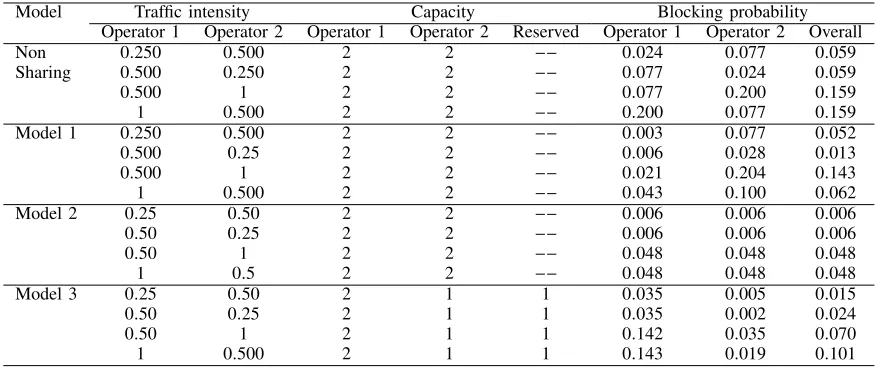
E. Evaluation of models under heterogeneous traffic intensity
To better understand the models’ behaviour, Table V shows the comparison of blocking probabilities among Non-Sharing Model, sharing Model 1, 2 and 3 for heterogeneous traffic
intensity. Table V also includes the overall network blocking probability for each model configuration. It can be concluded from the table that sharing Model 2 and sharing Model 3 have superiority over Non-Sharing Model and Model 1. However, if we compare Model 2 and 3 we see that Model 2 provides the lowest overall blocking probability. This indicates that even for heterogeneous traffic intensity Model 2 provides better GoS with respect to overall network performance. Since the available capacity for both operators in Model 2 is higher, the network ensures better resource utilisation compared to sharing Model 3. Even though the total capacity at Model 3 equal to the total capacity available to Model 2, the latter performs better due to the restriction imposed on the reserved capacity which is accessible only by Operator 1. However, the results for blocking probability with respect to Operator 2 is best in Model 3 due to the reserved capacity which is available only for Operator 2.
In Summary, we have analysed and compared the perfor-mance of three different overflow models with Non-Sharing Model. As a result, the performance achievable by the opera-tors varies according to the operator parameters (e.g. capacity, traffic intensity) and the overflow interactions between opera-tors. It implies that operators have the incentive to participate in the proposed sharing models since they can achieve reduced blocking probability as compared to Non-Sharing Model.
VI. CONCLUSION
Cooperative resource sharing is considered to be one of the key challenges for future generation wireless communication networks. The problem of resource allocation under sharing environment increases as the number of cooperating network operators increase with their complex sharing agreements. Consequently, network operators has to deal with spectrum allocation for a number of service types and operators. To the best of our knowledge, there is no work that study the resource allocation problem under different resource sharing schemes which depend on many factors such as agreements between network operators and spectrum availability between coexistent network operators.
Considering a number of overflow mechanisms we ad-dressed the resource sharing problem and presented a ro-bust analytical framework for DSA. We have proposed four different models: Non-Sharing Model, sharing model with uni-directional overflow (Model 1), sharing model with bi-directional overflow (Model 2) and sharing model with re-served capacity for one of the operators in the network (Op-erator 2) and a bi-directional overflow between both op(Op-erators (Model 3). We have derived the global balance equation, and found an explicit expression of the blocking probability for each resource sharing model. Blacking probabilities are calculated for each model under various traffic scenarios. The results show that the operators can achieve a notable reduction of blocking probability under the proposed models compared with the Non-Sharing Model.
TABLE II: Number of server considered in Figure 12a and Figure 12b
Model Figure 12a Figure 12b
Number of server
Operator 1 Operator 2 Reserved Operator 1 Operator 2 Reserved
Non-Sharing 10 10 −− 10 10 −−
Model 3 10 5 5 10 5 5
5 10 15 20 25
0.0
0.1
0.2
0.3
0.4
0.5
0.6
Number of server at Operator 1
Blocking probability
Blocking prob. (Operator 1) (Non−sharing) Blocking prob. (Operator 2) (Non−sharing) Blocking prob. (Operator 1) (Model 3) Blocking prob. (Operator 2) (Model 3)
(a)
10 15 20 25 30
0.00
0.05
0.10
0.15
0.20
0.25
0.30
0.35
Number of server at Operator 2
Blocking probability
Blocking prob. (Operator 1) (Non−sharing) Blocking prob. (Operator 2) (Non−sharing) Blocking prob. (Operator 1) (Model 3) Blocking prob. (Operator 2) (Model 3)
(b)
Fig. 13: Comparison of blocking probability for Non-Sharing Model with Model 3 for λ1=λ2=10. See Table III for server configurations for (a) and (b).
TABLE III: Number of server considered in Figure 13a and Figure 13b
Model Figure 12a Figure 12b
Number of server
Operator 1 Operator 2 Reserved Operator 1 Operator 2 Reserved
Non-Sharing 5 : 25 10 −− 10 10 : 30 −−
Model 3 5 : 25 5 5 10 5 : 25 5
services which are provided by the operators. The results in our paper highlight the importance of resource sharing for communication networks. The analysis provided in this paper can be used to inform network operators to determine agreements terms for any future spectrum sharing cooperation with coexisting network operators.
ACKNOWLEDGEMENT
We would like to thank the Editor, Associate Editor and all the reviewers for their valuable comments and suggestions to improve the quality of the paper.
REFERENCES
[1] A. Palaios, J. Riihijarvi, P. Mahonen, V. Atanasovski, L. Gavrilovska, P. Van Wesemael, A. Dejonghe, and P. Scheele, “Two days of spectrum use in Europe,” in7th International ICST Conference on Cognitive Radio Oriented Wireless Networks and Communications (CROWNCOM), 2012, pp. 24–29.
[2] M. Hoyhtya, M. Matinmikko, X. Chen, J. Hallio, J. Auranen, R. Ek-man, J. Roning, J. Engelberg, J. Kalliovaara, T. Taher, A. Riaz, and D. Roberson, “Measurements and analysis of spectrum occupancy in the 2.3x2013; 2.4 GHz band in Finland and Chicago,” in9th Interna-tional Conference on Cognitive Radio Oriented Wireless Networks and Communications (CROWNCOM).
[3] I. Akyildiz, W.-Y. Lee, and K. Chowdhury, “Spectrum management in cognitive radio ad hoc networks,” IEEE Network, vol. 23, no. 4, pp. 6–12, 2009.
[4] B. Wang and K. Liu, “Advances in cognitive radio networks: a survey,” IEEE Journal of Selected Topics in Signal Processing, vol. 5, no. 1, pp. 5–23, Feb. 2011.
[5] P. Kolodzy, “Spectrum policy task force,” Federal Communications Commission, Tech. Rep. ET Docket No. 02- 135, Nov. 2002. [6] A. Wyglinski, M. Nekovee, and Y. Hou,Cognitive radio communications
and networks: principles and practice. Academic Press, 2010. [7] X. Liu, C. Zhang, and X. Tan, “Double-threshold cooperative detection
for cognitive radio based on weighing,” in6th International ICST Con-ference on Communications and Networking in China (CHINACOM), 2011, pp. 205–209.
[8] I. Akyildiz, W.-Y. Lee, M. C. Vuran, and S. Mohanty, “A survey on spec-trum management in cognitive radio networks,”IEEE Communications Magazine, vol. 46, no. 4, pp. 40–48, Apr. 2008.
[image:13.612.52.540.65.398.2] [image:13.612.127.482.456.509.2]TABLE IV: Comparison of blocking probabilities for Non-Sharing Model with Model 1, Model 2 and Model 3 with homogeneous traffic intensity
Model Traffic intensity Capacity Blocking probability
Operator 1 Operator 2 Operator 1 Operator 2 Reserved Operator 1 Operator 2 Overall
Non 0.25 0.25 2 2 −− 0.024 0.024 0.024
Sharing 0.50 0.50 2 2 −− 0.077 0.077 0.077
1 1 2 2 −− 0.200 0.200 0.200
Model 1 0.25 0.25 2 2 −− 0.001 0.025 0.013
0.500 0.500 2 2 −− 0.011 0.081 0.046
1 1 2 2 −− 0.069 0.220 0.145
Model 2 0.250 0.250 2 2 −− 0.002 0.002 0.002
0.500 0.500 2 2 −− 0.015 0.015 0.015
1 1 2 2 −− 0.095 0.095 0.095
Model 3 0.250 0.250 2 1 1 0.013 0.001 0.007
0.500 0.500 2 1 1 0.067 0.010 0.039
1 1 2 1 1 0.225 0.058 0.142
TABLE V: Comparison of blocking probability for Non-Sharing Model, Model 1, Model 2 and Model 3 with heterogeneous traffic intensity
Model Traffic intensity Capacity Blocking probability
Operator 1 Operator 2 Operator 1 Operator 2 Reserved Operator 1 Operator 2 Overall
Non 0.250 0.500 2 2 −− 0.024 0.077 0.059
Sharing 0.500 0.250 2 2 −− 0.077 0.024 0.059
0.500 1 2 2 −− 0.077 0.200 0.159
1 0.500 2 2 −− 0.200 0.077 0.159
Model 1 0.250 0.500 2 2 −− 0.003 0.077 0.052
0.500 0.25 2 2 −− 0.006 0.028 0.013
0.500 1 2 2 −− 0.021 0.204 0.143
1 0.500 2 2 −− 0.043 0.100 0.062
Model 2 0.25 0.50 2 2 −− 0.006 0.006 0.006
0.50 0.25 2 2 −− 0.006 0.006 0.006
0.50 1 2 2 −− 0.048 0.048 0.048
1 0.5 2 2 −− 0.048 0.048 0.048
Model 3 0.25 0.50 2 1 1 0.035 0.005 0.015
0.50 0.25 2 1 1 0.035 0.002 0.024
0.50 1 2 1 1 0.142 0.035 0.070
1 0.500 2 1 1 0.143 0.019 0.101
multiple primary and secondary users,”IEEE Transactions on Vehicular Technology, vol. 60, no. 4, pp. 1756–1765, May 2011.
[10] P. Si, H. Ji, F. Yu, and V. Leung, “Optimal cooperative internetwork spectrum sharing for cognitive radio systems with spectrum pooling,” IEEE Transactions on Vehicular Technology, vol. 59, no. 4, pp. 1760– 1768, May 2010.
[11] V. Asghari and S. Aissa, “End-to-end performance of cooperative relay-ing in spectrum-sharrelay-ing systems with quality of service requirements,” IEEE Transactions on Vehicular Technology, vol. 60, no. 6, pp. 2656– 2668, Jul. 2011.
[12] T. Kwon and J. Cioffi, “Spatial spectrum sharing for heterogeneous SIMO networks,”IEEE Transactions on Vehicular Technology, vol. 63, no. 2, pp. 688–702, Feb. 2014.
[13] E. Perez, K.-J. Friederichs, I. Viering, and J. Diego Naranjo, “Optimiza-tion of authorised/licensed shared access resources,” in9th International Conference on Cognitive Radio Oriented Wireless Networks and Com-munications (CROWNCOM), Jun. 2014, pp. 241–246.
[14] R. Etkin, A. Parekh, and D. Tse, “Spectrum sharing for unlicensed bands,”IEEE Journal on Selected Areas in Communications, vol. 25, no. 3, pp. 517–528, Apr. 2007.
[15] C. Xin, M. Song, L. Ma, S. Shetty, and C.-C. Shen, “Control-free dynamic spectrum access for cognitive radio networks,” in IEEE In-ternational Conference on Communications (ICC), May 2010, pp. 1–5. [16] W. Song, W. Zhuang, and Y. Cheng, “Load balancing for cellular/WLAN integrated networks,”IEEE Network, vol. 21, no. 1, pp. 27–33, Jan. 2007. [17] C. Leong, W. Zhuang, Y. Cheng, and L. Wang, “Optimal resource allocation and adaptive call admission control for voice/data integrated cellular networks,”IEEE Transactions on Vehicular Technology, vol. 55, no. 2, pp. 654–669, Mar. 2006.
[18] Y. Pei and Y.-C. Liang, “Cooperative spectrum sharing with bidirectional
secondary transmissions,”IEEE Transactions on Vehicular Technology, vol. 64, no. 1, pp. 108–117, 2015.
[19] P. Zhu, J. Li, and X. Wang, “Scheduling model for cognitive radio,” in3rd International Conference on Cognitive Radio Oriented Wireless Networks and Communications (CROWNCOM), May 2008, pp. 1–6. [20] M. Fidler and A. Rizk, “A guide to the stochastic network calculus,”
IEEE Communications Surveys Tutorials, vol. 17, no. 1, pp. 92–105, Firstquarter 2015.
[21] L. Luo and S. Roy, “Analysis of dynamic spectrum access with hetero-geneous networks: Benefits of channel packing scheme,” inIEEE Global Telecommunications Conference (GLOBECOM), Nov. 2009, pp. 1–7. [22] S. Tang and B. Mark, “Modeling an opportunistic spectrum sharing
sys-tem with a correlated arrival process,” inIEEE Wireless Communications and Networking Conference (WCNC), Mar. 2008, pp. 3297–3302. [23] X. Zhu, L. Shen, and T.-S. Yum, “Analysis of cognitive radio spectrum
access with optimal channel reservation,”IEEE Communications Letters, vol. 11, no. 4, pp. 304–306, Apr. 2007.
[24] Q. Huang, K.-T. Ko, and V. Iversen, “Performance modeling for heterogeneous wireless networks with multiservice overflow traffic,” inGlobal Telecommunications Conference, 2009. (GLOBECOM 2009. IEEE), Nov. 2009, pp. 1–7.
[25] Q. Huang, Y.-C. Huang, K.-T. Ko, and V. Iversen, “Loss performance modeling for hierarchical heterogeneous wireless networks with speed-sensitive call admission control,”IEEE Transactions on Vehicular Tech-nology, vol. 60, no. 5, pp. 2209–2223, Jun. 2011.
[26] W. Song and W. Zhuang, “Multi-service load sharing for resource man-agement in the cellular/WLAN integrated network,”IEEE Transactions on Wireless Communications, vol. 8, no. 2, pp. 725–735, Feb. 2009. [27] P. Fitzpatrick, C. S. Lee, and B. Warfield, “Teletraffic performance
[image:14.612.85.527.263.447.2]Journal on Selected Areas in Communications, vol. 15, no. 8, pp. 1549– 1557, Oct. 1997.
[28] G. Giambene,Queuing theory and telecommunications. Springer, 2005. [29] P. Ahokangas, K. Horneman, H. Posti, M. Matinmikko, T. Hanninen, S. Yrjola, and V. Goncalves, “Defining x201c; co-primary spectrum sharing x201d; x2014; a new business opportunity for MNOs?” in 9th International Conference on Cognitive Radio Oriented Wireless Networks and Communications (CROWNCOM), Jun. 2014, pp. 395–400. [30] L. Duan, J. Huang, and B. Shou, “Duopoly competition in dynamic spectrum leasing and pricing,”IEEE Transactions on Mobile Computing, vol. 11, no. 11, pp. 1706–1719, 2012.
[31] C. Gizelis, D. D. Vergados, et al., “A survey of pricing schemes in wireless networks,”IEEE Communications Surveys & Tutorials, vol. 13, no. 1, pp. 126–145, 2011.
[32] L. Gao, J. Huang, Y.-J. Chen, and B. Shou, “An integrated contract and auction design for secondary spectrum trading,”IEEE Journal on Selected Areas in Communications, vol. 31, no. 3, pp. 581–592, 2013. [33] G. Kasbekar, S. Sarkar, K. Kar, P. Muthuswamy, and A. Gupta,
“Dy-namic contract trading in spectrum markets,” IEEE Transactions on Automatic Control, vol. 59, no. 10, pp. 2856–2862, 2014.