Vol.:(0123456789)
https://doi.org/10.1007/s41669-018-0097-9 ORIGINAL RESEARCH ARTICLE
Does Structured Exercise Improve Cognitive Impairment in People
with Mild to Moderate Dementia? A Cost‑Effectiveness Analysis
from a Confirmatory Randomised Controlled Trial: The Dementia
and Physical Activity (DAPA) Trial
Iftekhar Khan1,2 · Stavros Petrou1 · Kamran Khan1 · Dipesh Mistry1 · Ranjit Lall1 · Bart Sheehan3 · Sarah Lamb1,4,5 ·
on behalf of the DAPA Trial Group
© The Author(s) 2018
Abstract
Background Previous studies suggest that physical exercise could slow dementia progression. However, evidence for the cost effectiveness of structured exercise is conflicting and based on small trials.
Objectives The objective of this study was to compare the cost effectiveness of a tailored, structured, moderate- to high-intensity exercise programme versus usual care in people with mild to moderate dementia.
Methods An economic evaluation was conducted from the UK National Health Service and personal social services perspective, based on data from a large randomised controlled trial. The primary clinical outcome was the participant reported ADAS-Cog (Alzheimer’s Disease Assessment Scale–Cognitive Subscale) at 12 months. Costs (£; 2014–2015 prices) were collected prospectively over a 12-month follow-up period. A bivariate regression of costs and quality-adjusted life-years (QALYs), with multiple imputation of missing data, was conducted with the view to estimating the incremental cost per QALY gained and the incremental net monetary benefit (INMB) associated with the exercise programme plus usual care versus usual care. Sensitivity analyses were undertaken to assess the impact of uncertainty surrounding aspects of the economic evaluation, and pre-specified subgroup analyses explored heterogeneity in the cost-effectiveness results.
Results Participants (n = 494) were randomised to exercise plus usual care or usual care only. By 12 months the mean ADAS-Cog score had worsened slightly to 25.2 (standard deviation [SD] 12.3) in the exercise arm and 23.8 (SD 10.4) in the usual care: difference − 1.4, 95% confidence interval (CI) − 2.6 to − 0.2 (p = 0.03). The mean (standard error [SE]) costs over 12 months for experimental versus control was £5945 (US$7856) versus £4597 (US$6574), respectively; (difference: £1347 [$1926]; p = 0.0426). Mean (SE) QALY estimates were 0.787 (0.012) versus 0.826 (0.019), respectively (p = 0.090). The probability that the exercise programme is cost effective was < 1% across cost-effectiveness thresholds. INMBs ranged between –£2601 (US$3719) and £2158 (US$3086) at cost-effectiveness thresholds between £15,000 (US$21,450) and £30,000 (US$42,900) per QALY. The cost-effectiveness results remained robust to several sensitivity and subgroup analyses.
Conclusions Building on the clinical results of the trial, which showed that the structured exercise programme evaluated does not slow cognitive impairment in people with mild to moderate dementia, this economic evaluation shows that the programme is not cost effective.
DAPA Trial Group members are listed in Acknowledgement section.
Electronic supplementary material The online version of this article (https ://doi.org/10.1007/s4166 9-018-0097-9) contains supplementary material, which is available to authorized users.
* Iftekhar Khan
i.khan.2@warwick.ac.uk
Key Points for Decision Makers
This study is the largest randomised controlled trial to date that evaluates the cost effectiveness of structured exercise in in people with dementia.
Structured exercise is shown not to be cost effective for people with dementia.
Patients became physically fitter due to exercise; these benefits did not translate into improvements in important cognitive outcomes.
1 Introduction
Dementia is a syndrome characterised by acquired, progres-sive deterioration in memory, general cognitive function, self-care and personality. It affects mainly older people. Dementia prevalence in developed countries approximately doubles in successive 5-year age groups between 65 and 99 years, from under 1% for 65- to 69-year-olds to about 35% in 95- to 99-year-olds [1]. Approximately 60% and 20% of dementia cases in developed countries are caused by Alz-heimer’s disease and vascular dementia, respectively [2], whilst mixed Alzheimer’s/vascular dementia and dementia with Lewy bodies are other common causes. In the UK, there are approximately 670,000 dementia sufferers [3].
Although dementia prevalence has fallen in Western Europe and the USA [4, 5], the worldwide economic burden of dementia remains high at US$815 billion [6]. In the USA, this economic burden is estimated to be at least US$157 bil-lion [7]. In Europe, it is approximately €250 billion (US$268 billion) [8, 9], £23 billion [10] (US$35 billion) of which falls on the UK health services. The global cost is expected to rise to US$2 trillion by 2030 [6]; hence, reducing it is impor-tant to healthcare systems worldwide. Moreover, common drug treatments offer modest efficacy with average annual acquisition costs, ranging from £948 (US$1197) to £996 (US$1423) (56 tablet pack, depending on dose) for rivasti-gamine and galantamine, respectively [11, 12], excluding costs associated with toxicity-related over-exposure (high dosing) or drug interactions [13]. The probability of cost effectiveness of these drug treatments does not exceed 20% at cost-effectiveness thresholds as high as £40,000 per addi-tional quality-adjusted life-year (QALY) [14].
Current (drug) interventions aim to reduce risk and/or alleviate symptoms of, rather than cure, dementia. Some (mechanistic) studies have shown positive associations between physical activity and cognition [15] in humans. Structured exercise has been shown to offer benefit to dementia sufferers in several previous epidemiological
studies [16–18]. In clinical studies, however, no confirma-tory evidence on the effectiveness of exercise on dementia symptoms has been reported. This may be due to several fac-tors associated with study design, heterogeneity in the popu-lations, small sample sizes and exercise intensity. Moreover, evidence for the cost effectiveness of exercise in people with dementia is limited and based on small trials [19, 20].
We therefore present the results from a cost-effectiveness analysis of a high-intensity structured exercise intervention delivered in the context of the largest confirmatory ran-domised controlled trial (RCT) reported to date.
2 Methods
2.1 Trial Background
The DAPA (Dementia and Physical Activity) RCT was a multicentre, pragmatic RCT. Individuals with a clinically confirmed diagnosis of dementia in accordance with the
Diagnostic and Statistical Manual, 4th Edition (DSM-IV), and a standardised Mini-Mental State Examination (sMMSE) score of > 10, were recruited from 15 regions across England between February 2013 and June 2015. Par-ticipants were randomised (2:1 ratio) to either a moderate- to high-intensity, tailored structured exercise programme or usual practice.
The primary clinical outcome was the participant-reported ADAS-Cog (Alzheimer’s Disease Assessment Scale–Cognitive Subscale) at 12 months. A total of 375 par-ticipants were required to detect a difference of 2.45 ADAS-Cog points (standardised effect of 0.31) in the ADAS-ADAS-Cog (80% power, 5% type I error). Further details of the trial are reported elsewhere [21, 22].
2.2 Interventions
2.2.1 Exercise (Experimental)
2.2.2 Usual Care (Control)
All participants received usual care consistent with the National Institute for Health and Care Excellence (NICE) clinical guidance [23]. This comprised counselling for car-ers and families, clinical assessment, prescription of symp-tomatic treatments and brief advice about physical activity [24, 25]. Treatment was determined by the participants’ physicians on the basis of clinical need and was monitored through the study period.
2.3 Overview of Economic Evaluation
The economic evaluation was designed as a cost-utility anal-ysis with the cost effectiveness of the exercise intervention, compared with usual care, expressed in terms of incremental cost per QALY gained. The primary analysis was undertaken from the perspective of the UK National Health Service (NHS) and Personal Social Services (PSS), as recommended by NICE methodological guidance for technology appraisals and additionally from a societal perspective for the purposes of a sensitivity analysis [26]. A 12-month time horizon for the economic evaluation was used (12-month follow-up of RCT), and therefore no discounting was required.
2.4 Cost of the Exercise Programme
The costs relating to delivering the exercise programme, inclusive of training, delivery of group sessions, equipment (e.g. belts, weights, exercise bike), monitoring activities, follow-up, administrative activities, telephone contacts, supervision activities, travel costs and venue hire costs were estimated using weekly activity logs completed by physi-otherapists and exercise assistants. Cost data were combined with attendance data to derive estimates of mean cost per session per attending participant for each group within each site.
2.5 Measurement of Broader Resource Use
Broader health and personal social service and broader societal resource inputs (for the purposes of a sensitivity analysis) were collected (through interviews) at baseline and 6 and 12 months post-randomisation using a modified ver-sion of the Client Services Receipt Inventory (CSRI; verver-sion 1.0) [27, 28]. Resource use data included use of sheltered housing/care home accommodation, hospital and day-care services, community-based health and social care, and aids and equipment. Details of travel costs (borne by trial pants or family members or friends) due to the trial partici-pants’ health status or contacts with health or social services were collected. Medication costs were derived from dose frequency and duration.
2.6 Valuation of Resource Use
Resource inputs were valued using primary research (e.g. participant travel costs, participant time taken off work) and data collated from secondary sources, with the valuation of the latter informed by national methodological guidance (Electronic Supplementary Material Appendix Table 1) [26].
Staff inputs associated with the delivery of the exercise programme were determined from hourly unit costs for each Agenda for Change band [29]; these included staff salaries, qualification costs, employer on-costs and associated rev-enue and capital overheads. Travel costs (for each mile) were determined from the Automobile Association (AA) [30] and the Department for Transport Public Service Vehicle Survey [31]. Hospital inpatient admissions were valued using NHS Reference Costs trusts schedules [32]. Other hospital-based costs were valued using national tariffs [29, 32]. Community health and social care resource use was valued using second-ary sources [29]. Participant-level costs for medication use were valued using Health and Social Care Information Cen-tre (HSCIC) drug costs (2015) [11]. Gender-specific median earnings data were derived from self-reported work status information and used to estimate the costs of time taken off work (by family members/carers or participants). Other family-borne costs were also determined. The NHS Hospital and Community Health Services Pay and Prices Index was used to inflate/deflate costs where necessary to 2014–2015 prices (£ sterling) [33].
2.7 Health‑Related Quality of Life: Health Utilities and QALYs
process accounting for variation in baseline utility values [35].
2.8 Missing Data
Multiple imputation (MI) using the method of chained equations (MCMC) was used for the base-case analysis to impute missing resource use and HRQoL data [36], taking into account covariates including baseline costs, baseline utilities, age, gender and baseline MMSE score (< 20; ≥ 20). Mean matching using predictive methods was used to improve estimates of imputed values since normality could not be assumed. Each imputed dataset was analysed indepen-dently using model-based approaches; estimates were pooled to generate mean and variance estimates of costs and QALYs using Rubin’s rule to capture within and between variances for imputed samples [37]. Information loss from finite impu-tation sampling was minimised using 20 datasets, resulting in minimal loss of efficiency (< 0.5%) [38]. Since the frac-tion of informafrac-tion missing was reasonably low, 20 imputa-tion sets were considered adequate. Imputed and observed values were compared to establish that imputation did not introduce bias into subsequent estimation [38].
2.9 Cost‑Effectiveness Analyses
Mean resource use, cost and utility values were compared between groups using two sample t-tests. Differences between groups, along with confidence intervals (CIs) were estimated using non-parametric bootstrap estimates (10,000 replications) [26]. Seemingly unrelated regression (SUR) methods that account for the correlation between costs and outcomes were used to estimate mean incremental costs and QALYs whilst adjusting for covariates (baseline costs, baseline utilities, age, gender, and baseline MMSE score (< 20; ≥ 20). Non-parametric bootstrap methods were used to generate the joint distributions of costs and outcomes to populate the cost-effectiveness plane. Bias-corrected non-parametric bootstrapping was used so that the sample cor-relation structure was preserved.
The incremental cost-effectiveness ratio (ICER) was esti-mated as the difference between groups in mean total costs divided by the difference in mean total QALYs. Mean ICER values were compared against cost-effectiveness threshold values [39] ranging between £15,000 (US$21,450) and £30,000 (US$42,900) per QALY using 2015 purchasing power parities (£1 = US$1.43) [33], thereby encompassing threshold values recommended by NICE. The cost-effective-ness thresholds provide an indication of society’s willing-ness to pay for an additional QALY; lower ICER values than the threshold could be considered cost effective for use in the UK NHS. The incremental net monetary benefit (INMB) of switching from usual care to an exercise programme was
also reported. The INMB describes the resource gain (or loss) when investing in a new intervention when resources can be used elsewhere at the same cost-effectiveness thresh-old. Cost-effectiveness acceptability curves (CEACs) show-ing the probability of the exercise programme beshow-ing cost effective over the range of cost-effectiveness thresholds were generated. All analyses were conducted in SAS® version 9.4
(SAS Institute, Cary, NC, USA) on a Microsoft Windows (Microsoft Corp., Redmond, WA, USA) platform.
2.10 Sensitivity and Subgroup Analyses
Several pre-specified sensitivity analyses were undertaken to assess the impact on the base-case economic evalua-tion. These included a complete cases analysis, adopting a wider societal perspective that included costs incurred by all sectors of the economy, recalculating QALYs using carer-reported EQ-5D-3L values, recalculating the average cost per participant per exercise session by taking into account practitioner travel costs, varying the cohort size for the exercise programme between the lowest (n = 3) and highest (n = 10) number of participants attending across all exer-cise groups, and setting the venue hire costs to zero (on the assumption that delivery of the exercise programme in rou-tine UK NHS settings, rather than community venues, may be associated with zero opportunity costs). Pre-specified subgroup analyses were conducted by gender (male, female) and baseline MMSE score (< 20, ≥20).
3 Results
3.1 Study Population and Clinical Results
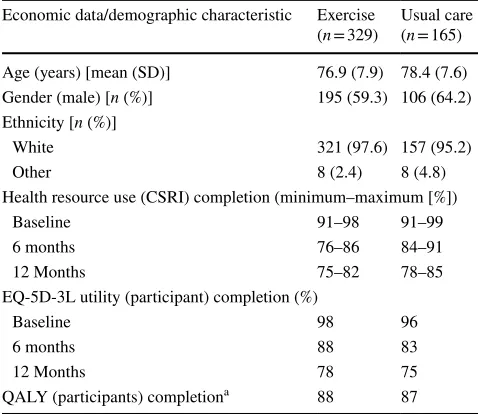
From the 494 participants randomised (329 to the exercise programme and 165 to usual care), complete baseline infor-mation was available for 488 participants (326 for exercise and 162 for control) for the base-case economic evaluation. Between 91 and 99% and 91 and 98% of health resource use data were complete at baseline for the exercise and usual care groups, respectively (Table 1 and Electronic Supple-mentary Material Appendix Table 2).
3.2 Cost of Intervention
The intervention cost components are reported under four main headings: (i) staff costs, inclusive of training activities, planning, direct delivery, administrative activities, meetings with professionals, telephone calls and supervision activi-ties associated with group delivery; (ii) travel costs, based on distances travelled by practitioners by mode of transport; (iii) venue hire costs; and (iv) equipment and other costs for each site, including cost of belts, stopwatches, timers, cones, lap counters, CDs, stationery (e.g. pens, erasers) and trial manuals, associated with group delivery. Total interven-tion costs are also presented within each group within each site (Electronic Supplementary Material Appendix Table 3). These varied between £4444 (US$6355) (Worcester, cohort 53) and £11,342 (US$16,219) (Wolverhampton, cohort 50). The average costs per exercise session per participant varied from about £29 (US$41) (Amersham, cohort 4), to £108 (US$154) (Atrium, cohort 9).
3.3 Broader Resource Use
Broader resource use values are presented for participants with complete data by trial allocation, resource use cate-gory and study period (Electronic Supplementary Material Appendix Table 4).
Amongst participants with complete resource use data, the most frequent health resource inputs were general prac-titioner (GP) visits, hospital stays, practice nurse visits and community psychiatrist contacts. On average, there were no
statistical differences in broader health resource use between groups (Electronic Supplementary Material Appendix Table 4). The mean (standard error [SE]) number of GP contacts per participant over 12 months was 1.8 (0.14) in the exercise arm compared with 1.7 (0.27) in the usual care arm (p = 0.876). Community mental healthcare services, pri-marily through psychiatric support, were used by a smaller proportion of participants in the exercise group at 12 months (10% [28/280] vs. 14% [19/136]; p = 0.224). No noticeable differences in terms of other healthcare resource use were observed between baseline and 12 months for hospital stays, practice nurse visits and community psychiatrist contacts. Resource use frequencies in other categories were low; hence, meaningful comparisons could not be easily made (Electronic Supplementary Material Appendix Table 4).
3.4 Economic Costs
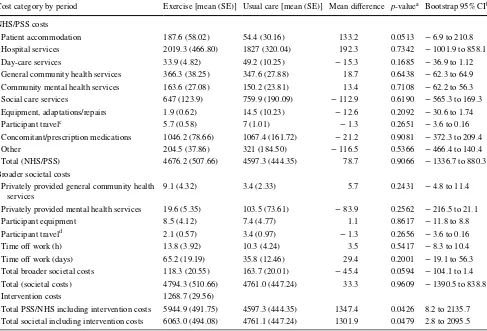
With the exception of the cost of the exercise intervention, there were no statistically significant differences between the trial groups in any cost category between randomisation and 12 months (Table 2).
The mean cost of the exercise programme over the entire follow-up period was £1269 (US$1815). Mean total NHS and personal social service costs, inclusive of the cost of the intervention, were £5945 (US$8501) in the intervention arm compared with £4597 (US$6534) in the control arm, gen-erating a mean cost difference of £1347 (US$1926) (boot-strap 95% CI £8–2136 [US$11–3054]; p = 0.0426). Over the entire follow-up period, and for participants with complete data, mean total societal costs, inclusive of the cost of the intervention, were £6063 (US$8670) in the intervention arm compared with £4761 (US$6808) in the control arm, gener-ating a mean cost difference of £1301 (US$1860) (bootstrap 95% CI £3–2096 [US$4–2997]; p = 0.0479).
3.5 Health‑Related Quality of Life Outcomes
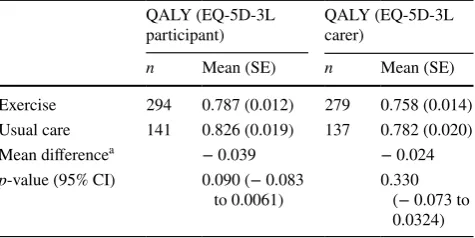
For complete cases, there were no statistically significant differences in participant- or carer-reported EQ-5D-3L util-ity or EQ-5D VAS scores between the exercise and usual care groups. The mean (SE) participant reported QALY esti-mate was 0.787 (0.012) versus 0.826 (0.019) (p = 0.090) for exercise versus usual care (Table 3); this was 0.758 (0.014) versus 0.782 (0.020) for the carer-reported EQ-5D-3L (p = 0.330).
3.6 Cost‑Effectiveness Results: Base‑Case Analysis
The baseline economic evaluation, using imputed attribut-able costs and QALYs with covariate adjustment, resulted in mean total costs of £5580 (US$7974) in the exercise group compared with £3917 (US$5601) in the usual care
Table 1 Summary of economic data completion and demographics
CSRI Client Services Receipt Inventory, QALY quality-adjusted life-year, SD standard deviation
a A full QALY profile estimable between baseline and 12 months
Economic data/demographic characteristic Exercise
(n = 329) Usual care(n = 165)
Age (years) [mean (SD)] 76.9 (7.9) 78.4 (7.6)
Gender (male) [n (%)] 195 (59.3) 106 (64.2)
Ethnicity [n (%)]
White 321 (97.6) 157 (95.2)
Other 8 (2.4) 8 (4.8)
Health resource use (CSRI) completion (minimum–maximum [%])
Baseline 91–98 91–99
6 months 76–86 84–91
12 Months 75–82 78–85
EQ-5D-3L utility (participant) completion (%)
Baseline 98 96
6 months 88 83
12 Months 78 75
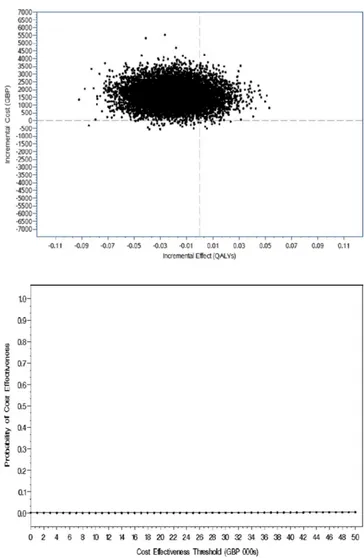
[image:5.595.50.289.71.278.2]group, a mean incremental cost of £1663 (US$2378). The mean incremental cost-effectiveness of the exercise inter-vention was estimated to be − £74,227 (− US$106,145) per QALY, i.e. on average, the experimental interven-tion was associated with a higher cost and a lower effect and was dominated in health economic terms. The asso-ciated mean INMB at cost-effectiveness thresholds of £15,000, £20,000 and £30,000 per QALY were − £2158 (− US$3086), − £2306 (− US$3298) and − £2601 (− US$3719), respectively (Table 4). The base-case mean INMB was < 0, suggesting that the exercise group would result in an average net economic loss of about £2158 (US$3086) (INMB = − £2,158, 95% CI − £3455 to − £969 [− US$4941 to − US$1386]). The cost-effectiveness plane (Fig. 1) shows that the vast majority of the ICER values lie in the north-west quadrant.
The subsequent probability of cost effectiveness is close to zero (Fig. 1), i.e. if decision-makers are willing to pay between £15,000 and £30,000 for an additional QALY, the probability that the exercise intervention is cost effective is < 1% (Table 4).
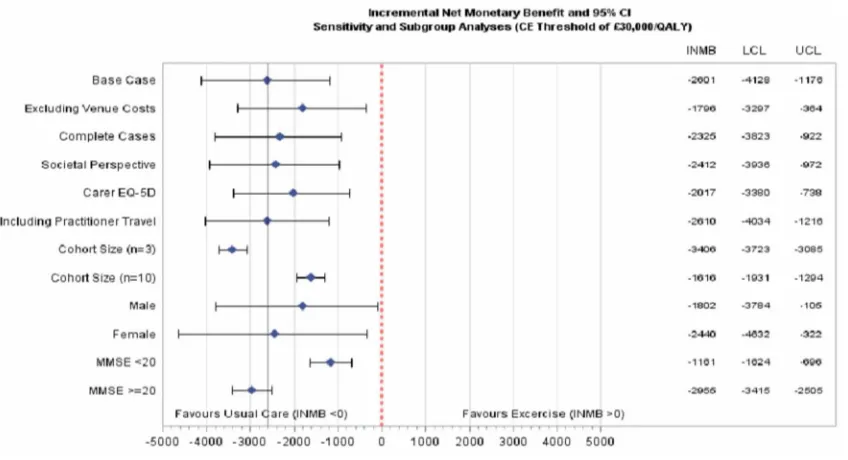
3.7 Sensitivity Analyses
The probability that the exercise intervention is cost effec-tive remained relaeffec-tively static (< 1%) for the majority of the sensitivity analyses (complete cases, societal costs, carer-reported EQ-5D, inclusion of practitioner travel costs, changes in the number of participants per cohort to the lowest number observed). When venue hire costs were excluded and the number of participants per cohort was set at the highest number observed across all groups, the probability that the
Table 2 Economic costs for complete cases by trial allocation, study period and cost category (£; 2014–2015 prices): randomisation to 12 months (n = 416 total; n = 280 exercise and n = 136 usual care)
CI confidence interval, NHS National Health Service, PSS personal social services, SE standard error *Statistically significant at the 2-sided 5% level
ap value calculated using student’s t-test, 2-tail unequal variance
b Non-parametric bootstrap estimation using 10,000 replications, bias corrected c Participant travel consisted of ambulance or NHS-supported travel
d Participant travel consisted of private transport costs (e.g. private taxi)
Cost category by period Exercise [mean (SE)] Usual care [mean (SE)] Mean difference p-valuea Bootstrap 95% CIb
NHS/PSS costs
Patient accommodation 187.6 (58.02) 54.4 (30.16) 133.2 0.0513 − 6.9 to 210.8
Hospital services 2019.3 (466.80) 1827 (320.04) 192.3 0.7342 − 1001.9 to 858.1
Day-care services 33.9 (4.82) 49.2 (10.25) − 15.3 0.1685 − 36.9 to 1.12
General community health services 366.3 (38.25) 347.6 (27.88) 18.7 0.6438 − 62.3 to 64.9
Community mental health services 163.6 (27.08) 150.2 (23.81) 13.4 0.7108 − 62.2 to 56.3
Social care services 647 (123.9) 759.9 (190.09) − 112.9 0.6190 − 565.3 to 169.3
Equipment, adaptations/repairs 1.9 (0.62) 14.5 (10.23) − 12.6 0.2092 − 30.6 to 1.74
Participant travelc 5.7 (0.58) 7 (1.01) − 1.3 0.2651 − 3.6 to 0.16
Concomitant/prescription medications 1046.2 (78.66) 1067.4 (161.72) − 21.2 0.9081 − 372.3 to 209.4
Other 204.5 (37.86) 321 (184.50) − 116.5 0.5366 − 466.4 to 140.4
Total (NHS/PSS) 4676.2 (507.66) 4597.3 (444.35) 78.7 0.9066 − 1336.7 to 880.3
Broader societal costs
Privately provided general community health
services 9.1 (4.32) 3.4 (2.33) 5.7 0.2431 − 4.8 to 11.4
Privately provided mental health services 19.6 (5.35) 103.5 (73.61) − 83.9 0.2562 − 216.5 to 21.1
Participant equipment 8.5 (4.12) 7.4 (4.77) 1.1 0.8617 − 11.8 to 8.8
Participant traveld 2.1 (0.57) 3.4 (0.97) − 1.3 0.2656 − 3.6 to 0.16
Time off work (h) 13.8 (3.92) 10.3 (4.24) 3.5 0.5417 − 8.3 to 10.4
Time off work (days) 65.2 (19.19) 35.8 (12.46) 29.4 0.2001 − 19.1 to 56.3
Total broader societal costs 118.3 (20.55) 163.7 (20.01) − 45.4 0.0594 − 104.1 to 1.4
Total (societal costs) 4794.3 (510.66) 4761.0 (447.24) 33.3 0.9609 − 1390.5 to 838.8
Intervention costs 1268.7 (29.56)
[image:6.595.55.542.82.413.2]Table 3 Cos t-effectiv eness, cos t/q uality -adjus ted lif e-y
ear (£; 2014–2015): e
xer cise pr og ramme com par ed t
o usual car
e Incr ement al cos t (95% CI) Incr ement al QAL Ys (95% CI) ICER a,b Pr
obability of cos
t effectiv eness INMB p c p d p e INMB a,c INMB a,d INMB a,e
Base case (NHS/PSS perspectiv
e)
Im
puted attr
ibut
able cos
ts and QAL
Ys,
co
var
iate- and baseline-adjus
ted EQ-5D
utility scor
e
1663 (120 t
o 3207)
− 0.0220 (− 0.0621 t
o 0.0181)
Dominated
0.0011
0.0012
0.0014
− 2158 (− 3455 t
o − 969)
− 2306 (− 3678 t
o − 1041)
− 2601 (− 4128 t
o − 1176)
Sensitivity anal
yses
1. Com
ple
te cases attr
ibut
able cos
ts and
QAL
Ys, and baseline-adjus
ted EQ-5D
utility scor
e
1549 (458 t
o 2764)
− 0.0254 (− 0.0592 t
o 0.0084)
Dominated
0.0044
0.0044
0.0050
− 1943 (− 3238 t
o − 756)
− 2071 (− 3420 t
o − 828)
− 2325 (− 3823 t
o − 922) 2. Im puted socie tal attr ibut able cos ts and QAL Ys, co var
iate- and baseline-adjus
ted
EQ-5D utility scor
e
1574 (6 to 3123) − 0.0220 (− 0.0621 t
o 0.0181)
Dominated
0.0079
0.0079
0.0068
− 1710 (− 2896 t
o − 503)
− 2233 (− 3789 t
o − 777)
− 2412 (− 3936 t
o − 972)
3. Im
puted attr
ibut
able cos
ts and QAL
Ys,
co
var
iate- and baseline-adjus
ted car
er
-repor
ted EQ-5D utility scor
e
1663 (120 t
o 3207)
− 0.00665 (− 0.0453 t
o 0.0320)
Dominated
0.0026
0.0027
0.0044
− 1867 (− 3094 t
o − 757)
− 1917 (− 3182 t
o − 757)
− 2017 (− 3380 t
o − 738)
4. Im
puted attr
ibut
able cos
ts and QAL
Ys,
co
var
iate- and baseline-adjus
ted EQ-5D
utility scor
e including pr
actitioner tr
av
el
cos
ts
1971 (959 t
o 3122)
− 0.0220 (− 0.0621 t
o 0.0181)
Dominated
0
0.0010
0.0025
− 2264 (− 3439 t
o − 1124)
− 2379 (− 3625 t
o − 1178)
− 2610 (− 4034 t
o − 1216)
5. Im
puted attr
ibut
able cos
ts and QAL
Ys,
co
var
iate- and baseline-adjus
ted EQ-5D
utility assuming cohor
t size (
n
=
3)
2773 (2458 t
o 2954)
− 0.0220 (− 0.0621 t
o 0.0181)
Dominated
0
0
0.0001
− 3055 (− 3327 t
o − 2790)
− 3172 (− 3454 t
o − 2891)
− 3406 (− 3723 t
o − 3085)
6. Im
puted attr
ibut
able cos
ts and QAL
Ys,
co
var
iate- and baseline-adjus
ted EQ-5D
utility assuming cohor
t size (
n
=
10)
983 (669 t
o 1165)
− 0.0220 (− 0.0621 t
o 0.0181)
Dominated
0.0495
0.0486
0.0511
− 1265 (− 1538 t
o − 1000)
− 1382 (− 1663 t
o − 1102)
− 1616 (− 1931 t
o − 1294)
7. Im
puted attr
ibut
able cos
ts and QAL
Ys,
co
var
iate- and baseline-adjus
ted EQ-5D utility scor e, e xcluding v enue hir e cos ts
1203 (–61 t
o 2240)
− 0.0220 (− 0.0621 t
o 0.0181)
Dominated
0.0250
0.0260
0.050
− 1417 (− 2698 t
o − 219)
− 1543 (− 2892 t
o − 286)
− 1796 (− 3297 t
o − 364)
Subg
roup anal
yses (g
ender and MMSE scor
e) Male: Im puted attr ibut able cos ts and QAL Ys, co var
iate- and baseline-adjus
ted
EQ-5D utility scor
e
1383 (23 t
o 3068)
− 0.0263 (− 0.049 t
o 0.027)
Dominated
0.0461
0.0486
0.0608
− 1631 (− 3346 t
o − 33)
− 1688 (− 3469 t
o − 12)
− 1802 (− 3784 t
o − 105) F emale: Im puted attr ibut able cos ts and QAL Ys, co var
iate- and baseline-adjus
ted
EQ-5D utility scor
e
1511 (− 74 t
o 3126)
− 0.0215 (− 0.087 t
o 0.0127)
Dominated
0.0012
0.0016
0.0030
− 2140 (− 3744 t
o − 568)
− 2239 (− 4028 t
o − 499)
− 2440 (− 4632 t
o − 322) Baseline MMSE < 20: Im puted attr ibut able cos
ts and QAL
Ys, co
var
iate- and
baseline-adjus
ted EQ-5D utility scor
e
1206 (804 t
o 1385)
− 0.00204 (− 0.0135 t
o 0.00935)
Dominated
0.0318
0.0326
0.0375
− 1128 (− 1470 t
o − 779)
− 1139 (− 1519 t
o − 753)
− 1161 (− 1624 t
exercise intervention is cost effective remained below 5%. The average INMB was unlikely to be positive as all upper 95% confidence limits were below zero (Table 4 and Fig. 2).
3.8 Subgroup Analyses
The four pre-planned subgroup analyses showed no evidence that gender or the baseline MMSE score has a significant effect on the cost effectiveness of the exercise programme (Table 4 and Fig. 3).
4 Discussion
This trial-based economic evaluation revealed that a moder-ate- to high-intensity aerobic and strength exercise programme delivered in community settings is not cost effective compared with usual care for adults with mild to moderate dementia. The INMB estimate was negative, a finding that remained robust to several sensitivity and subgroup analyses. The strong evidence against our structured exercise programme devel-oped for people with mild to moderate dementia generated by this trial-based economic evaluation is unlikely to be altered by extrapolation of cost effectiveness over a longer time hori-zon. Although it may be possible that there are cumulative or learning effects for which the benefits of the structured exer-cise programme may manifest over the longer term, follow-up after 12 months did not appear to point to this [22].
The main reason for lack of cost effectiveness of the exercise intervention appears to stem from limited clinical benefit as well as it being more costly. We present a rigor-ous evaluation of the costs involved (exceeding on average £100 per participant per session). This cost is higher than other experimental exercise interventions reported else-where [19]. However, this is likely to be due to the inclu-sion of more intensive support by trained physiotherapists and exercise assistants than other programmes as well as
Table 3 (continued) Incr ement al cos t (95% CI) Incr ement al QAL Ys (95% CI) ICER a,b Pr
obability of cos
t effectiv eness INMB p c p d p e INMB a,c INMB a,d INMB a,e Baseline MMSE ≥ 20: Im puted attr ibut able cos
ts and QAL
Ys, co
var
iate- and
baseline-adjus
ted EQ-5D utility scor
e
1951 (1585 t
o 2331)
− 0.0334 (− 0.0415 t
o 0.0253)
Dominated
0.0090
0.0011
0.0021
− 2453 (− 2856 t
o − 2066)
− 2621 (− 3042 t
o − 2216) − 2955 (− 3415,− 2505) CI confidence inter val, ICER incr ement al cos t-effectiv eness r atio, INMB incr ement al ne t mone tar y benefit, MMSE Mini-Ment al S tate Ex amination, NHS N ational Healt h Ser vice, PSS personal social ser vices, QAL Y q uality -adjus ted lif e-y ear
a CIs based on 10,000 simulations. Eac
h simulation based on model-based means adjus
ted f
or baseline utility
, baseline MMSE, g
ender
, ag
e and r
egion, wher
e appr
opr
iate, unless s
tated o ther wise (12% dat a missing/im puted f or QAL
YS and 5% f
or cos
ts)
b Dominated indicates a
ver
ag
e cos
ts w
er
e less and a
ver
ag
e benefit g
reater f
or t
he usual car
e g
roup
c Pr
obability cos
t effectiv
e or ne
t mone
tar
y benefit if cos
t-effectiv
eness t
hr
eshold is £15,000/QAL
Y
d Pr
obability cos
t effectiv
e or ne
t mone
tar
y benefit if cos
t-effectiv
eness t
hr
eshold is £20,000/QAL
Y
e Pr
obability cos
t effectiv
e or ne
t mone
tar
y benefit if cos
t-effectiv
eness t
hr
eshold is £30,000/QAL
Y
Table 4 Participant- and carer-reported EQ-5D-3L quality-adjusted life-years (complete cases)
CI confidence interval, QALY quality-adjusted life-year, SE standard error
a Exercise versus usual care
QALY (EQ-5D-3L
participant) QALY (EQ-5D-3L carer)
n Mean (SE) n Mean (SE)
Exercise 294 0.787 (0.012) 279 0.758 (0.014)
Usual care 141 0.826 (0.019) 137 0.782 (0.020)
Mean differencea − 0.039 − 0.024
p-value (95% CI) 0.090 (− 0.083
[image:8.595.307.545.81.200.2]several other cost components such as equipment and use of site in our calculation of the cost of the intervention. Although patients became physically fitter due to exer-cise [21], these benefits did not translate into improve-ments in mobility and functional activities that may have required demonstrating improved motor re-learning or cognitive outcomes. It is possible that carers are reluctant
to encourage dementia sufferers to re-establish functional activities through fear of injury, although this remains to be elucidated through further research. Consequently, in the absence of any effect in either the primary clinical outcome or the EQ-5D-3L-based QALY, usual care was dominant in health economic terms. Unless exercise pro-grammes are demonstrated to result in downstream cost
Fig. 1 Cost-effectiveness plane. GBP British pounds, QALYs quality-adjusted life-years
[image:9.595.181.545.49.607.2]savings and/or improvements in cognitive or HRQoL out-comes, they are unlikely to be cost effective in resource-constrained systems.
There is limited evidence for cost effectiveness of organ-ised high-intensity exercise interventions in dementia patients reported in the broader literature. This cost-effec-tiveness analysis using participant-level data is based on the largest RCT of its kind reported to date. The results from our analyses are consistent with a recent economic evaluation of exercise therapy for behavioural and psychological symp-toms of dementia [19]. In that smaller RCT (n = 131 sub-jects), exercise therapy was not cost effective. Our larger trial offers a confirmatory conclusion in this regard. In contrast, another smaller (n = 40) trial [20] suggests that community-based exercise programmes confer cognitive and physical benefits with potential to show cost effectiveness, but this remains to be substantiated in larger well-controlled studies.
The main strengths of this analysis are that the trial was prospectively designed for a cost-effectiveness analysis using individual-level data to reach a confirmatory conclusion with respect to exercise training as an intervention in people with dementia. There were, however, several limitations to this cost-effectiveness analysis. Firstly, QALYs were based on util-ity measurements at just two timepoints post-randomisation. Although the trial did not yield benefits, the assumption of lin-earity of HRQoL between data collection points is uncertain and becomes more uncertain when missing data are present.
Secondly, despite the longitudinal nature of the study, resource use was retrospectively recalled by trial participants and carers, which is likely to have resulted in some recall
bias; although the bias is likely to have been similar between randomised arms. Thirdly, a smaller pilot or phase II trial may have been useful in identifying the critical costs that drive cost effectiveness. Instead, data for a broad spectrum of cost categories were collected which, on average, had little impact on the ICER. Many costs items did not occur (Elec-tronic Supplementary Material Appendix Tables 3 and 4) and a reduced form of the CSRI in this setting may be advisable with a focus on the largest and most relevant costs. In addi-tion, the CSRI in several places could be improved as it leads to many categories of ‘other’ costs that are time consuming for data management. Many of these costs had little impact on the results. Sensitivity analyses, for example, showed the cohort size as the most influential factor on the INMB and not some of the cost components incorporated into the analysis.
Finally, the 95% CI for the incremental QALYs does not exclude the possibility of a small QALY benefit (the upper 95% CI is greater than zero; Table 4). However, the upper limit of these intervals from the sensitivity analyses is less than about 0.03 (e.g. for the carer-reported EQ-5D-3L). Hence, for an observed base-case incremental cost of £1683 (US$2407), the ICER is very unlikely to be cost effective even in the most optimistic scenario (i.e. £1683/0.03, an ICER of £56,100 [US$80,223] per QALY in the best case).
5 Conclusion
Data collected in the DAPA trial provides strong evidence that our structured, moderate- to high-intensity exercise
[image:10.595.88.512.56.286.2]programme, in addition to usual care, is unlikely to be cost effective for mild to moderate dementia sufferers when com-pared with usual care alone.
Acknowledgments We thank all trial participants, their carers and
supporters. Trial Management Group: Professor Sarah Lamb, chief investigator; Dr Bart Sheehan, co-applicant; Dr Dipesh Mistry, trial statistician; Dr Ranjit Lall, co-applicant, statistics; Dr Iftekhar Khan and Mr Kamran Khan, health economists; Professor Stavros Petrou, co-applicant, lead health economist; Dr Sukhdeep Dosanjh and Sharisse Alleyne, trial coordinators; Susie Hennings, senior project manager; Vivien Nichols and S. Finnegan, recruitment leads; Nicky Atherton and Debbie Brown, intervention leads; Helen Collins, DeNDRoN net-work advisor. Trial Steering Committee (TSC): Professor Brian Lawlor, Chair; Angela Clayton Turner, lay member (PPI); Dr Jenny Freeman, independent member; Professor Sarah Lamb, non-independent mem-ber; Professor Paul McCrone, independent memmem-ber; Dr Bart Sheehan, non-independent member. Data Monitoring and Ethics Committee (DMEC): Professor Roy Jones, Chair; Professor Julian Hughes; Pro-fessor Patrick Phillips. Statistician: Dr Dipesh Mistry. Trial Team: War-wick University—N. Atherton, S. Bridgewater, E. Eyre, S. Finnegan, L. Hall, L. Hill, P. Hall, H. Johnson, G. Kaur, L. Langdon, J. Lowe, S. Mathews, J. Millichap, J. Nussbaum, I. On-kar, C. Ritchie, V. Rus-sell, G. Scott, S. Shore, A. Slowther, K. Spanjers, L. Stonehewer, M. Thorogood, J. Todd, A. Ullah, H. Waters, L. Woods, E. Withers, P. Zeh; University of Oxford—A. Bond, D. Brown, C. Byrne, R. McShane, H. Richmond, N. Thomas, J. Thompson. Research Sites Teams: Oxford Health FT—C. Dransfield, F. Le Frenais, C. Hall, O. Rye; Berkshire NHST—R. Carson, M. Clarke, H. Eaton, H. Ellis, A. Farrand, S. Gard-ner, C. Harducas, L. Rigby, J. Wilson; Black Country NHST—L. Hill, L. Johnson, L. Lord, L. Johnson, T. Qassam, S. Sadier, A. Shipman, L. South, J. Statham, J. Tomkins, D. Weaver; Coventry & Warwick-shire Partnership Trust—B. Coope, D. Craddock, A. Johal, J. Lee, J. Lindsay, J. Tucker, R. Vanderputt; Devon & Exeter NHST—V. Cross, G. Glithens-Mather, L. Martin, C. O’Reilly, E. Rogers, R. Sheridan; Greater Manchester West NHSFT—K. Birtwell, J. Brooke, A. Davis, C. Hinze, S. Hussain, A. Kennedy, H. Mistry, R. Noble, R. Norton, E. Oughton, V. Sherwin, P. Tinker; Leicester Partnership NHST—D. Glancey, H. Karrin, M. Marudkar; Northamptonshire NHSFT—G. Borley, T. Crisp, P. Koranteng, A. Lovesy, S. Vogel; North East Lon-don FT—B. Browne, L. Colbourn, A. Feast, E. Hanratty, R. Legerd, R. Niland-Smith, Theresa Sullivan, Tony Sullivan, A. Streater, H. St Roas; Solent NHST—M. Anderton, R. Blake, K. Brown, S. Marri-ott, S. Simpson, A. Thornhill; 2gether NHSFT (Gloucestershire & Herefordshire)—L. Colbourn, F. Dawe, T. Kuruvilla, L. Moore, R. Niland-Smith, M. Phillips, G. Riley, A. Uthup.
Author Contributions Dr Iftekhar Khan (Research Fellow, Health Economist): member of the Trial Management Group (TMG), respon-sible for the economic analysis of the trial, writing and reviewing of report. Prof Stavros Petrou (Professor of Health Economics, co-applicant): protocol development, member of the TMG, responsible for the economic analysis of the trial, writing and reviewing of report. Dr Dipesh Mistry (Research Fellow, Trial Statistician): member of the TMG, responsible for the statistical analysis of the trial, writing and reviewing of report. Kamran Khan (Research Associate, Health Economist): former member of the TMG, responsible for the economic analysis of the trial, writing and reviewing of report. Dr Ranjit Lall (Principal Research Fellow, co-applicant): developed the protocol, member of the TMG, responsible for the statistical analysis of the trial, writing and reviewing of report. Dr Bart Sheehan, (Consultant in Psychological Medicine): study design, clinical responsibility, writing and reviewing of report. Professor Sarah Lamb (Professor of Rehabili-tation, Chief Investigator): study conception and design, writing and reviewing of report.
Compliance with Ethical Standards
Conflict of Interest Dr Iftekhar Khan, Prof. Stavros Petrou, Mr Kam-ran Khan, Dr Dipesh Mistry, Dr Ranjit Lall, Dr Bart Sheehan and Prof. Sarah Lamb declare no conflicts of interest related to this study.
Funding The study was funded by the National Institute of Health Research (NIHR HTA [Health Technology Assessment] 09/80/04) and received additional support from the NIHR Local Clinical Research Networks and NIHR Oxford CLARHC (Collaboration for Leadership in Applied Health Research and Care) and Biomedical Research Cen-tre.
Ethical Approval and Informed Consent This study was approved by the UK institutional and national research ethics committee and has been performed in accordance with the ethical standards of the Decla-ration of Helsinki. Informed consent was obtained from all individual participants included in the study.
Data Availability Statement The datasets generated and/or analysed during the current study are available from the corresponding author on reasonable request.
Open Access This article is distributed under the terms of the Crea-tive Commons Attribution-NonCommercial 4.0 International License (http://creativecommons.org/licenses/by-nc/4.0/), which permits any noncommercial use, distribution, and reproduction in any medium, provided you give appropriate credit to the original author(s) and the source, provide a link to the Creative Commons license, and indicate if changes were made.
References
1. Rocca WA, Hofman A, Brayne C, Breteler MMB, Clarke M, Copeland JRM, et al. Frequency and distribution of Alzheimer’s disease in Europe: a collaborative study of 1980–1990 prevalence findings. Ann Neurol. 1991;30(3):381–90.
2. Rizzi L, Rosset I, Roriz-Cruz M. Global epidemiology of dementia: Alzheimer’s and vascular types. Biomed Res Int. 2014;2014:908915.
3. Matthews FE, Arthur A, Barnes LE, Bond J, Jagger C, Robinson L, et al. A two-decade comparison of prevalence of dementia in individuals aged 65 years and older from three geographical areas of England: results of the Cognitive Function and Ageing Study I and II. Lancet. 2013;382(9902):1405–12.
4. Wu Y-T, Fratiglioni L, Matthews FE, Lobo A, Breteler MMB, Skoog I, et al. Dementia in western Europe: epidemiological evidence and implications for policy making. Lancet Neurol. 2015;15(1):116–24.
5. Langa KM, Larson EB, Crimmins EM, Faul JD, Levine DA, Kabeto MU, et al. A comparison of the prevalence of dementia in the United States in 2000 and 2012. JAMA Intern Med. 2017;177(1):51–8. 6. Prince M, Wimo A, Guerchet M, Ali G-C, Wu Y-T, Prina M.
World Alzheimer Report 2015: the global impact of dementia: an analysis of prevalence, incidence, cost and trends. London: Alzheimer’s Disease International (ADI); 2015 Aug.
7. Hurd MD, Martorell P, Delavande A, Mullen KJ, Langa KM. Monetary costs of dementia in the United States. N Engl J Med. 2013;368:1326–34.
9. Jönsson L, Wimo A. The cost of dementia in Europe: a review of the evidence, and methodological considerations. Pharmacoeco-nomics. 2009;27(5):391–403.
10. Luengo-Fernandez R, Leal J, Gray A. Dementia 2010: the eco-nomic burden of dementia and associated research funding in the United Kingdom. Cambridge: Alzheimer’s Research Trust; 2010. 11. Prescription cost analysis—England, 2015. NHS Digital; 2015.
https ://digit al.nhs.uk/data-and-infor matio n/publi catio ns/stati stica l/presc ripti on-cost-analy sis/presc ripti on-cost-analy sis-engla nd-2015.
12. NICE. Donepezil, galantamine, rivastigmine and memantine for the treatment of Alzheimer’s disease. Technology appraisal TA217. NICE; 2011. https ://www.nice.org.uk/guida nce/ta217 / chapt er/4-Evide nce-and-inter preta tion.
13. Pfister B, Jonsson J, Gustafsson M. Drug-related problems and medication reviews among old people with dementia. BMC Phar-macol Toxicol. 2017;18(1):52.
14. Peninsula Technology Assessment Group (PenTAG), University of Exeter. The effectiveness and cost-effectiveness of donepezil, galantamine, rivastigmine and memantine for the treatment of Alzheimer’s disease (review of TA111): a systematic review and economic model. https ://www.nice.org.uk/guida nce/ta217 /docum ents/alzhe imers -disea se-donep ezil-galan tamin e-rivas tigmi ne-and-meman tine-revie w-asses sment -repor t-part-12. Accessed 29 Jul 2018.
15. Erickson KI, Prakash RS, Voss MW, Chaddock L, Hu L, Morris KS, et al. Aerobic fitness is associated with hippocampal volume in elderly humans. Hippocampus. 2009;19(10):1030–9. 16. Geda YE, Roberts RO, Knopman DS, Christianson TJH,
Pank-ratz VS, Ivnik RJ, et al. Physical exercise, aging, and mild cognitive impairment: a population-based study. Arch Neurol. 2010;67(1):80.
17. Etgen T, Sander D, Huntgeburth U, Poppert H, Forstl H, Bickel H. Physical activity and incident cognitive impairment in elderly per-sons; the INVADE study. Arch Intern Med. 2010;170(2):186–93. 18. Erickson KI, Kramer AF. Aerobic exercise effects on cogni-tive and neural plasticity in older adults. Br J Sports Med. 2009;43(1):22–4.
19. D’Amico F, Rehill A, Knapp M, Lowery D, Cerga-Pashoja A, Griffin M, et al. Cost-effectiveness of exercise as a therapy for behavioural and psychological symptoms of dementia within the EVIDEM-E randomised controlled trial. Int J Geriatr Psychiatry. 2016;31(6):656–65.
20. Vreugdenhil A, Cannell J, Davies A, Razay G. A community-based exercise programme to improve functional ability in people with Alzheimer’s disease: a randomized controlled trial. Scand J Caring Sci. 2012;26(1):12–9.
21. Lamb SE, Mistry D, Alleyne S, Atherton N, Brown D, Copsey B, on behalf of the DAPA Trial Group, et al. Aerobic and strength training exercise programme for cognitive impairment in people with mild to moderate dementia: the DAPA RCT. Health Technol Assess. 2018;22(28):1–202.
22. Lamb SE, Sheehan B, Atherton N, Nichols V, Collins H, Mistry D, on behalf of the DAPA Trial Investigators. Dementia And Physical
Activity (DAPA) trial of moderate to high intensity exercise train-ing for people with dementia: randomised controlled trial. BMJ. 2018;361:k1675.
23. NICE. Dementia: supporting people with dementia and their car-ers in health and social care. NICE clinical guideline CG42 [last updated 2016]. London: NICE; 2006.
24. Department of Health. Physical activity guidelines for adults (19-64 years) 2011. https ://www.gov.uk/gover nment /uploa ds/syste m/ uploa ds/attac hment _data/file/21374 0/dh_12814 5.pdf. Accessed 29 Jul 2018.
25. Department of Health. Physical activity guidelines for older adults (65 + years) 2011. https ://www.gov.uk/gover nment /uploa ds/syste m/uploa ds/attac hment _data/file/21374 1/dh_12814 6.pdf. Accessed 29 Jul 2018.
26. NICE. Guide to the methods of technology appraisal 2013; NICE Process and Methods Guides. London: NICE; 2013.
27. Beecham J, Knapp M. Costing psychiatric interventions. In: Thornicroft G, editor. Measuring mental health needs. London: Gaskell; 2001. p. 200–24.
28. Knapp M, King D, Romeo R, Adams J, Baldwin A, Ballard C, et al. Cost-effectiveness of donepezil and memantine in moder-ate to severe Alzheimer’s disease (the DOMINO-AD trial). Int J Geriatr Psychiatry. 2017;32(12):1205–16.
29. Curtis L, Burns A. Unit costs of health and social care 2015. Canterbury: Personal Social Services Research Unit, University of Kent; 2015.
30. Automobile Association (AA). Motoring costs 2014. London: Automobile Association; 2014.
31. Department for Transport. Public service vehicle survey: bus sta-tistics. London: Department for Transport; 2015.
32. Department of Health. NHS reference costs 2014–2015. London: Department of Health; 2014.
33. Purchasing power parities. http://eppi.ioe.ac.uk/costc onver sion/. Accessed 20 Oct 2017.
34. Dolan P. Modeling valuations for EuroQol health states. Med Care. 1997;35(11):1095–108.
35. Manca A, Hawkins N, Sculpher MJ. Estimating mean QALYs in trial-based cost-effectiveness analysis: the importance of control-ling for baseline utility. Health Econ. 2005;14(5):487–96. 36. White IR, Royston P, Wood AM. Multiple imputation using
chained equations: issues and guidance for practice. Stat Med. 2011;30(4):377–99.
37. Rubin DB. Multiple imputation for nonresponse in surveys. Hobo-ken: Wiley; 2004.
38. Graham JW, Olchowski AE, Gilreath TD. How many imputa-tions are really needed? Some practical clarificaimputa-tions of multiple imputation theory. Prev Sci. 2007;8(3):206–13.
Affiliations
Iftekhar Khan1,2 · Stavros Petrou1 · Kamran Khan1 · Dipesh Mistry1 · Ranjit Lall1 · Bart Sheehan3 · Sarah Lamb1,4,5 ·
on behalf of the DAPA Trial Group
1 Warwick Clinical Trials Unit, Warwick Medical School,
University of Warwick, Coventry, UK
2 King’s College London, University of London, London, UK
3 Oxford University Hospitals NHS Foundation Trust, Oxford,
UK
4 Nuffield Department of Orthopaedics, Rheumatology
and Musculoskeletal Sciences, Centre for Statistics in Medicine, University of Oxford, Oxford, UK
5 Nuffield Department of Orthopaedics, Rheumatology