Micro mechanics of isotropic normal compression
G. R. MCDOWELL*, J. P. DE BONO*, P. YUE* and H-S. YU*
Discrete element modelling has been used to investigate the micro mechanics of isotropic normal compression. One-dimensional (1D) normal compression has previously been modelled in three dimensions using an oedometer and a large number of particles and without the use of agglomerates, and it was shown that the compression index was solely related to the strengths of the particles as a function of size. The same procedure is used here to model isotropic normal compression. The fracture of a particle is governed by the octahedral shear stress within the particle (due to the multiple contacts) and a Weibull distribution of strengths. The octahedral shear stresses, due to local anisotropic stresses within a sample with isotropic boundary stresses, are shown to give rise to a normal compression line (NCL) and the evolution of a distribution of particle sizes. The compression line is parallel to the 1D NCL in log e–log p space, in agreement with traditional critical state soil mechanics and confirming that the compression index is solely a function of the size effect on average particle strength, which determines the hardening law for the material. The paper shows, for the first time, how local octahedral shear stresses induced in the particles within the sample generate an isotropic normal (clastic) compression line.
KEYWORDS: compressibility; discrete-element modelling; fractals; numerical modelling; particle crushing/ crushability; particle-scale behaviour
ICE Publishing: all rights reserved
NOTATION
b size effect on strength for a material
D fractal dimension
d particle size (diameter)
d0 initial particle size
e voids ratio
ey voids ratio corresponding to the yield stress on
the linear loge–logsplot
F force
F(c)j force at a contact
L particle size
m Weibull modulus
N number of particles
Nc number of contacts on a particle
p mean stress
q octahedral shear stress in a particle
qm mean octahedral shear stress
q0 value of octahedral shear stress such that 37% of
particles are stronger for a given particle size
V volume of a particle
xi(c) location of the contact
xi(p) location of the particle
s stress
sf tensile stress at failure
sij stress tensor for a particle
sm mean strength
s0 value of tensile stress such that 37% of particles
are stronger for a given particle size
s1 major principal stress in a particle
s2 intermediate principal stress in a particle
s3 minor principal stress in a particle
sy yield stress on the loge–logsplot
INTRODUCTION
Crushing has generally been modelled using the discrete element method (DEM) via the two alternative methods of
N
replacing ‘breaking’ grains with new, smaller fragments,generally in two-dimensions (A˚ stro¨m & Herrmann, 1998; Tsounguiet al., 1999; Lobo-Guerrero & Vallejo, 2005; Ben-Nun & Einav, 2010; Ben-Nunet al., 2010)
N
using three-dimensional (3D) agglomerates (McDowell & Harireche, 2002; Chenget al., 2003; Boltonet al., 2008). In the latter method, no consideration was given to the complex distribution of loads on each particle at its multiple contacts. This issue has recently been addressed by McDowell & de Bono (2013) who allowed particles to fracture without the use of agglomerates and by consider-ing the stresses induced in a particle due to the multiple contacts. McDowell & de Bono (2013) allowed each particle to split into new fragments, without loss of mass when the value of the induced particle stress was found to be greater than or equal to its strength. The new sphere fragments overlap enough to be contained within the bounding parent sphere (in the case of two fragments, for example, the axis joining the centres of the new spheres is aligned along the direction of the minor principal stress). This produces local pressure spikes during breakage; however, the overlap causes the fragments to move along the direction of the minor principal stress for the original particle, just as would occur for a single particle crushed between platens, and the excess energy is transferred to the surrounding particles. Although conservation of energy is not observed in this case, the goal was to achieve an effective breakage mechanism that was as simple and realistic as possible. As several authors (e.g. A˚ stro¨m & Herrmann, 1998) have conjectured, it is not possible to simulate perfectly realistic fracture using self-similar frag-ments. To ensure sample stability, McDowell & de Bono (2013) updated particle breakages at once (for the whole sample) after a minimum required number of computational Manuscript received 2 July 2013; first decision 16 August 2013;accepted 2 October 2013.
Published online at www.geotechniqueletters.com on 29 October 2013.
*University of Nottingham, Nottingham, UK
timesteps to allow the artificially induced energy to dissipate; full details can be found in McDowell & de Bono (2013).
The compression of sand is associated with the evolution of a particle size distribution; this has been linked in the past to work equations that account for the dissipation of energy via friction, the creation of surface resulting from breakage (e.g. McDowell & Bolton, 1998) and the redistribution of loads (e.g. Russell, 2011; Ovalle et al., 2013). Crushing during shearing has long been associated with the evolution offractalparticle size distributions (e.g. Turcotte, 1986; McDowell & Daniell, 2001), and both McDowell & Bolton (1998) and Russell (2011) linked the linear slope (ine–logsspace) of the normal compression line (NCL) to the theory of fractal crushing using their respective energy equations.
McDowell (2005) used the kinematics of particle fracture and the associated void collapse along with fractal crushing theory to show, analytically, that the one-dimensional (1D) NCL should actually be linear in loge–logsspace, which was validated by McDowell & de Bono (2013) who used the DEM to link the compression of sand to the evolution of a fractal distribution of particles. The influence of the mechanics of fracture on the slope of the NCL was thoroughly investigated, and is briefly described here, and the model therein applied to the isotropic compression of aggregates.
PARTICLE STRENGTHS
McDowell & Amon (2000) demonstrated that Weibull (1951) statistics can successfully be applied to the fracture of soil grains. It is widely accepted that the failure of a spherical particle under pure compression is tensile, and that fractures initiate from existing flaws and the associated stress concentrations. Assuming that failure of particles occurs by fast fracture under induced tensile stresses, McDowell & Amon (2000) obtained the survival prob-ability for a particle under diametral compression by integration of the probability function as a function of induced tensile stress over the volume of the particle under tension; they showed that the Weibull size effect is still valid for such loading, assuming that particles are similar in shape and are loaded in the same way. Jaeger (1967) proposed that the tensile strength of grains could be measured by diametral compression between flat platens as
sf~ F
d2 (1)
wheresfis the tensile stress at failure, Fis the diametral
compressive force applied by the platens and d is the diameter of the grain at failure. Using this equation, McDowell & Bolton (1998) reported that the tensile strengths obtained from single particles of various sizes crushed between flat platens could be related to size by
sm!db (2)
where sm is the mean strength and b describes the
size-hardening law (after Billam, 1972; Lee, 1992). Weibull distributions are described by two parameters – one defining the shape of the distribution, usually termed the Weibull modulus m, which is related directly to the coefficient of variation, and the other defining the scale, which is a characteristic value of the distribution such that 37% (i.e. exp(21)) of random variables are greater (in the case of particle strengths this determines the 37% survival probability), and is proportional to the mean. For a given 37% strength, increasing the Weibull modulus decreases the
variability in strengths. From Weibull’s survival probabil-ity for a block of material under tension, it is possible to derive the following relation
s0!d
{3=m (3)
wheres0 is the value of tensile stress at which 37% of the
total number of particles of size d survive and m is the Weibull modulus (assuming bulk fracture dominates and Weibull therefore gives a volume ‘effect’ on particle strength (McDowell & Bolton, 1998)). McDowell & Amon (2000) and McDowell (2002) confirmed that equation (3) could be applied to sand particles by single particle crushing tests.
In the two-dimensional models mentioned earlier, various fracture criteria were used; some authors used a measure of shear stress (e.g. Tsounguiet al., 1999; Lobo-Guerrero & Vallejo, 2005) while A˚ stro¨m & Herrmann (1998) and Ben-Nun & Einav (2010) additionally investi-gated using a measure of the compressive stress on a grain (although both reported that the final particle size distributions from their simulations were largely unaffected by the fracture criterion). Russellet al.(2009), on the other hand, presented an analysis of idealised, regular granular assemblies and suggested that the failure criterion for brittle materials is related to the maximum single contact force. In 3D work using agglomerates (e.g. Lim & McDowell, 2004; Boltonet al., 2008), although agglomer-ates could break under complex distributions of loads, no consideration was given to the stress induced by multiple contacts. McDowellet al. (1996) showed that, for fractal crushing, it is the coordination number that is the dominant factor influencing the probability of fracture for a particle (the likelihood of fracture increasing with reducing coordination number). McDowell & de Bono (2013) therefore decided that if a particle is loaded uniformly over its surface and is under a high hydrostatic stress but low deviatoric stress, it would be unlikely to break. They stated that it would therefore not be realistic to use the mean stress to establish whether a particle would break or not (or the maximum principal stress), as this would mean the fracture criterion would be unaffected even if the other principal stresses were of equal magnitude. They decided to use the average octahedral shear stress induced within each sphere to determine whether fracture should occur or not. The octahedral shear stress is derived from the average principal stresses within a particle and is given by
q~1
3 ðs1{s2Þ
2z
s2{s3
ð Þ3zðs1{s3Þ2
h i1=2
(4)
This means that if a particle is, for example under diametral point loads, equal in three mutually orthogonal directions, then the particle would not break under this hydrostatic stress (q 5 0). Although the stresses in a spherical particle vary as a function of position within the volume of the particle (e.g. Jaeger, 1967; Russell et al., 2009), the simplification of using the average octahedral shear stress provides a simple criterion to facilitate breakage, taking into account multiple contacts and different contact forces on a particle surface while avoiding the use of agglomerates. In this paper it will be shown that even for isotropic boundary stresses, local anisotropic stresses give rise to crushing, according to equation (4). In PFC3D (Itasca, 2005), the average stress tensor in a particle is
sij~
1
V X
Nc x c ð Þ i {x
p ð Þ i
whereVis the volume of the particle,Ncis the number of
contacts,xi(c)andxi(p)are the locations of the contact and particle respectively, ni(c,p) is the unit-normal vector directed from the particle centroid to the contact location andFj(c)is the force at the contact (Itasca, 2005). For the
case of a particle compressed diametrically between platens, the major principal stress is
s11~
1 p=6 ð Þd3F
d
22~ 6 p
F
d2 (6)
From equation (4), it can be seen that the value of octahedral shear stress q for a sphere compressed diametrically between two walls is then given by
q~2
1=2
3 6 p
F d2
~0:9F
d2 (7)
which is the value of qreturned by PFC3D for a sphere compressed between two walls; hence the average octahedral shear stress in a particle is proportional to equation (1). Therefore, McDowell & de Bono (2013) assumed that for particles loaded under multiple contacts, the particle would break if the octahedral shear stress was greater than or equal to its ‘strength’, where the strengths of the particles satisfy a Weibull distribution of q values and thus a size effect on 37% strength according to equation (3)
q0!d
{3=m (8)
ONE-DIMENSIONAL NORMAL COMPRESSION
McDowell & de Bono (2013) used a mono-disperse sample of 620 spheres of diameter 2 mm, created in a scaled-down oedometer (diameter 30 mm, height 7 mm). The sample was loaded one-dimensionally. Different strength charac-teristics, hardening laws and mechanisms of fracture were used to investigate their influence on the particle size distribution resulting from crushing and the slope of the NCL for the simulations. The initial sample was created using the radii expansion technique (Itasca, 2005), resulting in a dense, random packing that was subjected to a number of explicit time-stepping cycles to remove any locked-in forces or overlap. Using a larger sample with more particles appeared to give the same compression behaviour, but simulations were unable to reach high pressures due to the large number of particles covering such a wide range of scales. McDowell & de Bono (2013) investigated the initial characteristic strength of the particlesq0, the initial grading
(hence particle size), the fracture mechanism and the distribution of strengths (assuming that the size effect on average strength was governed separately) – all of which
had no influence on the compressibility index or the final particle size distributions. Most significantly, McDowell & de Bono (2013) examined a range of hardening laws and showed that if the mean particle strength qmis related to
sizedby a law of the form
qm!d
{b (9)
then 1D compression can be described by
loge~logey{
1 2blog
s sy
(10)
whereeyis the value on the linear log–log plot at a stress
corresponding to the yield stresssy, andsyis proportional
to the average particle strength. They showed that this was consistent with the evolution of a fractal distribution of particle sizes with a fractal dimension of 2?5 and that equation (10) holds irrespective of the distribution of strengths for a given size; for a given value ofbin equation (9), the distribution of strengths simply governs the rate of onset of yield onto the NCL.
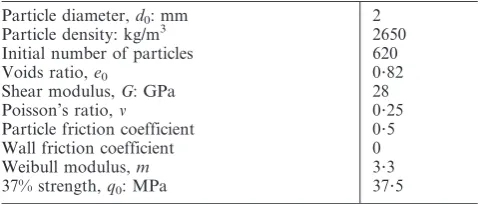
McDowell & de Bono (2013) modelled the 1D compression of silica sand studied earlier by McDowell (2002) using the parameters given in Table 1 and the simple splitting mechanism shown in Fig. 1; these are also used here for isotropic normal compression. The resulting 1D compression line is shown in Fig. 2, plotted on loge– log s axes. The slope is given by the size-hardening law and, in this case, from Table 1,b53/m53/3?3 according to equation (8), so the slope of the NCL is about 0?5, in agreement with the experimental data of McDowell (2002).
ISOTROPIC NORMAL COMPRESSION
The current study takes the same sample as in McDowell & de Bono (2013) and the same crushing criteria as in equation (4) to investigate
N
whether the localised anisotropic stresses within an [image:3.595.317.550.58.296.2]isotropically compressed sample would be sufficient to cause crushing and the development of an isotropic NCL
Table 1.DEM parameters for simulations of 1D and isotropic normal compression
Particle diameter,d0: mm 2
Particle density: kg/m3 2650
Initial number of particles 620
Voids ratio,e0 0?82
Shear modulus,G: GPa 28
Poisson’s ratio,n 0?25
Particle friction coefficient 0?5
Wall friction coefficient 0
Weibull modulus,m 3?3
37% strength,q0: MPa 37?5
1
1
[image:3.595.57.299.674.776.2]3 3
N
whether such a line might be parallel to the 1D NCLwhen the logarithm of voids ratio is plotted against the logarithm of mean effective stress
N
how high the required boundary stresses might be tocause crushing and normal compression.
The initial sample, identical to that used by McDowell & de Bono (2013), is shown in Fig. 3.
Figure 4 shows the NCL generated for the simulation of the isotropic compression test on silica sand. The NCL for the McDowell & de Bono (2013) 1D simulation is also shown in the same figure (in this case plotted against the logarithm of mean effective stress). It is clear that the isotropic NCL generated using the octahedral shear stress crushing criterion is parallel to the 1D NCL in loge–logp
space, and both lines have a slope of 0?5. This is reassuring and confirms the proposal made by McDowell & de Bono (2013) that the slope should be a function of the hardening
law for the size effect on particle strength, and this should be independent of the loading conditions. The yield stress for the isotropic sample is about 11 MPa, compared with about 8 MPa for the one-dimensionally compressed sample.
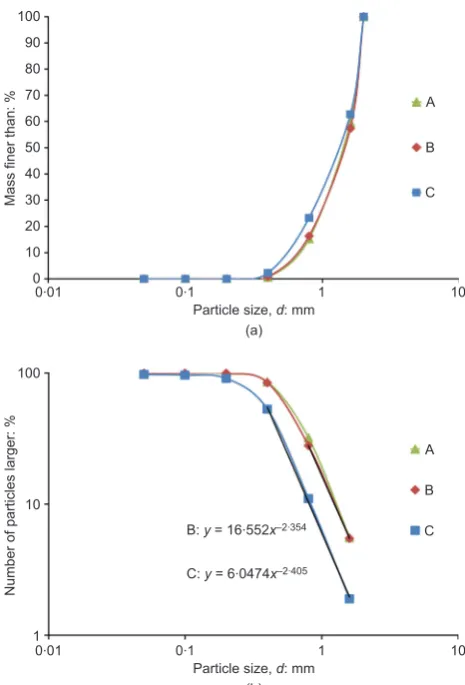
The evolution of the particle size distribution was also measured in terms of the percentage of mass of particles smaller than a given size plotted against the logarithm of
1.0
V
oids ratio,
e
V
o
ids ratio,
e
0.1
1.0
0.1
(a)
(b) Vertical stress, σ: MPa
Vertical stress, σ: MPa 10
10
1 100
100 y = 3279.9x–0.516
[image:4.595.45.277.61.423.2]1
[image:4.595.304.536.63.224.2]Fig. 2. Compression plots for silica sand: (a) from McDowell (2002); (b) from numerical simulation plotted on loge–log stress axes (McDowell & de Bono, 2013)
Fig. 3. Initial sample before compression
1.0
lsotropic
One-dimensional
V
oids ratio,
e
0.1
10 Mean stress, p: MPa
1 100
lsotropic NCL: y =2853.2x–0.505
One-dimensional NCL: y =2555.1x–0.506
Fig. 4. Isotropic normal compression and 1D normal compres-sion plots (on a log–log scale) for simulation on silica sand using the parameters in Table 1
90
80
70
60
50
40
30
20
10 100
Mass finer than: %
Number of particles larger: %
0
10 100
1
1 Particle size, d: mm
(a)
(b) 0.1
0.01 10
1 Particle size, d: mm 0.1
0.01 10
18 MPa
21 MPa
24 MPa
18 MPa 18 MPa: y = 40.488x–1.837
21 MPa: y = 16.552x–2.354
24 MPa: y = 8.8299x–2.451
21 MPa
[image:4.595.301.533.396.717.2]24 MPa
[image:4.595.42.283.666.759.2]that size, in the traditional way as shown in Fig. 5(a), and also by the percentage of number of particles greater than a given size plotted against size on a log–log scale (Fig. 5(b)). The equations shown in Fig. 5(b) are for the linear parts of the curves (i.e. the last two data points on each plot), and the exponent gives the fractal dimension assuming that the last two data points correspond to a fractal distribution such that
N Lð wdÞ!d{D (11)
whereNis the number of particles of size Lgreater than sized, andDis the fractal dimension (Turcotte, 1986). A fractal particle size distribution appears to emerge, with an ultimate fractal dimension of 2?5 approached as crushing occurs. This is further illustrated in Fig. 6, which shows
how the calculated fractal dimension evolves as the stress level is increased; it is consistent with the findings of McDowell & de Bono (2013) for 1D conditions.
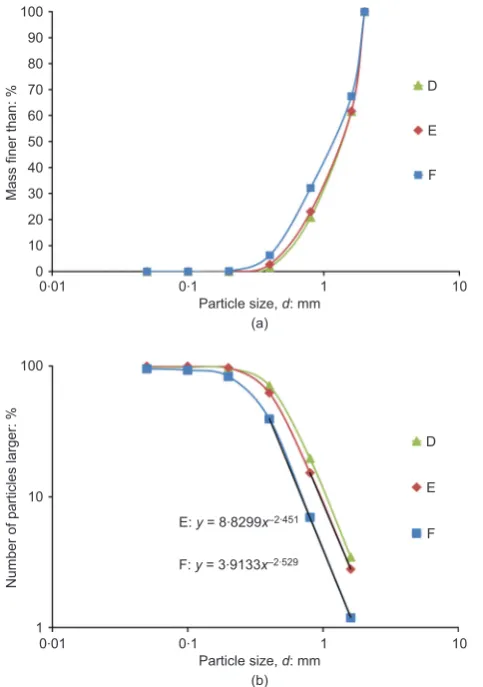
To gain further insight into the micro mechanics of isotropic compression and how it relates to the micro mechanics of 1D normal compression, it was decided to take a point (A) on the 1D NCL and a point (B) on the isotropic NCL at the same voids ratio and compare the particle size distributions. A further point (C) on the 1D NCL at the same mean effective stress as point B was also chosen to compare the particle size distribution with that at points A and B. These points are shown schematically in Fig. 7. This procedure was repeated for a further set of points, D, E and F (group 2), and all six data points are summarised in Table 2.
2.5
2.0
1.5
1.0
0.5 3.0
0
25 20
15 Mean stress, p: MPa
Dimension
D
of evoiving fractal
10 5
[image:5.595.316.549.56.399.2]0 30
Fig. 6. Fractal dimension D of the evolving particle size distribution (assuming the last two data points in Fig. 5 correspond to a fractal distribution)
A
D
C E
F
lsotropic NCL
One-dimensional NCL
Mean stress, p
V
oids ratio,
e
[image:5.595.61.300.59.211.2]B
[image:5.595.63.293.288.424.2]Fig. 7. Schematic diagram on log–log axes showing the two sets of data points (A, B, C and D, E, F) at which the particle size distributions are compared
Table 2.Data points chosen to compare the particle size distributions
Group 1 Group 2
Point A B C D E F
NCL 1D Isotropic 1D 1D Isotropic 1D
Voids
ratio,e
0?565 0?565 0?485 0?525 0?521 0?464
Mean
stress,p:
MPa
17?0 21?3 21?3 20?0 24?3 24?3
90
80
70
60
50
40
30
20
10 100
0
10 100
1
1 Particle size, d: mm
(a)
Mass finer than: %
Number of particles larger: %
0.1
0.01 10
1 Particle size, d: mm
(b) 0.1
0.01 10
A
B
C
C B: y = 16.552x–2.354
C: y = 6.0474x–2.405
B A
[image:5.595.58.559.678.777.2]Figure 8 shows the particle size distributions for the first set of data points A, B and C (group 1); the particle size distributions for D, E and F (group 2) are shown in Fig. 9. Both figures illustrate that the points at the same voids ratio on the 1D and isotropic NCLs (i.e. points A and B from group 1 and points D and E from group 2) have particle size distributions that appear to coincide. The distribution of non-zeroqvalues for all particles is shown for points A and B in Fig. 10(a) and for D and E in Fig. 10(b). Figure 10 demonstrates that when the particle distributions coincide (when the 1D and isotropic simula-tions reach the same voids ratio), the particles are approximately under the same distribution of local octahedral shear stresses – the distributions of octahedral shear stresses in the particles are similar for pairs A and B and D and E. The figures show that in the new simulations presented in this paper, despite the sample being loaded isotropically, significant local octahedral shear stresses are induced; these are what appear to give rise to crushing and produce the isotropic NCL, parallel to the 1D NCL and with similar particle size distributions at the same voids ratio. Further work will focus on the evolution of the particle size distribution under a wide range of stress paths.
CONCLUSIONS
Discrete element modelling has been used to investigate the micro mechanics of isotropic normal compression. The
fracture of a particle is governed by the average octahedral shear stress within the particle due to the multiple contacts and a Weibull distribution of strengths. The octahedral shear stresses, due to local anisotropic stresses within a sample with isotropic boundary stresses, have been shown to give rise to an isotropic NCL and the evolution of a distribution of particle sizes. The compression line is parallel to the 1D NCL in loge–logpspace, in agreement with traditional critical state soil mechanics and with a slope of 0?5 for the simulated silica sand, as proposed by McDowell (2005) and McDowell & de Bono (2013). This also reinforces the earlier proposition (McDowell & de Bono, 2013) that the compression index should be solely determined by the hardening law for the average particle strength as a function of size, and this should be independent of the loading configurations of the particles for different macroscopic stress ratios. It has therefore been shown – for the first time – how local octahedral shear stresses within an isotropically compressed sample generate an isotropic normal (clastic) compression line.
REFERENCES
A˚ stro¨m, J. A. & Herrmann, H. J. (1998). Fragmentation of grains
in a two-dimensional packing.Euro. Phys. J. B5, No. 3, 551–
554.
Ben-Nun, O. & Einav, I. (2010). The role of self-organization
during confined comminution of granular materials. Phil.
Trans. R. Soc. A368, No. 1910, 231–247.
Ben-Nun, O., Einav, I. & Tordesillas, A. (2010). Force attractor in
confined comminution of granular materials.Phys. Rev. Lett.
104, No. 10, 108001.
Billam, J. (1972). Some aspects of the behaviour of granular
materials at high pressures. In Proceedings of the Roscoe
90 80 70 60 50 40 30 20 10 100 0 10 100 1 1 Particle size, d: mm
Mass finer than: %
Number of particles larger: %
(a) D E F 0.1 0.01 10 D E F 1 Particle size, d: mm
(b) 0.1
E: y = 8.8299x–2.451
F: y = 3.9133x–2.529
[image:6.595.43.285.59.403.2]0.01 10
Fig. 9. Evolving particle size distributions for points D, E and F: (a) percent by mass of particles finer than sizedagainst sized on the traditional linear–log scale; (b) percent by number of particles greater than sizedagainst sizedon log–log axes
250 200 150 100 50 300 Frequency Frequency A B D E 0 9 × 10 7 8 × 10 7 7 × 10 7 6 × 10 7 5 × 10 7 4 × 10 7 3 × 10 7 2 × 10 7 1 × 10 7 5 × 10 6 0 0 1 × 10 8
Octahedral shear stress, q: MPa (a) 9 × 10 7 8 × 10 7 7 × 10 7 6 × 10 7 5 × 10 7 4 × 10 7 3 × 10 7 2 × 10 7 1 × 10 7 5 × 10 6 1 × 10 8
Octahedral shear stress, q: MPa (b) 250 200 150 100 50 300 0
[image:6.595.296.534.60.385.2]Memorial Symposium, Cambridge University (Parry, R. H. (ed.)). London: G. T. Foulis, pp. 69–80.
Bolton, M. D., Nakata, Y. & Cheng, Y. P. (2008). Micro- and macro-mechanical behaviour of DEM crushable materials. Ge´otechnique58, No. 6, 471–480.
Cheng, Y. P., Nakata, Y. & Bolton, M. D. (2003). Discrete
element simulation of crushable soil.Ge´otechnique53, No. 7,
633–641.
Itasca (2005). Particle flow code in three dimensions, software
manual. Minnesota, MN: Itasca Consulting Group Inc.
Jaeger, J. C. (1967). Failure of rocks under tensile conditions.Int.
J. Rock. Mech. Mining Sci.4, No. 2, 219–227.
Lee, D. M. (1992). The angles of friction of granular fills.
University of Cambridge.
Lim, W. L. & McDowell, G. R. (2005). Discrete element
modelling of railway ballast.Granular Matter7, No. 1, 19–
29.
Lobo-Guerrero, S. & Vallejo, L. E. (2005). Crushing a weak granular material: experimental numerical analyses. Ge´otechnique55, No. 3, 245–249.
McDowell, G. R. (2002). On the yielding and plastic compression
of sand.Soils and Found.42, No. 1, 139–145.
McDowell, G. R. (2005). A physical justification for loge–logs
based on fractal crushing and particle kinematics.Ge´otechnique
55, No. 9, 697–698.
McDowell, G. R. & Amon, A. (2000). The application of Weibull
statistics to the fracture of soil particles.Soils and Found.40,
No. 5, 133–141.
McDowell, G. & Bolton, M. D. (1998). On the micro mechanics of
crushable aggregates.Ge´otechnique48, No. 5, 667–679.
McDowell, G. R. & Daniell, C. M. (2001). Fractal compression of
soil.Ge´otechnique51, No. 2, 173–176.
McDowell, G. R. & de Bono, J. P. (2013). On the micro mechanics
of one-dimensional normal compression.Ge´otechnique63, No.
11, 895–908.
McDowell, G. & Harireche, O. (2002). Discrete element modelling
of soil particle fracture.Ge´otechnique52, No. 2, 131–135.
McDowell, G. R., Bolton, M. D. & Robertson, D. (1996). The
fractal crushing of granular materials.J. Mech. Phys. Solids44,
No. 12, 2079–2102.
Ovalle, C., Dano, C. & Hicher, P.-Y. (2013). Experimental data highlighting the role of surface fracture energy in quasi-static
confined comminution.Int. J. Fracture182, No. 1, 123–130.
Russell, A. R. (2011). A compression line for soils with evolving particle and pore size distributions due to particle crushing. Ge´otechnique Lett.1, No. 1, 5–9.
Russell, A. R., Muir Wood, D. & Kikumoto, M. (2009). Crushing
of particles in idealised granular assemblies. J. Mech. Phys.
Solids57, No. 8, 1293–1313.
Tsoungui, O., Vallet, D. & Charmet, J.-C. (1999). Numerical model of crushing of grains inside two-dimensional granular
materials.Powder Technol.105, No. 1, 190–198.
Turcotte, D. L. (1986). Fractals and fragmentation. J. Geophys.
Res.91, No. B2, 1921–1926.
Weibull, W. (1951). A statistical distribution function of wide
applicability.J. Appl. Mech.18, No. 3, 293–297.
WHAT DO YOU THINK?