Characterization and Transport of Contaminated Sediments in the Southern Central Lake Superior
Jaebong Jeong1* and S. Douglas McDowell2
1
Institute of Materials Processing
2
Geological and Mining Engineering & Sciences 1400 Townsend Dr. Houghton, MI 49931 *Corresponding author. Tel.: -906-487-2887
Fax: -906-487-2943 E-mail address: jjeong@mtu.edu
Three major source sediments were characterized and classified in terms of mineralogical and chemical composition in the west coastal area of the Keweenaw Peninsula. Bulk chemical analysis reveals that concentrations of Cu, Ag, Co, and As were enriched in metal rich mine tailings. SEM-EDS analysis indicates that the Ontonagon River sediments have high P and S concentrations. X-ray diffraction analysis of clay fraction shows that the mine tailings (chlorite rich) could be distinguished from the other two sources, Ontonagon River sediments (low chlorite and high illite) and Wisconsin red clay (low illite and high expandable phase). Local environmental conditions, including currents, bathymetry, weather conditions, and sediments texture, are important factors for cross-margin and longshore transport of contaminated sediments. The Keweenaw Current is responsible for the longshore transport of fine fraction of tailings, whereas wave action causes the lateral transport of the coarse deposits along the shore.
Key words: tracer, metal fingerprint, particle transport, and trace metal.
1. Introduction
A previous study of sedimentation in Lake Superior found that the major sources of sediments in depositional zones are coastal erosion and tributary inputs (Kemp et al., 1978a). However, this study found a discrepancy in the sediment budget for the lake; the sparse measurements of recent sedimentation rates were much lower than the estimates of sediment inputs. The study also was unable to link specific sediment sources with the sediments deposited in each depositional basin. An understanding of the transport behavior of the source materials within the lake could explain the discrepancy in the sediment budget for the lake. Sedimentation in each depositional basin is strongly related to the combined effects of localized inputs and physical processes (e.g., currents, wave action). The eastern basin sediments containing a relatively high content of SiO2 are derived from Ontario soils containing more illite, whereas the extreme western sediments derived from Manitoba, Canada contain more expandable clays (Dell, 1973; Forman and Brydon, 1961; Nussmann, 1965; Thomas and Dell, 1978). In the Keweenaw Peninsula region of Lake Superior, Wisconsin red clays from shoreline erosion (Kemp et al., 1978a), sediment loads from the Ontonagon and Bad Rivers (Auer and Gatzke, 2002; Kemp et al., 1978a; Robertson, 1997), and copper mine tailings (Babcock and Spiroff, 1970) are the major sources of sediments. Although these sources have been identified and quantified, the transport behavior and the fate of these materials in the lake are still unknown (Churchill et al., 2002).
Several different techniques have been applied for particle tracking to understand the biogeochemical cycling of nutrients, the fate of pollutants associated with particles, and sedimentation budgets in limnetic systems. In Lake Superior, hydrophobic organic contaminants such as PCBs and PAHs have been used as tracers of the dynamics and transport of organic particles in large lakes (Baker and Eisenreich, 1989). The elemental and isotopic compositions of suspended particles and sedimentary organic matter also have been used to study the origin and cycling of these materials (Ostrom et al., 1998). Even rare earth elements were applied as tracers to study sediment reworking and transport in the depositional basin (Krezoski, 1989). In addition, mineralogical and chemical compositions of particles and sediments have been used to identify sediment sources and to understand the impact of human activities on local environments. X-ray diffraction and Transmission Electron Microscopic studies of suspended particles and lake sediments identified mineralogical composition and particular minerals (asbestiform amphibole fibers) that could be used as fingerprints to classify sediment sources and track taconite tailings (Cook, 1975; Cook and Rubin, 1976; Dell, 1973). In the Keweenaw Peninsula region of Lake Superior, elevated concentrations of trace elements and high Cu/Zn ratios in sediments have been used as tools to determine the perturbation of local ecosystems by the tailings discharged from copper mining activities (Kemp et al., 1978b; Kerfoot et al., 1994; Kerfoot and Robbins, 1999; Kolak et al., 1998).
2. Methodology
2.1 Site description
The study site is located along the west coast of the Keweenaw Peninsula in the southern central basin of Lake Superior. Bathymetry in the area varies from a shallower western shoreline to a deeper northern shoreline, which has the effect of intensifying the water circulation pattern (Van Luven et al., 1999). The major source of fine-grained particles in the study area is the red clay from the Wisconsin shoreline (Figure 1). The second largest source is riverine inputs (Kemp et al., 1978a; Robertson, 1997). In addition to shoreline erosion and river loads, copper mine tailings from Freda, MI are also one of the major sources of sediments in the study area due to the discharge of over 45 million metric tons of crushed rocks directly into the lake (Babcock and Spiroff, 1970). The study area extends from the Ontonagon River to Copper Harbor, Michigan, the Keweenaw Peninsula region of Lake Superior. Five sampling transects were located at Ontonagon (ON Transect), near Freda and Redridge (FR), at the north entry of the Portage waterway (HN), at Eagle Harbor (EH), and at Copper Harbor (CH) (Figure 1). Transects run perpendicular to shore in a northward direction (305o ~ 350o), and each has several sampling stations.
2.2 Sample collection and preparation
Ontario
Ontario
Minnesota
Wisconsin Michigan
Lake Superior
Multicore Sampling Site (MCA2)
Ontonagon Sediment WI Red Clay
Freda Stamp sands
46.75 47.00 47.25 47.50 47.75
87.5 88.0
88.5 89.0
89.5
Longitude
Latitude
ON Transect
HN Transect
Ontonagon
Freda
FR Transect HarborEagle CopperHarbor
Redridge Keweenaw Peninsula
EH Transect CH Transect
46.75 47.00 47.25 47.50 47.75
87.5 88.0
88.5 89.0
89.5
Longitude
Latitude
ON Transect
HN Transect
Ontonagon
Freda
FR Transect HarborEagle CopperHarbor
Redridge Keweenaw Peninsula
EH Transect CH Transect
ON Transect
HN Transect
Ontonagon
Freda
FR Transect HarborEagle CopperHarbor
Redridge Keweenaw Peninsula
EH Transect CH Transect
Figure 1
2.3 Particle size, chemical, and mineralogical analyses
The grain size distribution of sediments was obtained using sieves and an X-ray particle analyzer. Four U.S Standard Sieves, 12-, 20-, 40-, 70-, and 100 mesh (1680-, 840-, 420-, 210-, and 149 µm respectively) were used with dry sediments to obtain coarse particle size distributions. The fine fraction (less than 149 µm) was analyzed with an X-ray particle analyzer (MICROTRACK II Model 7997-10, Leeds & Northrup). Each sample was analyzed twice, and the means were accurate within 5% of the particle size.
For mineralogical analysis, both air-dried and ethylene-glycol-treated clay-size particles were examined over a range of 2θ from 2o to 65o at a scanning rate of 1.00 Deg/min using a Cu Kα radiation. For individual particle analysis, the carbon-coated specimens were analyzed using an automated computer program (FeaturescanTM, Link Analytical) on a JOEL 35C SEM and a JOEL 8600 EMPA interfaced with an energy-dispersive spectrometer (EDS) system. Approximately 300 particles per sample were examined using both SEM and EMPA. Chemical microanalyses of individual particles were performed for the following elements: Na, Mg, Al, Si, S, K, Ca, Ti, Fe, and Cu. Using the chemical composition data for individual particles obtained from SEM and EMPA, two multivariate statistical analyses (linear discriminant analysis and logistic regression) were performed for the three source materials in order to identify the unique characteristics of each source. Statistical analyses were applied to both the large particles (<149
µm) analyzed with SEM and small particles (<2 µm) analyzed with EMPA using morphological and chemical variables.
Major elements such as Fe, Mg, Ca, Mn, Na, Si, and K in extracts from OSE were analyzed using an Inductively Coupled Plasma Emission Spectrometer (ICP, Leeman Labs Inc.). Trace elements (V, Co, Ni, Zn, As, Sr, Ag, Cd, Rb, Ba, Pb, and U) were analyzed using an Inductively Coupled Plasma Mass Spectrometer (ICP-MS, Perkin-Elmer Elan-6000, in Duluth, MN). Concentrations of total copper were measured using an Atomic Absorption Spectrophotometer (Perkin-Elmer Co., Model AAS 3100) in flame mode (3100 Automatic Burner Control). A NIST standard reference material (SRM 2704: Buffalo River Sediment) was digested and analyzed; the range of recovery was between 76% (Pb) and 89% (Co) total metal. The reproducibility of triplicate measurements for major and trace elements was generally better than 30%. For total copper analysis, OSE was applied to the NIST standard reference material (SRM 2704: Buffalo River Sediment) and yielded a recovery within 10% of the certified concentration of copper. The accuracy of copper standards was checked against a NIST standard reference material (SRM 3172a Multielement Mix B-1); standards were within 6 % of the certified standard. The procedural blank generally had a value lower than the detection limit.
3. Results
3.1 Sediment Grain Size
Table 1. Particle size distribution of three source sediments from tributary, and surface sediments and suspended particles from Lake Superior.
Tributary Lake Superior
Particle
Size Sources Surface Sediment Suspended
Particles6 Size\Site
Freda Stamp Sands1
Ontonagon River Sediments2
WI Red
Clay3 Nearshore
4 Offshor
e5 All
% Clay (<2 µm) 0.0 3.0 22.5 0.0 - 1.6 0.0 -
9.7 % Silt (2<X<60
µm) 46.5 89.2 77.5 0.0 -7 1.1
18.6 - 97.4 % Sand (> 60
µm) 53.5 7.8 0.0
27.4 - 100.0
0.0 - 81.4
Mean (µm)7 66.9 24.1 5.6 460.0 61.0 4.2-5.0
1) From Freda, MI and less then 200 mesh size particle (U.S. standard sieve). 2) From the river mouth, and less then 200 mesh size particle (U.S. standard sieve). 3) From the shoreline bluffs at the mouth of the Poplar River in northern Wisconsin. 4) Depth is shallower then 60 m.
5) Depth is deeper then 60 m.
6) Measured using Scanning Electron Microscopy. 7) Mass mean diameter
3.2 Mineralogical and chemical analyses
X-ray diffraction analyses of the source materials and Lake Superior sediments showed quartz, illite, chlorite, and smectite to be the dominant mineral components. Minor calcite is present in the Freda stamp sands and Wisconsin red clay, but not found in the Ontonagon River sediments. Lake Superior sediments generally do not contain calcite due to the undersaturation of carbonates in the lake water (Thompson, 1978). Smectite (montmorillonite), feldspar (microcline and albite), mica (muscovite), kaolinite, epidote, titanite, and augite, were found as minor minerals in some of the sediments. Several oxidized copper minerals (tenorite, malachite, and chalcopyrite) were found in the Freda stamp sands along with native copper.
0 200 400 600 800 1000 1200 1400
2 6 10 14 18 22 26 30
2 Theta
Intensity
Freda stamp sands Ontonagon clay Wisconsin red clay
Chlorite 1 Chlorite 2
Chlorite 3
Chlorite 4
Smectite
illite 1
illite 2
illite 3
Albite
Figure 2a
0 200 400 600 800 1000 1200 1400
2 6 10 14 18 22 26 30
2 Theta
Intensity
Table 2. Ratios of the relevant peaks for the source materials and lake sediments.
Peak Ratio 7 Sediment Classification
Chlorite Smectite
Smectite
I I
I
+ ISmectiteIlliteIIllite I
+ IIlliteChloriteIChlorite I
+
Freda Stamp Sands 0.08 0.72 0.82
Ontonagon Clay 0.30 0.60 0.61
Source Sediment
WI Red Clay 0.44 0.44 0.62
FR 0011 0.07 0.74 0.81
FR 0202 0.25 0.73 0.52
Near Freda Sediment
FR 0703 0.46 0.44 0.60
MCA-Pre4 0.20 0.75 0.57
MCA-Cu5 0.18 0.72 0.64
Near Copper Harbor Core Sample
MCA-BG6 0.49 0.45 0.56
1. Freda 001: 0.1 km away from shore in Freda Transect. 2. Freda 020: 2 km away from shore in Freda Transect. 3. Freda 007: 7 km away from shore in Freda Transect.
4. Surface sediment (0.5-1 cm) from the Multiple core station 2 (MCA in Figure 1). 5. Sediment (2.5-3 cm) from maximum Cu concentration in the Multiple core. 6. Background sediment (9-9.5 cm) in the Multiple core.
7. 2θ values for smectite, chlorite, and illite are 5.40, 6.35, and 9.00 respectively.
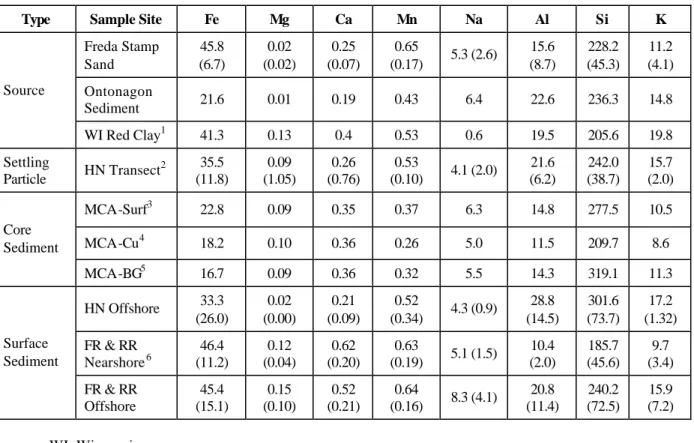
Sediments from the shore of Lake superior contain similar concentrations of the major elements because, with the exception of the mine tailings (Table 3), they have similar origins in the regionally distributed reddish brown or grayish postglacial surface sediments (Babcock and Spiroff, 1970; Laberge, 1994). Among the source materials, the Wisconsin red clays are distinctly lower in Na. The Freda stamp sands are generally similar to the other sediment sources, so that the major elements are not useful in tracking sediment movement in the lake. In general, all lake sediments are distinctly higher in V and Ni, and slightly higher in Pb, then any of the source materials (Table 4). This may reflect the highly refractory nature of the mineral phases containing the immobile trace elements, which tend to concentrate in the sediments during weathering. All sediments are similar in their Co, Zn, and As contents, including the Ontonagon and Wisconsin red clay sources, while the Freda stamp sands have distinctly higher concentrations of Co, Cu, As, and Ag.
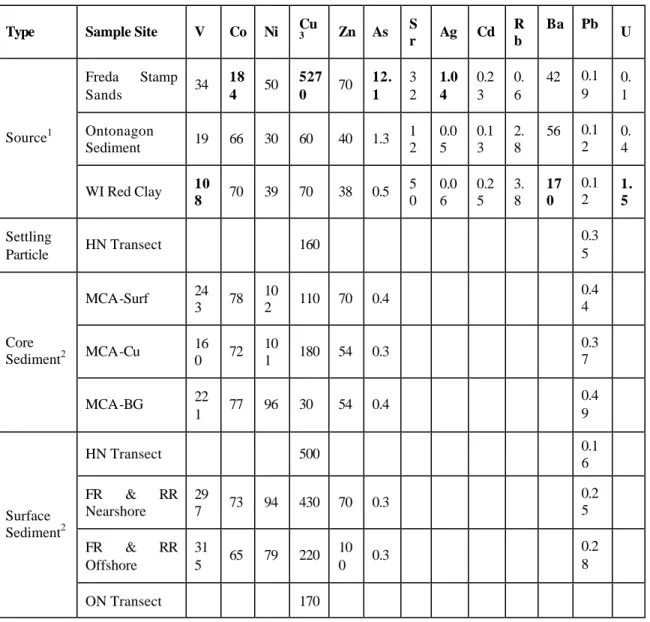
Copper concentrations in the sediment source materials and lake sediments have a clear pattern (Table 4). High total copper concentration was found in the Freda stamp sands (5270
pre-mining sediments of the core (MCA-BG) collected near Copper Harbor had the lowest concentration of copper (30 µg/g) found in the lake, but the sediments at the surface of this core had a relatively high concentration (110 µg/g). The maximum copper concentration (180 µg/g) in the core was found at 2 – 2.5 cm depth sediments, which are around 100 year old; this is thought to correspond to the maximum discharge of mine tailings in the Freda and Redridge areas during the copper mining activity from 1860 to 1960 (Babcock and Spiroff, 1970; Kerfoot et al., 1994). Overall, elevated copper concentrations were found at the surface and at 2.5 cm depth in the core as well as in settling particles on the HN transect, whereas the two non-mining sediment sources had copper concentrations similar to sediments below 5 cm in the core.
Table 3. Concentrations (mg/g) of major elements in sediments (Mean and standard deviation in parentheses).
Type Sample Site Fe Mg Ca Mn Na Al Si K
Freda Stamp Sand 45.8 (6.7) 0.02 (0.02) 0.25 (0.07) 0.65
(0.17) 5.3 (2.6)
15.6 (8.7) 228.2 (45.3) 11.2 (4.1) Ontonagon
Sediment 21.6 0.01 0.19 0.43 6.4 22.6 236.3 14.8
Source
WI Red Clay1 41.3 0.13 0.4 0.53 0.6 19.5 205.6 19.8
Settling
Particle HN Transect
2 35.5
(11.8) 0.09 (1.05) 0.26 (0.76) 0.53
(0.10) 4.1 (2.0)
21.6 (6.2) 242.0 (38.7) 15.7 (2.0)
MCA-Surf3 22.8 0.09 0.35 0.37 6.3 14.8 277.5 10.5
MCA-Cu4 18.2 0.10 0.36 0.26 5.0 11.5 209.7 8.6
Core Sediment
MCA-BG5 16.7 0.09 0.36 0.32 5.5 14.3 319.1 11.3
HN Offshore 33.3 (26.0) 0.02 (0.00) 0.21 (0.09) 0.52
(0.34) 4.3 (0.9)
28.8 (14.5) 301.6 (73.7) 17.2 (1.32) FR & RR
Nearshore6 46.4 (11.2) 0.12 (0.04) 0.62 (0.20) 0.63
(0.19) 5.1 (1.5)
10.4 (2.0) 185.7 (45.6) 9.7 (3.4) Surface Sediment
FR & RR Offshore 45.4 (15.1) 0.15 (0.10) 0.52 (0.21) 0.64
(0.16) 8.3 (4.1)
20.8 (11.4) 240.2 (72.5) 15.9 (7.2) 1. WI: Wisconsin.
2. HN: Houghton North.
3. MCA-Surf: Surface potion (0.5-1 cm) of multicore sediment.
4. MCA-Cu: Maximum Cu concentration portion (2.5-3 cm) of multicore sediment. 5. MCA-BG: Background portion (9-9.5 cm) of multicore sediment.
Table 4. Concentrations (µg/g) of trace elements in different sediments (Bolds represent extremely higher values among the three source materials).
Type Sample Site V Co Ni Cu3 Zn As Sr Ag Cd Rb Ba Pb U
Freda Stamp
Sands 34
18 4 50
527 0 70
12. 1 3 2 1.0 4 0.2 3 0. 6
42 0.1 9
0. 1 Ontonagon
Sediment 19 66 30 60 40 1.3
1 2 0.0 5 0.1 3 2. 8
56 0.1 2
0. 4 Source1
WI Red Clay 10
8 70 39 70 38 0.5
5 0 0.0 6 0.2 5 3. 8 17 0 0.1 2 1. 5 Settling
Particle HN Transect 160
0.3 5
MCA-Surf 24
3 78 10
2 110 70 0.4
0.4 4
MCA-Cu 16
0 72 10
1 180 54 0.3
0.3 7 Core
Sediment2
MCA-BG 22
1 77 96 30 54 0.4
0.4 9
HN Transect 500 0.1
6 FR & RR
Nearshore
29
7 73 94 430 70 0.3
0.2 5 FR & RR
Offshore
31
5 65 79 220 10 0 0.3
0.2 8 Surface
Sediment2
ON Transect 170
1) Concentrations of trace metals except Cu in sources were measured by ICPMS in Duluth.
3.3 Individual Particle Analysis
Distributions of the elements in the large and small particles from the three sediment sources are shown in Figure 3a and Figure 3b. The box plots show that most element concentrations are similar to one another in the large-particle source materials except for two elements (P and S). On this basis, Ontonagon River particles could be distinguished from the others because of their high P concentration, low S concentration, and higher ratio of Mg/Al. Unlike the large particles, there are no significant differences in morphological or element concentrations in the small particles from the three sources. The finer particles are noticeably higher in Al, S, and slightly higher in Si, K, and Cu, then the coarser particles. This may reflect in part a higher concentration of layer silicate minerals in the finer fraction.
Freda Onto WI Red 0 10 20 30 40 50
Freda Onto WI Red 0
50 100 150 200
Freda Onto WI Red 0 100 200 300 400 500
Freda Onto WI Red 0
1000 2000 3000 4000
Freda Onto WI Red 0 1000 2000 3000 4000 5000
Freda Onto WI Red 0
50 100 150 200
Freda Onto WI Red 0 100 200 300 400 500 600
Freda Onto WI Red 0
500 1000 1500 2000
Freda Onto WI Red 0 100 200 300 400 500 600 700 800 900 1000
Freda Onto WI Red 0
1000 2000 3000
Freda Onto WI Red 0
100 200 300
Freda Onto Wi Red 0 10 20 30 40
Freda Onto Wi Red 0 2 4 6 8 10 12
Freda Onto Wi Red 0 10 20 30 40 50
Freda Onto Wi Red 0
50 100 150
Freda Onto Wi Red 0
1 0 0 2 0 0 3 0 0 4 0 0 5 0 0 6 0 0
Freda Onto Wi Red 0 1000 2000 3000 4000 5000 6000 7000
Freda Onto Wi Red 200 300 400 500 600 700
Freda Onto Wi Red 0
1000 2000 3000
Freda Onto Wi Red 0
1000 2000 3000 4000
Freda Onto Wi Red 0
1000 2000 3000
Freda Onto Wi Red 0
1000 2000 3000 4000
Freda Onto Wi Red 0 100 200 300 400 500 Mg Na K Si S Length Area
Ca Ti Fe Cu
Al
Counts
Figure 3b
The two multivariate statistical analyses (linear discriminant analysis and logistic regression) of the chemical composition data obtained from SEM and EMPA provided similar results for particle classification in both small- and large-particle portions. For identification of small particles, more than half of those in each source group are misclassified in both statistical analyses. However, when applied to the large particle measurements, both statistical techniques classified the particles correctly 60 to 70% of the Freda stamp sands and the Wisconsin red clay, and more than 99% of the Ontonagon River sediments. The relative importance of variables was also determined by the F-to-remove (F) statistics in the discriminant analysis and the odds ratio in the logistic regression model. For the statistical analyses of the large particles, the order of group differences is S > P >> Cu >>> K > Al > Mg > Na in the discriminant analysis, whereas the orders of significance of individual parameters are Cu > Na > S > Mg> Ca > Al = Si > K for the Freda group against Wisconsin red clay group and Na > Mg> K > Ca > Si > Cu > S > Al for the Freda group against Ontonagon sediment group in the logistic regression model.
4. Discussion
4.1 Characterization of source particles
the phosphorus loading in lake sediments from glacial debris or metamorphic terrains (Reid et al., 1980). Mixing of riverine with marine sediments has been explained by different mineralogical composition of clay minerals (Chamley, 1989). In a similar fashion, mineralogical fingerprints of mine tailings were employed as tools to explore the dynamics and transport of particle and sediments associated with local environments in this study.
The geologic history of the southern coast of Lake Superior resulted in mineralogically similar sources of lacustrine sediments to the lake (Heinrich, 1976; Laberge, 1994). The red clays from northern Wisconsin bluffs and the Ontonagon River sediments are glacial lacustrine sediment derived both from older clastic sediments within the Lake superior trough, and from the weathering of nearby basaltic volcanics. The mine tailings discharged in Freda, as a result of copper mining activities, are amygdaloidal basalts (Babcock and Spiroff, 1970). X-ray diffraction analyses for the major mineral phases reveals similar minerals but different mineral proportions among the source materials and lake sediments. The copper minerals (tenorite, malachite, and chalcopyrite) identified by X-ray diffraction analysis could not be used for differentiation of tailings from non-mining sediments due to trace amounts compared to major minerals. However, the clay mineralogy of the fine particle fraction indicated that the mineral composition of each sediment source was unique and could be used to discriminate them from one another (Figure 4). The relative abundances of illite, smectite, and chlorite for the three different sources and the lake sediments can be used to characterize the sources and classify the lake sediments. The stamp sands are clearly distinguished from the others by relatively low smectite and high chlorite levels, whereas different proportions of illite and smectite distinguished the Ontonagon River sediments from the Wisconsin red clays.
Bulk chemical compositions (Table 3) of the three source materials differ only slightly for some major elements. However, ratios of refractory and mobile elements are a more powerful tool for characterizing the sources. Ontonagon River sediments are more clearly discriminated from the others with respect to ratios of refractory (Al and Si) and mobile elements (K, Mn, Ca, and Mg) due to higher aluminum and lower calcium and magnesium (Figure 5a). On the other hand, high ratios of cations:Si and K:Na in Wisconsin red clay discriminated this material from other source materials. Major elements and their ratios can be used to develop strong fingerprints for the three source materials having different origins and undergoing different weathering processes.
Frequently, high concentrations of trace metals in sediments are a result of mining activity (Dassenakis et al., 1995). In this study, large differences in the abundance of trace metals were found in the three source sediments (Figure 5b); total concentrations of trace metals such as Cu, Ag, and As in Freda stamp sands were from 10 to 100 times higher than concentrations in the other source materials. This was consistent with previous research that had shown that mine tailings in the study area were clearly different from normal lake sediments with respect to high levels of trace metals (Jeong et al., 1999; Kemp et al., 1978b; Kerfoot et al., 1994).
1.0E-01 1.0E+00 1.0E+01 1.0E+02 1.0E+03 1.0E+04
(Al+Si)/(Fe+Mn) (Al+Si+K)/(Ca+Mg) (Ca+Mg+Na)/Si K/Na
Concentration (mg/g)
Freda Stamp Sands Ontonagon Clay WI Red Clay
Figure 5a
1.E-02 1.E-01 1.E+00 1.E+01 1.E+02 1.E+03 1.E+04
C u Co Zn Pb As V Ni Sr Rb Ba U Ga Cd Ag
Log [Concentration] (ug/g)
Freda Stamp Sands Onto Sediment WI Red Clay
For individual particle analyses, the multivariate statistical analyses of major element concentrations in fine particles of the source materials failed to discriminate one source from another due to the similarity of the chemical composition of the source materials. However, analysis of large particles (<200 µm) by SEM-EDS coupled with multivariate statistical analysis succeeded in identifying Ontonagon River particles in almost 100% of cases (Figure 6). This result was consistent with the bulk chemical analysis for major chemical elements that showed that the Ontonagon River sediments could be identified by a high ratio of (Al+Si):(Fe+Mn), while the other two source materials were similar (Figure 5a). The results imply that EMPA-EDS was not an appropriate technique to obtain valuable chemical composition data to classify the fine fraction of particles. Nevertheless, this technique could be used as an auxiliary tool to verify the particle classifications obtained from bulk chemical analysis.
-6 -2 2 6 10
FACTOR(1) -6
-2 2 6 10
FACTOR(2)
WI Red Clay Onto Sediment Freda SS
-6 -2 2 6 10
FACTOR(1) -6
-2 2 6 10
FACTOR(2)
WI Red Clay Onto Sediment Freda SS
-6 -2 2 6 10
FACTOR(1) -6
-2 2 6 10
FACTOR(2)
WI Red Clay Onto Sediment Freda SS
-6 -2 2 6 10
FACTOR(1) -6
-2 2 6 10
FACTOR(2)
-6 -2 2 6 10
FACTOR(1) -6
-2 2 6 10
FACTOR(2)
WI Red Clay Onto Sediment Freda SS
Figure 6
Table 5. Comparison of characteristic of the three different source materials in the study area. Source Analytical Method Target Particle Informati on Freda Stamp Sands Ontonagon River Sediments Wisconsin Red Clays U.S. Standard Sieve1 & MICROTRA CK2 Whole sample Texture of sediment Sand and Silt Silt
Silt and Clay Large particles7 Major mineral compositi on Calcite with copper minerals
No Calcite Calcite
X-ray diffraction Small particles8 Clay mineral compositi on More chlorite with less smectite
More illite with less chlorite
More smectite with less illite
OSE3/AAS Large
particles Total Cu High Low Low
OSE3/ICP & ICP-MS Large particles Major and trace elements High trace elements (Pb, Co, Ag, As)
High Al and Si with low Ca, Mg, and low trace elements (Pb, Co, Ag, As)
Low Na with low trace elements (Pb, Co, Ag, As) EMPA/EDS4 with Statistical Analysis Small particles Chemical compositi on
No trend No trend No trend
SEM-EDS5 with Statistical Analysis Large particles Chemical compositi on
High S and Al with low P, Na, and Mg
High P, Na, and Mg with low S and Al
High S and Al with low P, Na, and Mg
1. U.S. standard sieve: Four sieves with 12, 20, 40, 70, and 100 mesh 2. MICROTRACK: an X-ray particle size analyzer
3. OSE/AAS: One step extraction with Atomic Absorption Spectrophotometer
4. EMPA-EDS: Electron Microprobe Analyzer with an Energy-Dispersive Spectrometer 5. SEM-EDS: Scanning Electron Microscopy with an Energy-Dispersive Spectrometer 6. Radioisotope: U-235, U-248, and K-40 series
7. Large particle: Less than 200 µm size particles
4.2. Movement of copper-rich sediments
Mineralogical and chemical fingerprints of three source materials were applied to examine transport of copper-rich sediments in the study area. The copper distribution map clearly shows that high concentrations of copper exist between Freda-Redridge and the North Entry (Figure 7a). The high copper concentrations in the nearshore area of Freda-Redridge are a direct result of copper mine activity during the period 1895 ~ 1964 (Babcock and Spiroff, 1970; Kerfoot et al., 1994). About 46 × 106 metric tons of stamp sands were dumped on the shore at Freda-Redridge during this period. The original deposits of stamp sands have been reworked by waves and wind-driven coastal currents and moved northeast toward the HN transect (Wright et al., 1975; Wright et al., 1973). Comparison of the surface sediment copper distribution pattern observed in this study with the pattern observed 25 years ago (Kraft, 1979) showed a general similarity. However, concentrations of copper near the HN transect have increased, and the copper has shifted toward the offshore regions. The coarse copper-rich sediments follow bathymetric contours and reflect a general pathway of longshore sediment transport.
Figure 7a
Figure 7c
0
5
10
15
20
25
0.0 1.0 2.0 3.0 4.0
[Cu], [C:N]/10 (molar), NMD (um), [Alb/Chl]
Depth (m) [Cu] (mmol/g Sed
[C:N]/10, (molar)
Particle Size (NMD, um)
[Alb/Chl] ratio in XRD
Although northeastward long-shore transport is a dominant process, cross-margin transport also occurred in the study area as indicated by high copper concentrations in suspended sediment along the HN transect (Figure 9). Cross-margin transport of the copper-rich coarse deposits near the HN transect was caused by the transition in bathymetry in conjunction with storms. The deposited copper-rich sediments in the coastal area are continuously re-suspended by the waves in the high-energy environments and subjected to sorting with depth. As a result, nearshore/offshore gradients in concentrations of copper in the surface sediments were found in the study area. A mixing of the locally derived copper-rich sediments with lake sediments resulted in concentrations of copper observed in the near- and offshore sediments (Figure 9) which are lower than the typical values observed in the stamp sands from the Keweenaw Peninsula (Jeong et al., 1999), but higher than Ontonagon sediments and Wisconsin red clay. The copper concentrations of both of the latter are close to the typical values of soils and sediments not contaminated by mining activity (Friedland et al., 1984; Ge et al., 2000; McLaren and Crawford, 1973; Tessier et al., 1979). Despite the potential mobilization of copper in aquatic systems, gradients or concentrations of total copper in sediments will provide an excellent tool for investigation of the movements of the copper-rich particles and sediments in the study area (Kerfoot et al., 1994; Kerfoot and Nriagu, 1999; Kerfoot et al., 1999; Mckee et al., 1989).
0.0
0.5
1.0
1.5
[Cu] (mg/g)
7.06 mg/g
Freda Sources
Settling Particles (HN transect)
Cores (Near Copper Harbor)
ON & WI Sources
@ Cu Peak
@ Backgroud Under Water Sample
@ Surface
0.0
0.5
1.0
1.5
[Cu] (mg/g)
7.06 mg/g
Freda Sources
Settling Particles (HN transect)
Cores (Near Copper Harbor)
ON & WI Sources
@ Cu Peak
@ Backgroud Under Water Sample
@ Surface
Figure 9
5. Conclusions
Northwest Wisconsin (low chlorite, high expandable phase). Major elements were not very useful in distinguishing among the various sources, although the Wisconsin sediments were unusually sodium- poor, and some differentiation could be made using mobile/immobile element ratios. Analysis of coarser particles via SEM-EDS produced generally similar results for all samples, except sediments from the Ontonagon River had distinctively higher P and lower S concentrations. Electron microprobe analysis of particles was not informative. However relative to the larger particles, the smaller particles tended to be higher in Al and S. Multivariate statistical analysis of the particle chemistry also supported the uniqueness of the Ontonagon River sediments.
Distribution of copper and signatures of minerals in nearshore sediments indicate that metal-rich mine tailings are introduced into the coastal area. They moved into deep basins and mixed with normal sediments in the lake via longshore and cross-margin transport. Longshore and cross-margin transport of suspended particles and sediment in coastal areas are strongly related to local environmental factors. Finally, particle size analysis was very important in transport studies. Waves and bathymetry played major roles for longshore and cross-margin transport of the coarse and heavy particles in the FR transect and near the HN Entry area. Longshore transport of fine particles in conjunction with the Keweenaw current flowing northeastward was predominant in the study area. In addition, vertical profiles of particle size, copper, C:N ratios, and clay mineral ratios in the core sample taken near Copper Harbor gave strong evidence of the long-range transport of the fine fraction of mine tailings. Thus, there would be a high potential to contaminate the remote area of the lake by the metal-rich mine tailings.
Acknowledgments
We would like to express our appreciation to the captain and crew of the R/V Laurentian operated by University of Michigan and Blue Heron operated by University of Minnesota for their assistance in field sampling. The research was supported in part by a fellowship from Michigan Technological University and from the Keweenaw Interdisciplinary Transport Experiment in Superior (KITES) project supported by National Science Foundation (NSF) award number OCE-9712872.
References
Auer, M.T. and Gatzke, T.L., 2002. Cross margin transport and the timing of the spring runoff event anf thermal bar formation in Lake Superior. Journal of Great Lakes Research in press.
Babcock, L.L. and Spiroff, K., 1970. Recovery of copper from Michigan stamp sands: Vol. 1 Mine and mill origin, sampling and mineralogy of stamp sands, Inst. Mineral Res., Michigan Technoloogical University.
Baker, J.E. and Eisenreich, S.J., 1989. PCBS and PAHS as tracers of particulate dynamics in large lakes. Journal of Great Lakes Research 15(1), 84-103.
Brassard, P. and Morris, W., 1997. Resuspension and redistribution of sediments in Hamilton Harbour. Journal of Great Lakes Research 23(1), 74-85.
Budd, J., Kerfoot, C.W., Pilant, A. and Jipping, L.M., 1999. The Keweenaw Current and ice rafting: use of satellite imagery to investigate copper-rich particle dispersal. Journal of Great Lakes Research 25(4), 642-662.
Chamley, H., 1989. Clay Sedimentology, Springer-Verlag Inc., New York.
Churchill, J.H., Ralph, E.A., Cates, A.M., Budd, J.W. and Urban, N.R., 2002. Observations of a negatively buoyant river plume in a large lake. Journal of Great Lakes Research in press.
Colman, S.M. and Foster, D.S., 1994. A sediment budget for southern Lake Michigan: Source and sink models for different time intervals. Journal of Great Lakes Research 20(1), 215-228.
Cook, P.M., 1974. Asbestiform amphibole minerals: Detection and measurement of high concentrations in municipal water supplies. Science 185, 853-855.
Cook, P.M., 1975. Semi-quantitative determination of asbestiform amphibole mineral concentrations in Western Lake Sueprior water samples. In: W.L. Pickles, C.S. Barrett, J.B. Newkirk and C.O. Ruud (Editors), Advances in X-ray Anlysis. Plenum Publishing Co., New York, 557-567.
Cook, P.M. and Rubin, I.B., 1976. X-ray diffraction and electron beam analysis of asbestiform minerals in Lake Supeiror waters. Annals no. 75CH1004-I 34-1, The Institute of Electrical and Electronics Engineers, Inc., U.S.A.
Dassenakis, M., Degaita, A. and Scoullos, M., 1995. Trace metals in sediments of a Mediterranean estuary affected by human activities. Sci. Total Environ. 168, 19-35.
Dell, C.I., 1973. A quantitative meneralogical examination of the clay-size fraction of Lake Superior sediments. proc. 16th conf. Great Lakes Res., 413-420.
Forman, S.A. and Brydon, J.E., 1961. Clay mineralogy of Canadian soils. In: R.F. Legget (Editor), Soils in Canada. University of Toronto Press, Toronto, 140-146.
Friedland, A.J., Johnson, A.H. and Siccama, T.G., 1984. Trace metal content of the forest floor in the Green Mountains of Vermont: spatial and temporal patterns. Water Air Soil Pollut. 21, 161-170.
Gutierrez, M.J.M., Achab, M., Sanchez, A., Morel, J.P. and Aguayo, F., 1996. Clay minerals in recent sediments of the Cadiz Bay and their relationships with the adjacent lands and the continental shelf. Advances in clay minerals.
Hawley, N., 2000. Sediment resuspension near the Keweenaw Peninsula, Lake Superior during the fall and winter 1990-1991. Journal of Great Lakes Research 26(4), 495-505.
Hawley, N., Wang, X., Brownawell, B. and Flood, R., 1996. Resuspension of bottom sediments in Lake Ontario during the unstratified period, 1992-1993. Journal of Great Lakes Research 22(3), 707-721.
Heinrich, E.W., 1976. The Mineralogy of Michigan. Speaker-Hines and Thomas, Inc., Lansing, Michigan.
Honeyman, B.D. and Santsch, P.H., 1989. A Brownian-pumping model for oceanic trace metal scavenging: Evidence from Th isotopes. Journal of Marine Research 47, 951-992.
Hughes, J.D., Farrell, J.P. and Monahan, E.C., 1970. Drift-bottle study of the surface currents of Lake Superior. Michigan Academician 2(4), 25-31.
Jeong, J., Urban, N.R. and Green, S.A., 1999. Release of copper from mine tailings on the Keweenaw Peninsula. Journal of Great Lakes Research 25(4), 721-734.
Kemp, A.L.W., Dell, C.I. and Harper, N.S., 1978a. Sedimentation rates and a sediment budget for Lake Superior. Journal of Great Lakes Research 4(3-4), 276-287.
Kemp, A.L.W., Williamson, J.D.H., Thomas, R.L. and Gregory, M.L., 1978b. Impact of man's activities on the chemical composition of the sediment of Lake Superior and Huron. Water, Air, And Soil Pollution 10, 381-402.
Kennedy, A.D., 1970. Recovery of copper from Michigan stamp sands: Vol. II Physical and chemical properties of stamp sands. U.S. Bureau of Mines Project G0180241(SWD-18), Institute of Mineral Research, Michnigan Tecnological University, Houghton.
Kerfoot, W.C., Lauster, G. and Robbins, J.A., 1994. Paleolimnological study of copper mining around Lake Superior, Artificial varves from Portage Lake provide a high resolution record. Limnology and Oceanography 39(3), 649-669.
Kerfoot, W.C. and Nriagu, J.O., 1999. Copper mining, copper cycling and mercury in the Lake Superior ecosystem: An introduction. Journal of Great Lakes Research 25(4), 594-598.
Kerfoot, W.C. and Robbins, J.A., 1999. Nearshore regions of Lake Superior: Multi-element signatures of mining discharges and a test of Pb-210 deposition under conditions of variable sediment mass flux. Journal of Great Lakes Research 25(4), 697-720.
Klump, J.V. et al., 1989. Variations in sediment acculation rates and the flux of labile organic matter in eastern Lake Superior basins. Journal of Great Lakes Research 15(1), 104-122.
Kolak, J.J., Long, D.T., Beals, T.M., Eisenreich, S.J. and Swackhamer, D.L., 1998. Anthropogenic inventories and historical and present accumulation rates of copper in Great Lakes sediments. Applied Geochemistry 13, 59-75.
Kraft, K.J., 1979. Pontoporeia distribution along the Keweenaw shore of Lake Supeiror affected by copper tailings. Journal of Great Lakes Research 5(1), 28-35.
Krezoski, J.R., 1989. Sediment reworking and transport in Eastern Lake Superior: In situ rare earth element tracer studies. Journal of Great Lakes Research 15(1), 26-33.
Laberge, G.L., 1994. Geology of the Lake Superior region. Geoscience press Inc., Phoenix, Arizona.
Lien, S.L., 1973. Circulation patterns in Lake Superior. Ph. D. Thesis, University of Wisconsin.
Lion, L.W., Altmann, R. and Leckie, J.O., 1982. Trace-metal adsorption characteristics of estuarine particulate matter: evaluation of contributions of Fe/Mn oxide and organic surface coatings", Environ. Sci. Technol., 16(10): 660-666. Environmental Science and Technology 16(10), 660-666.
Martin, J.-M., Dai, M.-H. and Cauwet, G., 1995. Significance of colloids in the biogeochemical cycling of organic carbon and trace metals in the Venice Lagoon (Italy). Limnology and Oceanography 40(1), 119-131.
Mckee, J.D., Wilson, T.P., Long, D.T. and Owen, R.M., 1989. Pore water profiles and early diagenesis of Mn, Cu, and Pb in sediments from large lakes. Journal of Great Lakes Research 15(1), 68-83.
McLaren, R.M. and Crawford, D.V., 1973. Studies on soil copper, I. The fractionation of copper in soils. Journal of Soil Science 24, 173-181.
Morel, F.M.M. and Hudson, J.M., 1985. Chapter 12. The geobiological cycle of trace elements in aquatic system: Redfield revisited. In: W. Stumm (Editor), Chemical Processes in Lakes. John Wiley & Sons, New York.
Nussmann, D.G., 1965. Trace elements in the sediments of Lake Superior. Ph. D. Thesis, University of Michigan, Ann Arbor.
Ostrom, N.E., Long, D.T., Bell, E.M. and Beals, T., 1998. The origin and cycling of particulate and sedimentary organic matter and nitrate in Lake Superior. Chemical Geology 152, 13-28.
Ribolzi, O., Valles, V., Gomez, L. and Voltz, M., 2002. Speciation and orgin of particulate copper in runoff water from a Mediterranean vineyard catchment. Environmental Pollution 117(2), 261-271.
Robertson, D.M., 1997. Regionalized loads of suspended sediment and phosphorus to Lake Michigan and Superior-High flow and long-term average. Journal of Great Lakes Research 23(4), 416-439.
Rossmann, R. and Seibel, E., 1977. Surficial sediment redistribution by wave energy: Element-grain size relationships. Journal of Great Lakes Research 3(3-4), 258-262.
Sigg, L., 1985. Metal transfer mechanisms in lakes; the role of settling particles. In: W. Stumm (Editor), Chemical Processes in Lakes. John Wiley & Sons, New York, 283-310.
Stumm, W. and Morgan, J.J., 1996. Aquatic Chemistry. John Wiely & Sons, New York.
Sunda, W.G. and Huntsman, S.A., 1995. Regulation of copper concentation in the oceanic nutricline by phytoplankton uptake and regeneration cycles. Limnology and Oceanography 40(1), 132-137.
Tessier, A., Campbell, P.G.C. and Bisson, M., 1979. Sequential extraction procedure for the speciation of particle trace metals. Analytical Chemistry 51(7), 844-851.
Thomas, R.L. and Dell, C.I., 1978. Sediments of Lake Superior. Journal of Great Lakes Research 4(3-4), 264-275.
Thompson, M.E., 1978. Major ion loadings to Lake Superior. J. Great Lake Res. 4(3-4), 361-369.
Van Luven, M.D., Huntoon, J.E. and Maclean, A.L., 1999. Determination of the influence of wind on the Keweenaw Current in the Lake SUperior basin as identified by Advanced Very High Resolution Radiomenter (AVHRR) imagery. Journal of Great Lakes Research 25(4), 625-641.
Whitfield, M. and Turner, D.R., 1987. Chapter 17. The role of particles in regulating the composition of seawater. In: W. Stumn (Editor), Aquatic Surface Chemistry. Hohn Wiley & Sons, New York, 457-493.
Wright, T.D., Hamil, B.M., Kraft, K.J., Leddy, D.G. and Nordeng, S.C., 1975. Analysis report-Keweenaw waterways maintenance dredging. DACW 34-74-C-0149, U.S. Army Corps of Engineers, St. Paul District.