Very Important Paper
Linkage Abundance and Molecular Weight Characteristics
of Technical Lignins by Attenuated Total Reflection-FTIR
Spectroscopy Combined with Multivariate Analysis
Christopher S. Lancefield,
[a]Sandra Constant,
[a]Peter de Peinder,
[b]and
Pieter C. A. Bruijnincx*
[a, c]Introduction
Lignin is widely considered as a potential feedstock for the future production of renewable chemicals, materials and energy as industries transition away from fossil fuels.[1–8]Going forward, it is likely to be increasingly produced and isolated on industrial scales as a co-product from both the pulp and paper industry[9–11] and from 2ndgeneration (lignocellulosic)
biorefi-neries producing ethanol or other sugar derivatives. One major challenge in (technical) lignin valorization is that the lignin structure is highly complex and variable. In particular, it de-pends strongly on the botanical origin and the pretreatment process used in its isolation.[6,12,13]This makes detailed structur-al characterization of lignin feedstocks very important for the development and implementation of optimal downstream processing strategies that cater to the (variation in the) struc-ture of the lignin feedstock.
Many different qualitative and quantitative analysis methods have been developed and are employed in the characteriza-tion of native and technical lignins, including wet-chemical, spectroscopic and chromatographic techniques. NMR spectros-copy (1D: 1H, 13C, 31P, 19F; 2D: heteronuclear single quantum coherence (HSQC), heteronuclear multiple bond correlation
(HMBC); 3D: HSQC–total correlation spectroscopy
(TOCSY)),[14,15]FTIR/near infrared (NIR) spectroscopy,[16–18] thioa-cidolysis,[19] DFRC (“derivatization followed by reductive cleav-age”),[19,20] nitrobenzene oxidation,[19] pyro-GC/MS,[21] gel-per-meation chromatography (GPC)[12,22,23]and Klason lignin analy-sis[24] are especially frequently employed. In most cases, these analysis methods reveal information on only specific structural features or properties, rather than the global lignin structure, meaning combinations of various techniques are required to fully characterize a sample. This, therefore, requires access to both extensive analytical instrumentation and significant time Lignin is an attractive material for the production of renewable
chemicals, materials and energy. However, utilization is ham-pered by its highly complex and variable chemical structure, which requires an extensive suite of analytical instruments to characterize. Here, we demonstrate that straightforward atte-nuated total reflection (ATR)-FTIR analysis combined with prin-ciple component analysis (PCA) and partial least squares (PLS) modelling can provide remarkable insight into the structure of technical lignins, giving quantitative results that are compara-ble to standard gel-permeation chromatography (GPC) and 2D heteronuclear single quantum coherence (HSQC) NMR meth-ods. First, a calibration set of 54 different technical (fractionat-ed) lignin samples, covering kraft, soda and organosolv pro-cesses, were prepared and analyzed using traditional GPC and NMR methods, as well as by readily accessible ATR-FTIR
spec-troscopy. PLS models correlating the ATR-FTIR spectra of the broad set of lignins with GPC and NMR measurements were found to have excellent coefficients of determination (R2Cal.> 0.85) for molecular weight (Mn,Mw) and inter-unit abundances (b-O-4,b-5 andb-b), with low relative errors (6.2–14%) as esti-mated from cross-validation results. PLS analysis of a second set of 28 samples containing exclusively (fractionated) kraft lig-nins showed further improved prediction ability, with relative errors of 3.8–13 %, and the resulting model could predict the structural characteristics of an independent validation set of lignins with good accuracy. The results highlight the potential utility of this methodology for streamlining and expediting the often complex and time consuming technical lignin characteri-zation process.
[a]Dr. C. S. Lancefield, Dr. S. Constant, Prof. Dr. P. C. A. Bruijnincx Inorganic Chemistry and Catalysis
Debye Institute for Nanomaterials Science Utrecht University
Universiteitsweg 99, 3584 CG Utrecht (The Netherlands) E-mail: p.c.a.bruijnincx@uu.nl
[b]Dr. P. de Peinder VibSpec
Haaftenlaan 28, 4006 XL Tiel (The Netherlands) [c] Prof. Dr. P. C. A. Bruijnincx
Organic Chemistry and Catalysis Debye Institute for Nanomaterials Science Utrecht University
Universiteitsweg 99, 3584 CG Utrecht (The Netherlands)
Supporting Information and the ORCID identification number(s) for the author(s) of this article can be found under:
https://doi.org/10.1002/cssc.201802809.
inputs for data acquisition and analysis. Clearly, it would be ad-vantageous to develop simple, time- and cost-effective tech-niques that allow many different chemical and physical fea-tures of a lignin sample to be determined in a single measure-ment, using broadly available instrumentation and allowing rapid, high-throughput analysis.
In this respect, FTIR analysis is particularly interesting as each measurement, in principle, provides information on all chemical bonds present in the lignin structure. The spectra are thus not only very rich in information but the technique is also simple to operate, fast and widely available. Indeed, also for lignin characterization, FTIR analysis is commonly used in a qualitative fashion, for example, to identify different functional groups;[25–28]however, due to the complex patterns and severe peak overlap, it is seldom used to extract detailed structural in-formation in a way that, for example, NMR spectroscopy does. Nor is it often used for quantitative measurements, although Schultz and Glasser have demonstrated some success in this direction.[29] By applying chemometrics to FTIR datasets it is possible to overcome these complexities and perform much more in-depth and quantitative analyses. For example, partial least squares (PLS) multivariate regression analysis can be used to predict, with good accuracy, the hydroxyl group content (e.g., phenolic, aliphatic, COOH), lignin purity, syringyl/guaiacyl (S/G) ratio and radical scavenging ability of different technical lignins from their FTIR spectra.[30,31] The technique has also been applied extensively for the characterisation of whole bio-mass, for example, to predict wood and in planta lignin com-position.[18,32–37] The objective of this present study was to fur-ther extend the scope of this approach and to extract more detailed structural information from the FTIR spectra of techni-cal lignins.
Here, we show that PLS regression models developed for technical lignins from their attenuated total reflection (ATR)-FTIR spectra and a calibration set of GPC and NMR data can be used to quantitatively predict a remarkable amount of addi-tional structural information, including Mn, Mw and inter-unit linkage abundances, critical information that has not previously been obtained using FTIR/multivariate analyses. Thus, once these models are in place, this approach, together with the previously reported efforts on functional group content and S/ G ratio,[30,31] potentially allows the entire suite of traditional lignin analysis methods to be replaced with a single ATR-FTIR measurement. This would be particularly advantageous when routine structural characterization is required, for example, during lignin fractionation processes, in quality control applica-tions or when access to, for example, high-end NMR equip-ment is limited.
Results and Discussion
To develop a robust model, it is important to use a training set that includes a sufficient number of samples of adequate diver-sity so that it covers the expected range of lignin structures for which the model will be applied. This can potentially include intra- and inter-feedstock variability depending on the intend-ed final application of the model. Therefore, as a proof of
con-cept, we generated a library of 54 different lignin samples from different botanical sources and isolation methods. All these samples were then analysed by 2D HSQC NMR spectros-copy and GPC measurements and a subset by31P NMR spec-troscopy, giving the calibration data required for subsequent PLS modelling. This data can be found in full in Tables S1 and S2 in the Supporting Information, along with the details of the exact origin of each lignin sample.
For our studies, FTIR spectra were collected in ATR mode, which is both simpler and much faster than traditional trans-mission mode measurements as it does not require the prepa-ration of KBr pellets and is readily available in most laborato-ries. The assignment of the FTIR spectra of lignin has been well reported previously[17] and allows identification of some char-acteristic bands that can be useful for manually differentiating lignin samples. The differences between samples can, however, be very subtle. For example, Figure 1 shows that the spectrum obtained from an Indulin AT lignin (a softwood, G-type kraft lignin, Table S1, entry 9) is quite different from those obtained from either P1000 (herbaceous, SGH-type soda lignin, Table S1, entry 34) or Alcell (hardwood, SG-type organosolv lignin, Table S1, entry 49) lignins, as evidenced by differences in the bands at around 1330–1325 (vibrations attributed to S plus condensed G rings), 1270–1266 (G ring) and 1128–1125 cm@1(S ring).[17]The spectra of the Alcell and P1000 lignins are, howev-er, very similar and would be difficult to differentiate based on visual inspection of the spectra alone.
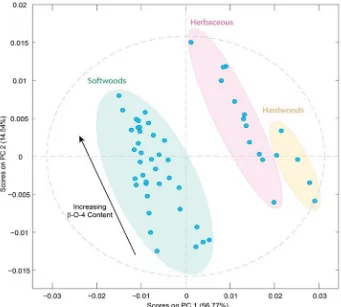
To extract any additional information contained, principle component analysis (PCA) can be applied to identify and em-phasise variations in the spectra. As also previously reported,[30] groups of lignin samples can be clearly discerned after PCA and trends in the samples start to emerge. Initial PCA showed that the softwood lignins could be resolved from the hard-wood and herbaceous ones; however, the latter two groups were not resolved from each other (Figure S1a). Interestingly, we found that by using the 1st derivative spectra, which can improve resolution and eliminate some background problems, much better separation of the lignin groups could be ach-ieved, allowing all three categories to be differentiated (Figure 2). Based on mainly principal component 1 (PC1) load-ings it is possible to group samples according to their botani-cal origin, with increasingly positive loadings on PC1 being ob-served from softwood- to herbaceous- to hardwood-derived lignin samples. Furthermore, a comparison of the PCA with the NMR data showed that higher proportions ofb-O-4 linkages in a lignin correlated with more positive loadings on PC2 (see also Figure S1b). In line with previous studies,[30] this suggests that PCA of FTIR spectra can provide a quick and simple method to classify lignin feedstocks according to botanical origin and basic structure. The apparent structure dependence of the PC2 loadings also suggested that multivariate analysis may be a useful tool for extracting detailed information on the structural features of lignin as well, for example, on inter-unit linkage abundance.
re-Figure 1.ATR-FTIR spectra of (a) Indulin AT kraft (softwood); (b) Alcell organosolv (hardwood) and (c) P1000 soda (herbaceous) lignin.
Figure 2.Principal component analysis plot of the 54 lignin samples used in this study. The ATR-FTIR spectra were pre-processed by applying baseline correc-tion, 1stderivative transformation, normalization and mean centering. Shading shows how the lignins are grouped according to their different botanical
[image:3.595.128.469.401.708.2]ported, especially ones that might be of particular industrial or academic relevance. In particular, we chose to focus on molec-ular weight and inter-unit linkage abundance as these proper-ties have not yet been obtained directly from FTIR spectra by chemometrics and are closely associated with the potential to valorise lignins. For example, b-O-4 content can significantly affect the potential to generate monomeric aromatic com-pounds from lignins[13,38, 39] and molecular weight may play a role in determining whether lignins are suitable for use in ma-terials applications, for example in carbon-fibre production.[40]
Thus, PLS regression models were built and optimised using the PLS Toolbox within MATLAB. PLS regression determines a linear regression model for the relationship between depen-dent variables (ATR-FTIR) and predictor variables (NMR spec-troscopy, GPC), which can then subsequently be used for making predictions based on ATR-FTIR measurements on new samples. Beyond baseline correction, normalization and mean centring, a number of other pre-processing options for the spectral data were evaluated based on spectral range and using 1stand 2ndderivative spectra. Additionally, the number of latent variables used for calculating the PLS models were indi-vidually optimised for each variable of interest. In most cases this optimum corresponded to the number of latent variables that gave the lowest root mean squared error of cross-valida-tion (RMSECV) value; however, where an obvious minimum was not observed, the number of latent variables (LVs) was chosen were the RMSECV no longer significantly improved (ca. <2% improvement) and/or where additional latent variables accounted for very little additional variance.[41] These results are summarised in Table S3. In our case, we found that the best results were generally obtained using truncated (750– 2000 cm@1) spectra, combined with taking the 1st derivative (Table 1). Additionally, using the results of our31P NMR analyses we could also validate the ability of this technique to predict lignin hydroxyl group content (Table S4), as previously report-ed by Boeriu et al.[30,31]
The results of the PLS regression show that the properties of interest are, in general, well modelled. Good correlation coeffi-cients of determination for the calibration (R2 Cal.) were ob-tained for all properties (>0.85), except dispersity (D=Mw/Mn) which had a lower R2 Cal. (entry 5, 0.72, Table 1). Relatively
lower coefficients of determination for cross-validation (CV) were observed forMw(entry 3), b-5 (entry 7), b-b(entry 8) and especially D (entry 5), resulting in higher relative errors (REs). Interestingly we found that significantly improved models were obtained when using log(Mn) and log(Mw) (entries 2 and 4), compared to the non-logarithmic values (entries 1 and 3), which may indicate that non-linearity exists in the molecular-weight data. One explanation for this relates to the GPC method used for determining theMwandMnvalues of the cali-bration set. We,[12] and others,[22,42,43] have previously found that the results of lignin GPC measurements are very sensitive to the exact method and equipment used for their determina-tion. Additionally, GPC results using multi-angle light scattering detection at 785 nm have recently shown that standard detec-tion methods (e.g., refractive index) in combinadetec-tion with sulfo-nated polystyrene standards are subject to substantial (non-linear) errors in the molecular-weight results.[44]While the con-ditions used for our GPC analysis (UV detection, polystyrene standards, acetylated lignin) are not identical to those used in the referenced study, the same type of errors will undoubtedly be present. As for the linkage abundance accuracy, it is also important to appreciate that HSQC NMR quantification is only semi-quantitative, relying on internal lignin aromatic signals (G2, S2/6, H2/6) for reference. Due to the differences in dispersity, nature and degree of lignin condensation as function of the extraction process applied, this method is also likely subject to varying magnitudes of errors, introducing scatter in the data. With this in mind, it is very encouraging to see that such good PLS models can already be obtained for this very diverse set of technical lignins. To see if the modelling could be improved further a more focused set of lignins was analysed, where the effects of the potential errors in the NMR analysis and GPC measurements serving as the calibration data should be less significant. Therefore, the initial set of 54 lignins was reduced in size to 28 lignins of similar origin (Table S1). These lignins had all been generated by solvent fractionation of three differ-ent softwood kraft lignins: two differdiffer-ent Indulin AT batches and one BioChoice lignin (see the Supporting Information for fractionation details), with the latter being generated from a harsher pulping process.[45]Such a situation is in fact highly rel-evant as most pulp mills or biorefineries are specialised
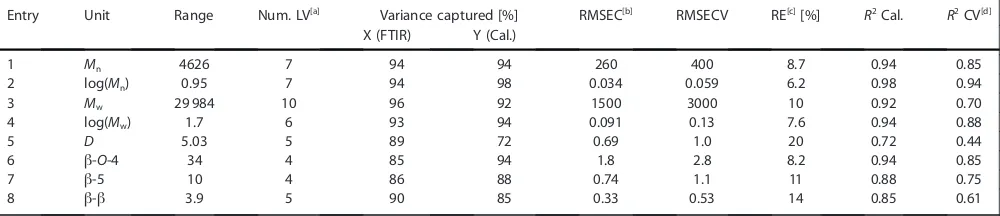
to-Table 1.Results of PLS regression between molecular weight and inter-unit abundances as determined by GPC and 2D HSQC NMR spectroscopy, respec-tively, for the 54 lignin samples and their ATR-FTIR using 1st derivative pre-processing.
Entry Unit Range Num. LV[a] Variance captured [%] RMSEC[b] RMSECV RE[c][%] R2Cal. R2CV[d]
X (FTIR) Y (Cal.)
1 Mn 4626 7 94 94 260 400 8.7 0.94 0.85
2 log(Mn) 0.95 7 94 98 0.034 0.059 6.2 0.98 0.94
3 Mw 29 984 10 96 92 1500 3000 10 0.92 0.70
4 log(Mw) 1.7 6 93 94 0.091 0.13 7.6 0.94 0.88
5 D 5.03 5 89 72 0.69 1.0 20 0.72 0.44
6 b-O-4 34 4 85 94 1.8 2.8 8.2 0.94 0.85
7 b-5 10 4 86 88 0.74 1.1 11 0.88 0.75
8 b-b 3.9 5 90 85 0.33 0.53 14 0.85 0.61
[image:4.595.48.548.611.719.2]wards specific types of feedstocks (i.e., soft or hardwoods) and chemical processes tend to be optimised towards specific input streams. This means that, in reality, most processes will probably be dealing with quite defined lignin streams and any quantitative analysis tool would not typically have to span the range of highly diverse ones analysed above. To test the pre-dictive ability of the new kraft sample-based PLS models, an in-dependent validation set of seven lignins was generated from another set of Indulin AT lignin fractions (Table S5).
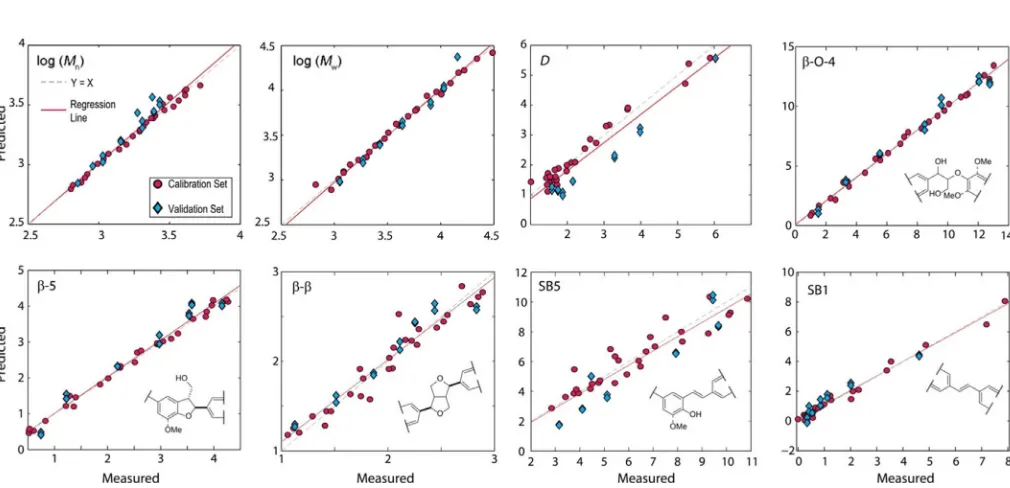
Using the previously determined optimal method for proc-essing the IR spectra, this focused set of lignins produced sig-nificantly improved results with higherR2Cal.,R2CV and lower REs for the PLS models (Table 2). Stilbenoid units (SB1 and SB5) were additionally included in this analysis, as we have recently identified them as particularly abundant units in softwood kraft lignin.[12,46] The improved correlation results suggested
[image:5.595.49.548.306.433.2]that the models should be able to predict the properties of new, lignin samples obtained independently from the original calibration set with reasonably high accuracy. This is demon-strated by the analysis of a validation set of lignins. Two ATR-FTIR spectra were recorded for each sample, giving a total of 14 samples for testing. The coefficients of determination (R2 Pred.) were all excellent and similar to theR2CV values where-as the root mean squared error of prediction (RMSEP) values were slightly higher (worse) than the RMSECV values, but still suggested good accuracy in the predictions. To illustrate this, Figure 3 provides plots of the measured against PLS-model predicted values for the calibration (red circles) and validation (blue diamonds) sets, and Table 3 shows the mean predicted values of the properties of interest for the validation lignins. The results show that in most cases the predicted values are very close to the NMR analysis and GPC measured values and
Table 2.Results of PLS regression between molecular weight and inter-unit abundances determined by GPC and 2D HSQC NMR spectroscopy for the 28 kraft lignin samples and their ATR-FTIR spectra using 1st derivative pre-processing.[a]
Entry Unit Range Num. LVs Calibration (28 samples) Validation (2V7 samples)
RMSEC RMSECV RE [%] R2Cal. R2CV RMSEP R2Pred.
1 Mn 4570 6 210 410 9.0 0.97 0.89 810 (510)[c] 0.87 (0.98)[c]
2 log(Mn) 0.91 5 0.025 0.046 5.0 0.99 0.97 0.087 (0.050)[c] 0.96 (0.99)[c]
3 Mw 29984 6 1430 3100 10 0.96 0.81 3400 0.89
4 log(Mw) 1.7 6 0.039 0.097 5.8 0.99 0.95 0.094 0.98
5 D 4.9 6 0.22 0.51 10 0.97 0.84 0.72 0.98
6 b-O-4 12 6 0.25 0.46 3.8 1.00 0.99 0.56 0.98
7 b-5 3.8 6 0.095 0.18 4.7 0.99 0.98 0.27 0.97
8 b-b 1.8 3 0.13 0.19 10 0.94 0.87 0.15 0.94
9 SB5 8.0 3 0.79 1.0 13 0.87 0.79 1.2 0.90
10 SB1 7.9 5 0.26 0.48 6.1 0.98 0.94 0.39 0.94
[a] Values reported to 2 significant figures; see Figure S3 for the regression vectors associated with these models. [b] Pred.=predicted. [c] The relatively large RMSECV/RMSEP ratio can indicate overfitting. In this case it results from an outlier sample in theMnmeasurements due to the poor solubility of the
[image:5.595.46.551.476.720.2]acetone/MeOH fraction in the GPC solvent. Exclusion of this data results in a better prediction (shown in brackets).
that the trends observed in the values are faithfully repro-duced by PLS modeling of the IR spectra. For most practical purposes, the analytical accuracy obtained using this method-ology should be more than adequate, especially when the time (minutes versus hours), cost and human input savings are taken into consideration.
Conclusions
The results presented here thus demonstrate that attenuated total reflection (ATR)-FTIR analysis of lignins, combined with multivariate analysis techniques such as principal component analysis (PCA) and partial least squares (PLS) modelling, can provide a wealth of structural information. To the best of our knowledge, we show for the first time that this can be used to predict Mn, Mw and inter-unit linkage abundance in technical lignins with good accuracy, as demonstrated for fractionated kraft lignins. A further advantage of this method is that the effect of operator bias is completely removed. Usually, gel-per-meation chromatography (GPC) analysis requires at least some manual adjustment of baselines and integrals and similarly, processing of heteronuclear single-quantum coherence spec-troscopy (HSQC) NMR spectra is an interactive process requir-ing manual inputs. In both cases differences in operator proce-dures can lead to significantly different results reducing repro-ducibility. With no manual processing inputs, the FTIR–PLS ap-proach has the potential to significantly improve the reprodu-cibility of routine lignin characterisation measurements across the lignin field, at the same time reducing time, cost and equipment requirements.
Going forward, we believe that this analysis method can find broad application in industry and academia. For example, as the lignin market grows, pulp mills and biorefineries will in-creasingly have to provide detailed structural characterisation of their lignin co-streams to customers as well as ensuring
strict quality control is implemented to ensure product consis-tency. Furthermore, in academia as well as in industrial re-search and development, lignin analysis is still often a bottle-neck in process development and therefore a quick, easy and widely available analysis method, such as this, will be a valua-ble tool for future lignin valorisation efforts.
Experimental Section
Lignins:All lignins used in this study were commercially available,
prepared in house or kind donations and were all used as is, that is, without grinding or any special drying step to remove absorbed water. Full details of the origin and NMR and GPC characterization of the lignins are provided in the Supporting Information.
NMR analysis:High-field NMR spectra were acquired on a Bruker
Avance II 600 MHz spectrometer equipped with a 5 mm CPTCI (proton-optimized triple resonance)1H–13C/15N–2H cryogenic probe with z-gradients at 258C. 1H–13C HSQC spectra were recorded using either the Bruker pulse program ‘hsqcetgpsp.3’ (using the following parameters: acquired from 13 to@1 ppm in F2 (1H) with 2048 data points, 160 to 0 ppm in F1 (13C) with 256 increments with a 1 s interscan delay (D1); cnst2 was set to 145 Hz) or the Q-CAHSQC pulse program[47] (using the following parameters: ac-quired from 13 to@1 ppm in F2 (1H) with 2048 data points, 160 to 0 ppm in F1 (13C) with 128 increments with a 6 s interscan delay (D1); cnst2 was set to 145 Hz). In both cases processing used Gaus-sian apodization (GB=0.1, LB=0.3 Hz) in F2 and squared cosine-bell and one level of linear prediction (32 coefficients) in F1. Volume integration of HSQC signals used Bruker’s TopSpin 3.5 typi-cally following manual phase correction and automatic baseline correction. [D6]DMSO was used as the NMR solvent and the central DMSO solvent peak was used as internal reference (dC=39.6 ppm,
[image:6.595.49.549.98.282.2]dH=2.49 ppm). The relative quantity of side chains was calculated on a per 100 aromatic units (100Ar) base (based on comparison to the G/S/H aromatic integrals as previously reported).[48] Integrals from symmetrical units (i.e.,b-bunits) were halved to calculate the number of units per 100Ar.
Table 3.Results measured by GPC and HSQC NMR spectroscopy and predicted by the PLS model for the validation set of kraft lignins. Predicted values are an average of two ATR-FTIR measurements.[a]
Property EtOAc/MeOH Acetone/MeOH
0% 5% 10 % 20% 30% 40% 50%
Mn[b] measured 710 1100 1400 2000 2500 2700 2400
[c]
predicted 690 1100 1600 2200 2800 3300 3700
Mw[b] measured 1100 1900 2700 4400 8100 11000 14000
[c] predicted 950 1600 2500 4300 7100 11000 24000
D measuredpredicted 1.61.2 1.71.1 1.91.0 2.11.5 3.32.3 3.24.0 6.035.6[c]
b-O-4 predictedmeasured 1.51.2 3.33.7 5.56.0 8.58.3 9.610 1213 1212
b-5 measuredpredicted 0.70.5 1.21.5 2.22.3 3.03.1 3.53.8 4.04.2 3.64.1
b-b measuredpredicted 1.11.3 1.51.6 1.91.9 2.12.2 2.42.3 2.62.8 2.42.6
SB5 measuredpredicted 9.410 9.78.4 7.96.6 4.55.0 5.13.7 2.84.1 3.21.8
SB1 measuredpredicted 4.64.4 2.02.5 1.11.7 0.91.2 0.40.8 0.50.5 0.050.3
GPC:GPC measurements were performed on a Polymer Labs GPC 50 system, equipped with a series of three PLGel Mixed-E columns and a guard column, using THF spiked with 0.1 vol% acetic acid as the mobile phase. Detection was with an external Knauer UV de-tector at 280 nm and molecular weight determinations were based on calibration with polystyrene standards (Mn=162, 570, 1060, 1400, 2240, 3690, 4760, 7130, 12800 and 19690). Samples were acetylated (pyridine/acetic anhydride overnight, dried under a stream of N2), then dissolved in the THF eluent (ca. 1.5 mgmL@1) and filtered (45mm PTFE syringe filter) prior to analysis.
ATR-FTIR analysis:ATR-FTIR spectra of the lignin samples were
re-corded on a PerkinElmer Frontier FTIR spectrometer equipped with a LiTaO3 mid-IR detector using a PerkinElmer Universal ATR Sam-pling Accessory with a diamond/ZnSe plate. Spectra were collected in the range 4000–600 cm@1with a resolution of 4 cm@1and with 16 co-added scans. Spectra were recorded in batches over several different days, and new background spectra were recorded after every 10–15 min of measurements. All lignin samples were used ‘as-is’—that is, no special preparation procedures were applied (e.g., drying or grinding).
Data analysis:PCA and PLS modelling were performed using the
PLS_Toolbox (Version 8.6, Eigenvector) within the MATLAB environ-ment (R2017a). Spectra were pre-processed using baseline correc-tion (automatic weighted least squares, order=2), normalization and mean-centering. When 1st- (order: 2, filter width: 7 pt, tails: polyinterp) or 2nd-order (order: 2, filter width: 7 pt, tails: polyin-terp) derivative processing was used this was applied after baseline correction but before normalization. CV used venetian blinds with 10 splits and 1 sample per split. Baseline correction can be omitted when using derivative spectra, giving essentially identical results (Table S7).
Acknowledgements
This research has been performed within the framework of the CatchBio program. The authors gratefully acknowledge the sup-port of the Smart Mix Program of the Netherlands Ministry of Economic Affairs and the Netherlands Ministry of Education, Cul-ture and Science. We also acknowledge Dr. Richard J. A. Gosselink (Wageningen University & Research) for the kind donation of some of the fractionated lignin samples and Khaled Khalili and Dr. Florian Meirer (both Utrecht University) for useful discussions and proofreading of this manuscript. We would like to thank UPM, RAIZ—Forest and Paper Research Institute (Portugal) and ECN part of TNO (The Netherlands) for the kind donations of Bio-Choice kraft, Eucalyptus kraft and organosolv lignins, respectively.
Conflict of interest
The authors declare no conflict of interest.
Keywords: biomass · chemometrics · FTIR spectroscopy ·
lignin·partial least squares modelling
[1] Z. Sun, B. Fridrich, A. de Santi, S. Elangovan, K. Barta,Chem. Rev.2018, 118, 614– 678.
[2] P. Azadi, O. R. Inderwildi, R. Farnood, D. A. King,Renewable Sustainable Energy Rev.2013,21, 506– 523.
[3] C. Li, X. Zhao, A. Wang, G. W. Huber, T. Zhang,Chem. Rev.2015, 115, 11559– 11624.
[4] B. M. Upton, A. M. Kasko,Chem. Rev.2016,116, 2275– 2306. [5] A. Duval, M. Lawoko,React. Funct. Polym.2014,85, 78–96.
[6] W. Schutyser, T. Renders, S. Van den Bosch, S.-F. Koelewijn, G. T. Beck-ham, B. F. Sels,Chem. Soc. Rev.2018,47, 852 –908.
[7] S. Gillet, M. Aguedo, L. Petitjean, A. R. C. Morais, A. M. Da, C. Lopes, R. M. Łukasik, P. T. Anastas,Green Chem.2017,19, 4200.
[8] R. Rinaldi, R. Jastrzebski, M. T. Clough, J. Ralph, M. Kennema, P. C. A. Bruijnincx, B. M. Weckhuysen, Angew. Chem. Int. Ed. 2016, 55, 8164 – 8215;Angew. Chem.2016,128, 8296 –8354.
[9] F. Oehman, H. Theliander, P. Tomani, P. Axegard, US Pat. US20100325,
2009.
[10] L. Kouisni, P. Holt-Hindle, K. Maki, M. Paleologou,Pulp Pap. Can.2014, 115, 18– 22.
[11] M. A. Lake, J. C. Blackburn,Cellul. Chem. Technol.2014,48, 799 –804. [12] S. Constant, H. L. J. Wienk, A. E. Frissen, P. de Peinder, R. Boelens, D. S.
van Es, R. J. H. Grisel, B. M. Weckhuysen, W. J. J. Huijgen, R. J. A. Gosse-link, P. C. A. Bruijnincx,Green Chem.2016,18, 2651– 2665.
[13] P. J. Deuss, C. S. Lancefield, A. Narani, J. G. de Vries, N. J. Westwood, K. Barta,Green Chem.2017,19, 2774 – 2782.
[14] J. Ralph, L. L. Landucci, inLignin and Lignans: Advances in Chemistry (Eds.: C. Heitner, D. Dimmel, J. A. Schmidt), CRC Press, Taylor & Francis, Boca Raton, FL, USA, Boca Raton,2010, pp. 137 –244.
[15] D. S. Argyropoulos inLignin and Lignans: Advances in Chemistry(Eds.: C. Heitner, D. Dimmel, J. A. Schmidt), CRC Press, Taylor & Francis, Boca Raton, FL,2010, pp. 245– 266.
[16] U. P. Agarwal, R. H. Atalla inLignin and Lignans: Advances in Chemistry (Eds.: C. Heitner, D. Dimmel, J. A. Schmidt), CRC Press, Taylor & Francis, Boca Raton, FL,2010, pp. 103 –136.
[17] O. Faix in Methods in Lignin Chemistry (Eds.: S. Y. Lin, C. W. Dence), Springer, Berlin,1992, pp. 83– 109.
[18] A. R. Robinson, S. D. Mansfield,Plant J.2009,58, 706– 714.
[19] G. Brunow inBiopolymers Online(Eds.: A. Steinbechel, M. Hofrichter), Wiley-VCH, Weinheim, Germany,2005, pp. 89– 99.
[20] M. Regner, A. Bartuce, D. Padmakshan, J. Ralph, S. D. Karlen, Chem-SusChem2018,11, 1600 –1605.
[21] G. C. Galletti, P. Bocchini,Rapid Commun. Mass Spectrom.1995,9, 815 – 826.
[22] H. Lange, F. Rulli, C. Crestini,ACS Sustainable Chem. Eng.2016,4, 5167 – 5180.
[23] A. Tolbert, H. Akinosho, R. Khunsupat, A. K. Naskar, A. J. Ragauskas, Bio-fuels Bioprod. Biorefin.2014,8, 836– 856.
[24] Tappi,Acid-Insoluble Lignin in Wood and Pulp,2006, https://www.tap-pi.org/content/SARG/T222.pdf.
[25] I. Panovic, J. R. D. Montgomery, C. S. Lancefield, D. Puri, T. Lebl, N. J. Westwood,ACS Sustainable Chem. Eng.2017,5, 10640 –10648. [26] O. Gordobil, R. Moriana, L. Zhang, J. Labidi, O. Sevastyanova,Ind. Crops
Prod.2016,83, 155 –165.
[27] Y. Han, L. Yuan, G. Li, L. Huang, T. Qin, F. Chu, C. Tang,Polymer2016,83, 92–100.
[28] L. Wiermans, H. Schumacher, C. M. Klaaßen, P. Dom&nguez De Mar&a,RSC Adv.2015,5, 4009 – 4018.
[29] T. P. Schultz, W. G. Glasser,Holzforschung1986, 40, 37– 44. (This refer-ence appears to be unavailable from the publisher and was identified from a description in: T. A. Milne, A. H. Brennan, B. H. Glenn, Solar Tech-nical Information Program (U. S.), Sourcebook of Methods of Analysis for Biomass and Biomass Conversion Processes, Elsevier Applied Science 1990; https://www.nrel.gov/docs/legosti/old/3548.pdf).
[30] C. G. Boeriu, D. Bravo, R. J. A. Gosselink, J. E. G. van Dam, Ind. Crops Prod.2004,20, 205 –218.
[31] C. G. Boeriu, F. I. Fit¸iga˘u, R. J. A. Gosselink, A. E. Frissen, J. Stoutjesdijk, F. Peter,Ind. Crops Prod.2014,62, 481 –490.
[32] M. N. Gebreselassie, K. Ader, N. Boizot, F. Millier, J.-P. Charpentier, A. Alves, R. Simles, J. C. Rodrigues, G. Bodineau, F. Fabbrini, M. Sabatti, C. Bastien, V. Segura,Ind. Crops Prod.2017,107, 159 –171.
[33] S. Tsuchikawa, H. Kobori,J. Wood Sci.2015,61, 213– 220.
[34] B. K. Via, C. Zhou, G. Acquah, W. Jiang, L. Eckhardt,Sensors2014,14, 13532 –13547.
[36] G. Zhou, G. Taylor, A. Polle,Plant Methods2011,7, 9.
[37] A. Ferraz, J. Baeza, J. Rodriguez, J. Freer,Bioresour. Technol. 2000,74, 201– 212.
[38] T. Phongpreecha, N. C. Hool, R. J. Stoklosa, A. S. Klett, C. E. Foster, A. Bhalla, D. Holmes, M. C. Thies, D. B. Hodge, Green Chem. 2017, 19, 5131 –5143.
[39] Y. Wang, S. Sun, F. Li, X. Cao, R. Sun,Ind. Crops Prod.2018,116, 116– 121.
[40] Q. Li, W. K. Serem, W. Dai, Y. Yue, M. T. Naik, S. Xie, P. Karki, L. Liu, H. J. Sue, H. Liang, F. Zhou, J. S. Yuan,J. Mater. Chem. A2017,5, 12740 – 12746.
[41] B. M. Wise, N. B. Gallagher, W. Windig, Chemometrics Tutorial for PLS_ Toolbox and Solo, Eigenvector Research, Inc., Wenatchee, WA,2006. [42] R. J. A. Gosselink, A. Ab-cherli, H. Semke, R. Malherbe, P. K-uper, A.
Nadif, J. E. G. van Dam,Ind. Crops Prod.2004,19, 271 –281.
[43] S. Baumberger, A. Abaecherli, M. Fasching, G. Gellerstedt, R. Gosselink, B. Hortling, J. Li, B. Saake, E. De Jong,Holzforschung2007,61, 459 –468. [44] G. Zinovyev, I. Sulaeva, S. Podzimek, D. Rçssner, I. Kilpelainen, I.
Sumer-skii, T. Rosenau, A. Potthast,ChemSusChem2018,11, 3259 – 3268. [45] Z. Hu, X. Du, J. Liu, H. M. Chang, H. Jameel, J. Wood Chem. Technol.
2016,36, 432– 446.
[46] C. S. Lancefield, H. L. J. Wienk, R. Boelens, B. M. Weckhuysen, P. C. A. Bruijnincx,Chem. Sci.2018,9, 6348 –6360.
[47] H. Koskela, I. Kilpel-inen, S. Heikkinen,J. Magn. Reson.2005,174, 237 – 244.
[48] L. Zhang, G. Gellerstedt,Magn. Reson. Chem.2007,45, 37– 45.

![2 [(Anilino)(2 nitrophenyl)methyl]cyclohexanone](data:image/gif;base64,R0lGODlhAQABAIAAAP///wAAACH5BAEAAAAALAAAAAABAAEAAAICRAEAOw==)