C
2010. The American Astronomical Society. All rights reserved. Printed in the U.S.A.
A MULTIPHASE
SUZAKU
STUDY OF X-RAYS FROM
τ
Sco
R. Ignace1, L. M. Oskinova2, M. Jardine3, J. P. Cassinelli4, D. H. Cohen5, J.-F. Donati6, R. H. D. Townsend4,
and A. ud-Doula7
1Department of Physics and Astronomy, East Tennessee State University, Johnson City, TN 37614, USA;[email protected] 2Institute for Physics and Astronomy, University Potsdam, 14476 Potsdam, Germany;[email protected] 3School of Physics and Astronomy, University of St Andrews, St Andrews, KY16 9SS, UK;[email protected] 4Department of Astronomy, University of Wisconsin, Madison, WI 53706, USA;[email protected],[email protected]
5Department of Physics & Astronomy, Swarthmore College, Swarthmore, PA 19081, USA;[email protected] 6LATT, Observatoire Midi-Pyrenees, 14 Av. E. Belin, F-31400 Toulouse, France;[email protected]
7Department of Physics, Penn State Worthington Scranton, 120 Ridge View Dr, Dunmore, PA 18512, USA;[email protected]
Received 2010 June 4; accepted 2010 July 30; published 2010 September 9
ABSTRACT
We obtained relatively high signal-to-noise X-ray spectral data of the early massive star τ Sco (B0.2V) with the
SuzakuX-ray Imaging Spectrometer (XIS) instrument. This source displays several unusual features that motivated our study: (1) redshifted absorption in UV P Cygni lines to approximately +250 km s−1suggestive of infalling gas,
(2) unusually hard X-ray emission requiring hot plasma at temperatures in excess of 10 MK whereas most massive stars show relatively soft X-rays at a few MK, and (3) a complex photospheric magnetic field of open and closed field lines. In an attempt to understand the hard component better, X-ray data were obtained at six roughly equally spaced phases within the same epoch ofτ Sco’s 41 day rotation period. The XIS instrument has three operable detectors: XIS1 is back-illuminated with sensitivity down to 0.2 keV; XIS0 and XIS2 are front-illuminated with sensitivity only down to 0.4 keV and have an overall less effective area than XIS1. The XIS0 and XIS3 detectors show relatively little variability. In contrast, there is a≈4σ detection of a≈4% drop in the count rate of the XIS1 detector at one rotational phase. In addition, all three detectors show a≈3% increase in count rate at the same phase. The most optimistic prediction of X-ray variability allows for a 40% change in the count rate, particularly near phases where we have pointings. Observed modulations in the X-ray light curve on the rotation cycle is an order of magnitude smaller than this, which places new stringent constraints on future modeling of this interesting magnetic massive star.
Key words: stars: early-type – stars: individual (τ Sco) – stars: magnetic field – stars: winds, outflows – X-rays: stars
Online-only material:color figures
1. INTRODUCTION
The B0.5V starτ Sco has a storied history in the study of massive stars. A northern hemisphere object of early spectral type that is relatively bright and close has made τ Sco a favored target for multiwavelength studies. It was a primary target in the early days of ultraviolet astronomy (e.g., Rogerson & Lamers 1976; Rogerson & Upson 1978) and was found to be a relatively hard X-ray source as compared to its peers (MacFarlane & Cassinelli1989; Cassinelli et al.1994). It also displays redshifted absorption in UV P Cygni lines of Oviand Nv(Lamers & Rogerson1978). These features combined with growing evidence of clumped wind flows motivated Howk et al. (2000) to develop a model of infalling wind clumps to explain the observed redshifted absorptions and as a way of producing high velocity shocked gas to account for significant amounts of high temperature gas in excess of 10 MK in the system. X-ray data fromChandra(Cohen et al.2003) and XMM-Newton(Mewe et al. 2003) confirmed the unusual hardness of this source, revealing also that the emission lines are relatively narrow. Since then, advances in observational spectropolarimetry have allowed for more detections and more stringent constraints on magnetism in massive stars (e.g., Donati et al.2006a; Hubrig et al.2008; Alecian et al.2008). Donati et al. (2006b) reported on the discovery of a surprisingly complex photospheric magnetic field inτ Sco, a topology that sports sectors of open field lines and confining loops that deviate significantly from a simple dipole morphology.
All of these observational features together are yet to be explained by a single unifying model. The emission lines resolved by Chandraspan a large range of energies, and yet all of the lines are quite narrow, with typical HWHM velocities of 300 km s−1. From Gaussian fits, the peak emissions for an ensemble of lines show little net velocity shift (Cohen et al.
2003). Both of these features suggest minimal photoabsorption by the wind ofτ Sco (e.g., Owocki & Cohen2001). It may also be that the wind is relatively porous. (Discussions on the impact of clumping and porosity for X-ray emissions and line profile shapes can be found in Feldmeier et al.2003, Oskinova et al.
2004, and Owocki & Cohen2006.)
An understanding of the X-ray hardness and line profile properties is critical for producing a quantitative, physical model for τ Sco’s wind structure. One way to further constrain the modeling effort is to analyze variability ofτSco. Observing time ofτSco usingSuzakuwas awarded to obtain multiple pointings with rotational phase to constrain the relative contributions of confined plasma to wind-shocked plasma in terms of the X-ray emission measure (EM) and plasma temperature. Our experiment was designed to take advantage of the following facts. First,τ Sco is a slow rotator with a rotation period of approximately 41 days. It is also relatively bright in X-rays, and so exposures for the different pointings are quite short as compared to the rotation period. In addition, the star is viewed nearly edge-on with respect to the rotational equator such that the closed magnetic loops, which are asymmetrically distributed around the star, are occulted during a rotation cycle. In fact,
No. 2, 2010 A MULTIPHASESUZAKUSTUDY OF X-RAYS FROMτ Sco 1413
Donati et al. (2006b) predicted that the X-ray emissions of τ Sco could vary by as much as 40% with rotational phase.
Given that the field topology has remained stable over the last decade (Donati & Landstreet2009), multiple pointings—even if at different epochs—have the potential of determining hot plasma components in the closed magnetic loops as compared to the larger-scale wind through an analysis of the X-ray variability. This is a technique that has been used successfully in another magnetic massive star, θ1 Ori C. Gagn´e et al. (1997, 2005)
reported on multiphase X-ray spectral data from this young O5.5V star. In that case, the surface field has kilo-Gauss values (Donati et al.2002). The field is sufficiently strong in relation to its wind kinetic energy density that substantial confinement of the wind flow in the form of an oblique magnetic rotator results, leading to significant X-ray variability with rotational phase (Babel & Montmerle1997a). Gagn´e et al. reported changes in the soft and hard component EMs at about 25%.
The method has also been used successfully for constraining emission models in the case of the magnetic early B starβCep (Favata et al.2009). This is a B1 IIIe star that is slowly rotating (vsini ≈ 20 km s−1; Abt et al. 2000). Despite a relatively strong surface field of about 360 G (Henrichs et al.2010), a
ChandraandXMM-Newtonstudy by Favata et al. (2009) with pointings at four different rotational phases ofβ Cep failed to detect the expected modulation of X-ray emission. The absence of significant variability strongly constrains the distribution of magnetically confined hot plasma in that system.
In the case of τ Sco, the surface field is slightly stronger at 500 G than forβ Cep and considerably weaker than forθ1
Ori C. The Cohen et al. (2003)Chandrastudy ofτSco claimed variability at the 10% level in the Oviii18.97 Å line (0.654 keV) from an effective exposure of 72 ks that was distributed over an interval of 120 ks, or 3% of the rotation period of the star (see Figure 4 of that paper).τ Sco was also a regular target for the
International Ultraviolet Explorer, and the P Cygni lines of Nv, Siiv, and Civ show variable structure with rotational phase. So, there is motivation for seeking multiple pointings towardτ Sco in an attempt to exploit the “screening” effects afforded by stellar occultation in hopes of ascertaining the location in radius and azimuth of the hot plasma components in this magnetized massive star. A description of the observations and data reduction is presented in Section2, followed by an analysis of the multiphase spectral data in Section3. A discussion of our results is given in Section4with concluding remarks given in Section5.
2. OBSERVATIONS AND DATA REDUCTION
The joint Japan/US X-ray astronomy satellite Suzaku ob-served τ Sco in 2008 August and September at six roughly equally spaced occasions. The pointings with 12–15 ks expo-sure time were spaced approximately 7 days apart to sample one full rotational cycle of the star which hasProt =41.033 days
(Donati et al.2006b). Table1lists the observation IDs and dates of our pointings along with the exposure times in Columns 1, 2, and 4. The other columns in this table will be described later.
Suzaku carries four X-ray Imaging Spectrometers (XIS; Koyama et al. 2007). The field of view (FOV) for the XIS detectors is 17 × 17. One of the XIS detectors (XIS1) is back-side illuminated (BI) and the other three (XIS0, XIS2, and XIS3) are front-side illuminated (FI). The bandpasses are
∼0.4 – 12 keV for the FI detectors and ∼0.2 – 12 keV for
the BI detectors. The BI CCD has a higher effective area at low energies; however, its background level across the entire
NVII OVII FeXVII FeXVII NeIX NeX MgXI MgXII SiXIII SXV
1 2 5
5 . 0
10
−3
0.01
0.1
1
10
normalized counts s
−1 keV
−1
[image:2.612.321.567.58.239.2]Energy (keV)
Figure 1.Spectrum ofτSco obtained by merging the XIS1 spectra obtained on dates HJD 2454696, 2454703, and 2454710 (see Table1), along with a best-fit model (see the text). The vertical error bars correspond to 10σ. Although no spectral lines are resolved, a number of typically prominent emission lines are identified across the top of the figure.
bandpass is higher compared to the FI CCDs. The XIS2 detector was not used in our τ Sco observations owing to technical difficulties. Cleaned event files were used to extract the spectra for the science analysis. Response matrices were generated for each detector and each pointing using the latest versions of software and the most recent calibration files.
The angular resolution of the X-ray telescope on board
Suzaku is ≈ 2; and so in the XIS imaging, τ Sco was not distinctly resolved from the nearby X-ray source 1RXS J163556.0-281149. According to the recommendations given in the Suzaku ABC guide8 for spectral analysis, the spectra
were extracted from a 260 arcsec region. Inspection of XMM-Newton images shows that three serendipitous X-ray sources are present in the spectrum extraction region. The count rates of these sources are a few hundreds of times lower than the count rate of τ Sco. No variations in the X-ray emissions of the two sources located within 2 arcmin ofτSco were reported from previousXMM-Newtonor Chandraobservations (Mewe et al.2003; Cohen et al.2003). Therefore, we believe that the extracted spectra are truly representative of the X-ray emission ofτ Sco. However, the intrinsic variability of the serendipitous sources cannot be excluded a priori.
The background was extracted from an annulus around the source for all six data sets. The presence of faint point sources in the background regions cannot be excluded (as seen in the
XMM-Newtonimages). However, checks were performed using various background regions selected in different parts of the
Suzaku FOV, and it was determined that the influence of the background on theτ Sco spectrum is negligible.
3. ANALYSIS
3.1. X-ray Spectra
Spectra that were obtained at different phases were found to be quite similar. The spectral fitting softwarexspec(Arnaud
1996) was used for modeling the data. Based onχ2fits, there
is little evidence for statistically significant differences between the six spectra obtained at the different pointings. Given the similarity of the spectra, we merged the first three spectral data
IGN
A
CE
ET
AL.
V
ol.
[image:3.612.46.740.266.361.2]721
Table 1
SuzakuObservations ofτSco
ObsID HJD–2454696 Phase Exposure XIS0 XIS1 XIS3
(days) φ (ks) C˙T C˙S C˙H C˙T C˙S C˙H C˙T C˙S C˙H
No. 2, 2010 A MULTIPHASESUZAKUSTUDY OF X-RAYS FROMτ Sco 1415
Table 2 Spectral Fit Parameters
Component kT EM
(keV) (1053cm−3)
1 0.11±0.01 17.0±2.6
2 0.34±0.01 10.4±0.5
3 0.71±0.01 7.2±0.3
4 1.52±0.06 5.2±0.3
sets obtained with XIS1 to achieve higher signal to noise. The resulting spectrum is shown in Figure1. The model spectral fit for this merged set is quite similar to fits obtained for the spectra from the individual pointing.
A good fit to the spectrum was obtained with a four temper-ature thermal plasma model (vapec) corrected for interstellar absorption (tbabs). Abundances were taken as solar (Asplund et al.2009), except for C at 0.5 solar, N at 1.4 solar, and oxygen at 0.7 solar. These values are similar to the abundances derived by Morel et al. (2008) in their study of UV and optical spectra ofτ Sco. Also, a ratio N/O of twice solar is in good agreement with the analysis ofXMM-Newtonspectra ofτ Sco by Mewe et al. (2003). In fact, the good agreement betweenSuzakuand
XMM-Newtonspectra shows that theSuzakudata are not seri-ously affected by the unresolved X-ray sources in the vicinity ofτ Sco. These assumptions lead to fits that have good statis-tics and provide a convenient framework for characterizing and comparing spectra at different rotational phases.
The best-fit parameters found from fitting the spectra are shown in Table2. The hydrogen column density was fixed at a value ofNH =3×1020 cm−2from Diplas & Savage (1994).
It is interesting to compare the temperature components from ourSuzakufits to those of previous studies. AnASCAspectrum reported by Cohen et al. (1997) was fit with a three-temperature component model. The EM-weighted average temperature of that fit was kTASCA ≈ 1 keV. Ours is much lower at
kTSuz ≈ 0.5 keV. TheXMM-Newton study by Mewe et al.
(2003) iskTXMM ≈0.7 keV from their RGS data. However,
those authors find evidence for a hotter component from the EPIC spectrum. In theirChandrastudy ofτ Sco, Cohen et al. (2003) do not present temperature component fits; however, they do comment that there is little evidence for hot plasma in excess of 27 MK that was seen byASCA. Following this, they note thatASCAhas greater sensitivity at higher energies than doesChandra. In their study of differential EMs for hot massive stars, Wojdowski & Schulz (2005) note that the peak of the EM distribution forτ Sco is around 10 MK or 0.8 keV.
The XIS detectors have even greater area than the
ASCA-SIS detector did, and yet the XIS1 spectrum fails to show a significant contribution from the Sxvemission line. The total EMs derived from the ASCAdata and from our Suzaku data are actually quite comparable, with values of≈49×1053cm−3
and≈40×1053cm−3, and yet it appears that the characteristic
temperature during our pointings withSuzakuis about half as large as when theASCAdata were obtained.
3.2. Broadband Variability
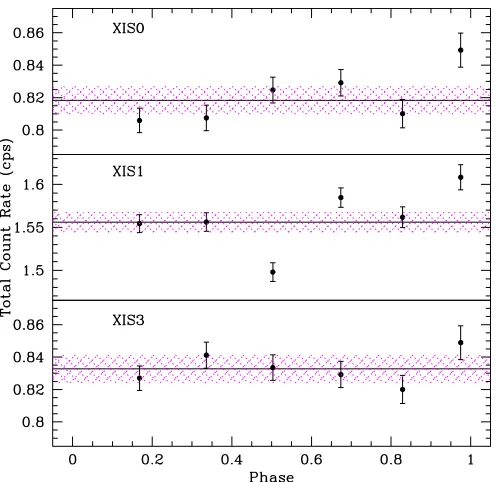
[image:4.612.70.267.72.147.2]Our primary objective was to search for evidence of stellar occultation effects on the X-ray emissions in an attempt to constrain the location where the soft and hard components are formed. Since the spectra show no obvious variations between pointings, we have produced total count rate light curves. With
Figure 2.Total count rates from Table1plotted against rotational phase. The colored hashed region represents the rms error of the data, as described in the text.
(A color version of this figure is available in the online journal.)
a relatively complex distribution of closed and open field lines, we expected to observe variability with rotational phase.
An ephemeris for the rotation of the field configuration with Heliocentric Julian date (HJD) is given by Donati et al.
(2006b) as
T(HJD)=T0+PE, (1)
whereT0(HJD)=2453193.0, the periodP =41.033±0.002
days, andEis the cycle value. All of our data fell within the same epoch of rotational cycle 1255. Rotational phase values within this cycle number are listed in Column 3 of Table1. Note that Donati & Landstreet (2009) show more recent magnetic maps forτ Sco (see their Figure 4). The most recent of those was taken at about 50 days before theSuzaku pointings. The field has remained stable since the discovery report of Donati et al. (2006b), indicating that any accumulated systematic errors in rotational phases for theSuzakudata are less than 2%.
Spectra for the three detectors with each pointing were summed to obtain total bandpass count rates, C˙T, in counts
per second (cps). These are listed in the last three columns of Table1 and plotted in Figure 2. The horizontal lines in each panel represent the mean of the data, as computed via
˙ Cav=
˙
Ci/σi2
1/σ2 i
, (2)
where{σi}are the error values given in Table1. Note that the
error in the mean is given by
σav= 1 6
σ2
i, (3)
for six data points obtained with each detector. The resultant means and their errors are given in Column 2 of Table3.
The hashed regions in Figure2represent the rms errorsσrms
for each data set as given by
σrms=
1 6
σ2
Figure 3.Comparison of the areal sensitivities of the XIS0 and XIS3 detectors with XIS1. Top shows the XIS1 detector response in red, whereas blue is for XIS0/XIS3. A percent difference of these is plotted in the middle panel. At bottom is an illustration of several spectra from XIS1 (higher count rate in black) and XIS3 (lower count rate in green). The vertical dashed line demarcates the soft and hard bands used in our analysis.
[image:5.612.319.566.53.293.2](A color version of this figure is available in the online journal.)
Table 3
Statistical Analysis of the X-ray Data
Detector C˙av χν2(C˙) HRav χν2(HR)
(cps)
XIS0 0.8184±0.0035 1.82 1.543±0.029 1.92
XIS1 1.556±0.005 3.09 0.812±0.005 0.69
XIS3 0.8327±0.0035 1.13 1.490±0.011 1.53
Given that the errors in the data are all very similar, the rms error closely represents the values of the individual measures that determine the respective means.
Although OB stars do show hot gas components, the hard emission is not seen with the relative strength at which it appears inτSco (exceptions being OB stars that are strongly magnetic or in colliding wind binary systems). Thus, it is natural to associate the hot components seen fromτ Sco with processes involving the star’s magnetism. Then, the dominant soft emission most likely arises from nominal wind shock phenomena as occurs in other OB winds. Since an analysis of He-like ions that form at high temperatures indicates a formation location of about 1R∗ above the photosphere (Cohen et al.2003), we therefore anticipated that periodic rotational modulation would affect the hard X-rays owing to stellar occultation, whereas any variability of soft X-rays would be mostly stochastic (e.g., Oskinova et al.
2001). Consequently, we have defined “soft” and “hard” bands as illustrated in Figure 3. The upper panel displays the area sensitivity of the BI detector (XIS1) as the upper curve in red and of the FI detector as the lower curve in blue. The middle panel shows the percent difference of these. For reference, the lower panel displays a sample of the XIS1 spectra of τ Sco (brighter points with black dots) and XIS3 spectra (fainter with green dots). The vertical dashed line demarcates the soft and hard bands. Its placement at 0.95 keV was motivated by the
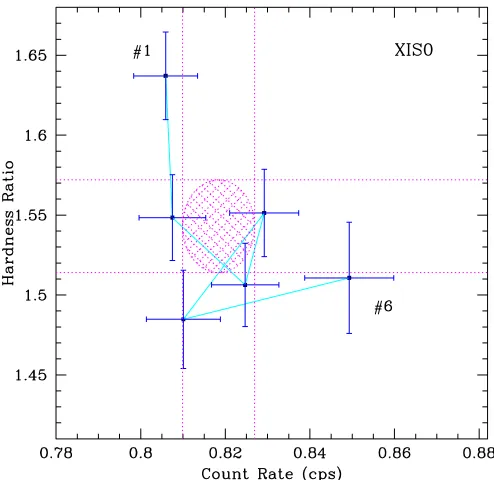
Figure 4.Plot of the HR as defined in the text plotted against the total count rate of the XIS0 data ofτSco. The hashed region is the rms error ellipse for these data. A line connects the data points in chronological and phase sequence, with #1 and #6 marking the first and last of the pointings (see Table1).
(A color version of this figure is available in the online journal.)
following. (1) The boundary falls roughly midway along the decline in relative sensitivity, from the FI chips being about 75% more sensitive than the BI chips in the soft band to only 25% on average in the hard one. (2) There are roughly equal counts above and below the boundary, so that count rate errors will be similar. (3) The boundary falls at energies just below several strong emission lines.
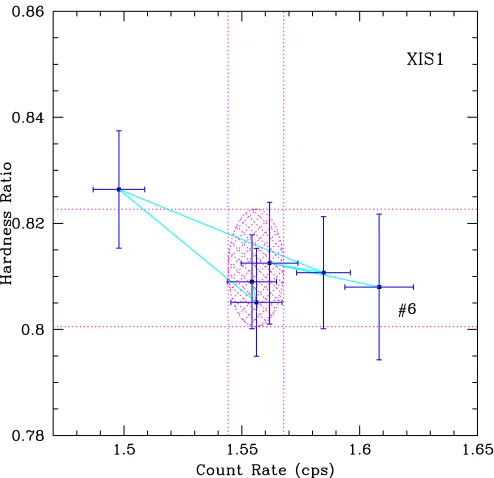
With these two bands, we introduce the hardness ratio HR= ˙CH/C˙Sas a ratio of the hard band count rate to that of the
soft band. Figures4–6plot HR values against the total count rate for each detector. An error ellipse is shown for reference. This is the rms error ellipse with a center that is the mean of the HR and the total count rate. Vertical and horizontal lines that are tangent to the error ellipse are shown as a visual reference. A light blue line connects the points in chronological and phase order, with the first (#1) and last (#6) pointings indicated, except for XIS1 where several points fall too close together to label clearly which is first.
Table3summarizes the mean valuesC˙avand HRavderived
from the data and the associated errors in the means. Also tabulated are reduced chi-square values χ2
ν with ν = 5 for
the null hypothesis of no intrinsic source variability. Recall that there is a 7.5% chance of achieving χν2 = 2 in the null hypothesis, but only a 1% probability of achievingχ2
ν =3. It
thus seems likely that we have detected variability of the total count rate in the XIS1 detector, but less so for XIS0 or XIS3 (however, see the discussion below about the high count rates for the last phase pointing). Despite variability in the count rate, the HRs for XIS1 are remarkably stable. The spread in HR values for XIS0 and XIS3 is larger than for XIS1, although this greater spread is not very statistically significant.
A primary culprit for the variability detected in XIS1 is the third pointing near phase φ ≈ 0.5 as seen in Figure 2. Here
˙
[image:5.612.43.295.394.455.2]No. 2, 2010 A MULTIPHASESUZAKUSTUDY OF X-RAYS FROMτ Sco 1417
Figure 5.As in Figure4, but for XIS1. Note that data points are too closely spaced to clearly mark the first pointing.
(A color version of this figure is available in the online journal.)
indicate variability at the softer energies detectable by XIS1, where XIS0 and XIS3 have less areal sensitivity, especially below 0.5 keV (see Figure3). The suggestion is made more plausible by recognizing that in Figure5, the lowest count rate pointing of XIS1 corresponds to the highest HR value. Since HR is a ratio of hard to soft, a reduction in the soft count rate would increase the value of HR.
We have made a comparison of the XIS1 spectrum for the low count rate point at φ ≈ 0.5 against spectra obtained at other phases. By binning XIS1 spectra for different pointings and overplotting them against the low count rate pointing at φ = 0.50, a systematic deficit in the count rate between about 0.8–0.9 keV is revealed. Thus, the reduced count rate forφ=0.50 along with a slight increase in HR is not simply a “drop-out” in emission within a narrow energy band, but reflects a somewhat distributed reduction in emission that lies below 1 keV near the peak of the spectrum. Note that we also considered variability in the EMs of the four temperature components. In doing so, the four values ofkTwere held fixed, as well as the hydrogen column density. Indeed, the EMs of the two lower temperature components are more variable than those of the two high temperature ones, as expected.
Interestingly, theASCAdata that show evidence of a consid-erably higher temperature component than was detected with
Suzakuoccur at a phase of ≈0.45. However, the discrepancy may be a reflection of longer term or stochastic variability ef-fects unrelated to the rotation period ofτ Sco.
It is also worth noting that all three detectors show rather high count rates at the last rotational phase. Deviations from the mean occur at the level of 3.4σ for XIS0, 2.2σ for XIS1, and 2.0σ for XIS3. The joint probability for this situation based on each light curve having independently a normal distribution of data points is≈10−7. Interestingly, Figures4–6do not indicate
[image:6.612.318.565.54.305.2]that the HR values are particularly anomalous. With all three detectors showing high count rates by amounts of 3.7%, 3.3%, and 2.0%, respectively, with essentially nominal values of HR, we suggest that the increased count rate is intrinsic to the source
Figure 6.As in Figure4, but for XIS3.
(A color version of this figure is available in the online journal.)
and essentially “gray” in character. Such a variation might result from an increase of hot plasma density or volume filling factor.
4. DISCUSSION
The critical conclusions from previous X-ray studies are as follows. The X-ray lines of τ Sco are strikingly narrow. The X-ray spectrum is dominated by a soft component, rather typical of other hot stars. There is an abnormally strong hard component present as well, and this hard component in excess of 10 MK has been seen byROSAT,ASCA,Chandra, XMM-Newton, andSuzaku. Moreover, the implied EM for the X-ray-emitting plasma is around 5×1054 cm−3. As pointed out by Cassinelli et al. (1994), this competes with the EM available in the entire wind. Of course, it is not possible that the entire wind be at 1–10 MK since UV P Cygni lines of lower ions are observed. In fact, the problem is somewhat exacerbated by the expectation that in the standard wind shock model of line-driven winds, shocked hot plasma only begins to be generated at 1.1–1.5 stellar radii into the wind, implying that even less wind EM is available from which to generate the observed X-rays. This problem of large EMs for B star X-rays was highlighted in Cohen et al. (1997).
Figure 7.Structure of magnetic field lines at rotation phases 0.17, 0.34, and 0.50 (top, left to right) and 0.67, 0.83, and 0.97 (bottom, left to right). Closed field lines are shown in white, while open field lines are shown in blue.
(A color version of this figure is available in the online journal.)
The strong field limit has scored successes in understanding stars like θ1 Ori C and σ Ori E where X-ray data and UV
and optical emission lines can be accurately modeled within a framework of a magnetically dominated wind flow. Less clear is how modest field strengths impact observables. Although Henrichs et al. (2005) have reported on correlations between periodic UV P Cygni line variability with the incidence of magnetism, Petit et al. (2009) suggest that the X-ray properties of early-type stars are not so obviously correlated with the presence of surface magnetism.
Our expectation is that the many unusual features ofτSco are somehow related to the presence of its magnetic field. Therefore, the starting point for any analysis should begin with the field topology. We possess a model for the magnetic field topology as extrapolated from the surface magnetograms acquired through Zeeman–Doppler imaging (Donati & Collier-Cameron 1997; Donati et al.1997,1999,2003). The extrapolation is performed using the “Potential Field Source Surface” method of Altschuler & Newkirk (1969) that has been used to extrapolate the Sun’s coronal field from solar magnetograms. A code is used that was originally developed by van Ballegooijen et al. (1998). Since the method has been described in Jardine et al. (2002), only a brief outline of the method is provided here.
The magnetic fieldBis written in terms of a flux functionΨ such thatB= −∇Ψ, so the condition that the field is potential (i.e.,∇×B=0) is satisfied automatically. The requirement that the field is divergence free then reduces to Laplace’s equation
∇2Ψ=0 with solution in spherical coordinates (r, ϑ, ϕ) given
by
Ψ=
N
l=1
l
m=−l
[almrl+blmr−(l+1)]Plm(θ)eimϕ, (5)
where the associated Legendre functions are denoted byPlm.
The coefficients alm andblm are determined by imposing the inferred radial field at the surface from the Zeeman–Doppler maps and by assuming that at some heightRsabove the surface (known as thesource surface), the gas pressure overcomes the ability of the magnetic field to confine it. Thus at the source surface, the field lines open up to become purely radial, and henceBθ(Rs)=0.
An illustration of the viewable field topology at the rotational phases of our pointings is shown in Figure 7. Along the top, from left to right, are phases 0.17, 0.34, and 0.50; at bottom the phases are 0.67, 0.83, and 0.97 from left. In these figures, the blue curves correspond to open magnetic field lines, and the white ones are closed loops. There is a dominant torus-like structure of closed field lines around an axis that is nearly perpendicular to the rotation axis. And on one hemisphere, there is a “mushroom-like” bundle of closed fields. This bundle feature is best perceived off the right limb for the middle bottom panel at phaseφ=0.83. Atφ=0.50 and 0.67, the “mushroom” lies most nearly forefront of the star, and nearly the entire torus region can be viewed.
No. 2, 2010 A MULTIPHASESUZAKUSTUDY OF X-RAYS FROMτ Sco 1419
magnetic geometry) and the plasma pressure at the coronal base (which determines the plasma structure). As an example, for a corona at 2×10⁷K and closed loops that extended no further than one stellar radius above the surface, they concluded that the closed loops alone could provide an EM of a few times 1054cm−3with a 40% rotational modulation.
OurSuzakuXIS pointings reveal a spectrum that is predomi-nantly soft, with a notable hard component, as has been consis-tently observed by other instruments. For the phases of 0.50 and 0.67, the “mushroom” of closed magnetic loops would be most nearly forefront, and yet somewhat surprisingly, no increase in hard X-rays was detected. Instead, we find that the XIS0 and XIS3 show little evidence for variability, but that the XIS1 de-tector with about twice the sensitivity of the other dede-tectors has a drop in total count rate near phaseφ≈0.5, with a 3.7σ devi-ation from the mean. From a comparison between XIS1 spectra at different pointings, there appears to be a slight deficit in soft emission atφ ≈0.5 at energies below 1 keV as compared to other pointings. This is suggested in Figure5, where the low-est count rate for XIS1 also has the highlow-est HR ratio. We also note that all three detectors show an essentially “gray” increase in count rate at phase 0.98 by about 3%, which corresponds to a time when the “mushroom” bundle of closed field lines is occulted by the star.
Why is the hard emission not more variable? The HR values for XIS1 are amazingly stable, and although HR values show greater dispersion for XIS0 and XIS3 detectors than for XIS1, their variability is not statistically especially significant. Our ex-pectation was that the hard emission would form in the vicinity of the photospheric magnetic field, which asymmetrically dis-tributed about this slowly rotating star. We therefore predicted that a rotational modulation could arise from stellar occultation. If the bulk of the hard emission were to form at a characteristic radiusrhard, then the geometric dilution factor
W(r)= 1 2
1−
1−R2
∗/r2
(6)
represents the areal fraction of a spherical shell of that radius that is occulted by the star, thusΔΩocc/4π =W(rhard). If the hottest
plasma forms characteristically atrhard ≈2R∗ as indicated by
the Chandraanalysis of Cohen et al. (2003), then a fraction W ≈7% of the source region would be occulted if spherically symmetric.
If all of the X-rays were associated with the magnetic field of τSco and generated at 2R∗, then given the distributed nature of the field reconstruction as shown in Figure7, one might expect
Wto represent a characteristic scale of X-ray variability on the rotation phase. But this is a vastly oversimplified picture. In reality, τ Sco has a complex field topology that is relatively strong which can alternately confine wind plasma in closed loops and modify wind flow in sectors of open field lines. There are a variety of emissive components at varying heights above the photosphere as a function of latitude and azimuth about the star. It is the recognition of these complexities that motivate the detailed field reconstruction presented in Jardine et al. (2002) and that was briefly summarized above.
With its higher sensitivity, we interpret the modest variability in the total count rate of XIS1 with relatively little change in the hard spectrum as a moment constraint on the complex integral relations involving geometry and emissive components that determine the observed emission from an unresolved source. The overall relative absence of variability with phase should provide useful constraints for future modeling efforts that take
into account both the wind flow on open field lines and confined plasma in closed field loops.
In addition, a recent development is the identification ofτ Sco analogues. For a long time, the combination of unusual properties displayed by τ Sco had been unique. This may no longer be the case. The early B stars HD 66665 and HD 63425 had been noted to show unusual UV lines similar to τ Sco (D. Massa 2010, private communication). Recently, magnetic fields have been detected in these two stars by the MiMeS collaboration9 (V. Petit et al. 2010, in preparation). It would be useful to learn if these two stars are also hard X-ray emitters. If so, thenτ Sco would no longer be a class unto itself, and the key to understandingτ Sco may derive from studies of this set of three stars.
5. CONCLUSIONS
In Donati et al.’s (2006b) discovery paper ofτ Sco’s mag-netism, the authors predicted that X-ray modulations on the rotation period of the star could be as much as∼40%. In par-ticular, two main eclipses were expected at phases of around 0.3 and 0.8 in conjunction with observed enhanced UV line ab-sorptions at those times. Our pointings include phases close to those targets, but no variations anywhere near that amplitude were detected. It is possible that strong variability could have been missed if it had occurred in a relatively short interval of phase. However, rapid and high amplitude variability would ap-pear to run counter to expectations based on the UV data. Donati et al. noted that an absence of the predicted high-amplitude X-ray modulation could be an indicator of smaller scale magnetic loops and confined hot gas across the stellar surface. Such loops would have evaded detection in their study.
The most unexpected result of our study is that there is greater variability of the soft X-ray component than of the hard one. We nominally expected the soft emission to be associated with wind shocks similar to OB stars, and the unusually bright hard emission to be associated with the star’s magnetic field. With closed loops extending out to a few stellar radii, variability of the hard emission was supposed to occur as a result of stellar occultation of the rotating magnetosphere; instead, the more sensitive XIS1 detector shows a statistically significant low count rate event because the soft component drops more than the hard one. This came as a surprise.
It thus appears that more effort will be needed to clarify the nature ofτ Sco’s hard emission. Although the observed soft component is relatively nominal for a massive star wind ofτ Sco’s early B spectral type, the standard wind shock theory most certainly does not predict large EM well in excess of 10 MK (e.g., Lucy1982; Owocki et al.1988; Feldmeier et al.1997). Our
Suzakustudy has not, in itself, resulted in a definitive explanation of how (or where)τ Sco’s hard emission is produced. There are a number of possible models that could be employed to interpret the newSuzakudata in conjunction with data from other wave bands, such as the unusual UV P Cygni line shapes. We suggest that additional multiwavelength monitoring will be crucial for formulating a full picture of the circumstellar environment of τ Sco.
In particular, the phase coverage of our Suzaku study is still sparse. Plus, it would be valuable to have multi-epoch data to determine whether the high count rates near phase 0.98 persists. In addition, the presence or absence of linear polarization would help to define the wind structure and/or the
photospheric brightness distribution at inner wind radii. At IR wavelengths Brackett lines have been observed to be in emission whereas Hα is in absorption for τ Sco (Waters et al. 1993). Although originally interpreted as a low density disk, Zaal et al. (1999) have suggested that the Brackett line emission could result from NLTE effects in the atmosphere ofτ Sco. A study of variability in these lines would help to determine their origin and place additional constraints on the density and temperature stratification that could be used in conjunction with the Zeeman maps and the X-ray and UV data to produce a more coherent picture of theτ Sco environment.
We gratefully acknowledge an anonymous referee who made comments that improved this paper. We thank theSuzakuteam for performing this observation and providing software and cali-bration for the data analysis. Thanks also to theSuzakuhelpdesk, especially K. Hamaguchi, for their assistance. This research has made use of NASA’s Astrophysics Data System Service and the SIMBAD database, operated at CDS, Strasbourg. This research was supported in part by NASA grant NNX09AH24G (RI) and DLR grant 50OR0804 (LMO).
REFERENCES
Alecian, E., et al. 2008,A&A,481, L99
Altschuler, M. D., & Newkirk, G., Jr. 1969,Sol. Phys.,9, 131
Arnaud, K. A. 1996, in ASP Conf. Ser. 101, Astronomical Data Analysis Software and Systems V, ed. G. Jacoby & J. Barnes (San Francisco, CA: ASP),17
Asplund, M., Grevesse, N., Sauval, A. J., & Scott, P. 2009,ARA& A,47, 481
Babel, J., & Montmerle, T. 1997a,ApJ,485, L29 Babel, J., & Montmerle, T. 1997b, A&A,323, 121
Cassinelli, J. P., Cohen, D. H., MacFarlane, J. J., Sanders, W. T., & Welsh, B. Y. 1994,ApJ,421, 705
Cohen, D. H., Cassinelli, J. P., & Waldron, W. L. 1997,ApJ,488, 397 Cohen, D. H., de Messieres, G. E., MacFarlane, J. J., Miller, N. A., Cassinelli,
J. P., Owocki, S. P., & Liedahl, D. A. 2003,ApJ,586, 495 Diplas, A., & Savage, B. D. 1994,ApJS,93, 211
Donati, J.-F., Babel, J., Harries, T. J., Howarth, I. D., Petit, P., & Semel, M. 2002,MNRAS,333, 55
Donati, J.-F., & Collier-Cameron, A. 1997, MNRAS,291, 1
Donati, J.-F., Collier-Cameron, A., Hussain, G., & Semel, M. 1999,MNRAS, 302, 437
Donati, J.-F., Howarth, I. D., Bouret, J.-C., Petit, P., Catala, C., & Landstreet, J. 2006a, MNRAS,365, L6
Donati, J.-F., & Landstreet, J. D. 2009,ARA&A,47, 333
Donati, J.-F., Semel, M., Carter, B. D., Rees, D. E., & Collier-Cameron, A. 1997, MNRAS,291, 658
Donati, J.-F., et al. 2003,MNRAS,345, 1145 Donati, J.-F., et al. 2006b, MNRAS,370, 629
Favata, F., Neiner, C., Test, A. P., Hussain, G., & Sanz-Forcada, J. 2009,A&A, 495, 217
Feldmeier, A., Oskinova, L. M., & Hamann, W.-R. 2003,A&A,403, 217 Feldmeier, A., Puls, J., & Pauldrach, A. W. A. 1997, A&A,322, 878 Gagn´e, M., Caillault, J.-P., Stauffer, J.-R., & Linsky, J.-L. 1997,ApJ,478,
L87
Gagn´e, M., Oksala, M. E., Cohen, D. H., Tonnesen, S. K., ud-Doula, A., Owocki, S. P., Townsend, R. H. D., & MacFarlane, J. J. 2005,ApJ,628, 986 Henrichs, H. F., Schnerr, R. S., & ten Kulve, E. 2005, in ASP Conf. Ser. 337,
The Nature and Evolution of Disks Around Hot Stars, ed. R. Ignace & K. G. Gayley (San Francisco, CA: ASP),114
Henrichs, H. F., et al. 2010, in Magnetic Fields of Chemically Peculiar and Related Stars, ed. Y. V. Glagolevskij & I. I. Romanyuk (Moscow: Spec. Astrophys. Obs.), 57
Howk, J. C., Cassinelli, J. P., Bjorkman, J. E., & Lamers, H. J. G. L. M. 2000,ApJ,534, 348
Hubrig, S., Scholler, M., Schnerr, R. S., Gonzalez, J. F., Ignace, R., & Henrichs, H. F. 2008,A&A,490, 793
Jardine, M., Collier-Cameron, A., & Donati, J.-F. 2002, MNRAS, 333, 339
Jardine, M., Wood, K., Collier-Cameron, A., Donati, J.-F., & Mackay, D. H. 2002,MNRAS,336, 1364
Koyama, K., et al. 2007, PASJ,59, S23
Lamers, H. J. G. L. M., & Rogerson, J. B., Jr. 1978, A&A,66, 417 Lucy, L. B. 1982,ApJ,255, 286
MacFarlane, J., & Cassinelli, J. P. 1989,ApJ,347, 1090
Mewe, R., Raassen, A. J. J., Cassinelli, J. P., van der Hucht, K. A., Miller, N. A., & Gudel, M. 2003,A&A,398, 203
Morel, T., Hubrig, S., & Briquet, M. 2008,A&A,481, 453
Oskinova, L. M., Feldmeier, A., & Hamann, W.-R. 2004,A&A,422, 675 Oskinova, L. M., Ignace, R., Brown, J. C., & Cassinelli, J. P. 2001,A&A,373,
1009
Owocki, S. P., Castor, J. I., & Rybicki, G. B. 1988,ApJ,335, 914 Owocki, S. P., & Cohen, D. H. 2001,ApJ,559, 1108
Owocki, S. P., & Cohen, D. H. 2006,ApJ,648, 565
Petit, V., Wade, G. A., Drissen, L., Montmerle, T., & Alecian, E. 2009, in IAU Symp. 259, Cosmic Magnetic Fields: From Planets, to Stars and Galaxies, ed. K. G. Strassmeier, A. G. Kosovichev, & J. Beckman (Cambridge: Cambridge Univ. Press),449
Rogerson, J. B., Jr., & Lamers, H. J. G. L. M. 1976, Mem. Soc. R.Sci. Liege,6, 215
Rogerson, J. B., Jr., & Upson, W. J., II 1978,ApJS,38, 185 Schnerr, R. S., et al. 2008,A&A,483, 857
ud-Doula, A., & Owocki, S. P. 2002,ApJ,576, 413
van Ballegooijen, A., Cartledge, N., & Priest, E. 1998,ApJ,501, 866 Wade, G. A., et al. 2009, in IAU Symp. 259, Cosmic Magnetic Fields: From
Planets, to Stars and Galaxies, ed. K. G. Strassmeier, A. G. Kosovichev, & J. Beckman (Cambridge: Cambridge Univ. Press),333
Waters, L. B. F. M., Marlborough, J. M., Geballe, T. R., Oosterbroek, T., & Zaal, P. 1993, A&A,272, L9
Wojdowski, P., & Schulz, J. P. 2005,ApJ,627, 953