ISSN Print: 2151-1950
DOI: 10.4236/jgis.2019.116039 Nov. 13, 2019 633 Journal of Geographic Information System
Integration of Location-Allocation and
Accessibility Models in GIS to Improve Urban
Planning for Health Services in Al-Madinah
Al-Munawwarah, Saudi Arabia
Ashraf Abdelkarim
Research Center, Ministry of Housing, Riyadh, KSA
Abstract
In this study, accessibility and location-allocation models have been inte-grated into GIS to improve spatial planning and environmental sustainability of health services in Al-Madinah Al-Munawwarah. This integration provides a planning framework in order to check the efficiency of the spatial allocation of health services and to generate alternatives either by proposing an active service or to improve an existing one. To achieve these objectives, the acces-sibility to the service area was analyzed within the analysis of health services networks, which are divided into eight types: public hospitals, specialized hospitals, health units, healthcare centers, infirmaries, clinic complexes, the Red Crescent Center, and ambulance facilities, with time intervals of (5 mi-nutes - 10 mimi-nutes - 15 mimi-nutes) to access coverage ranges, and the loca-tion-allocation model was used based on the maximum coverage model within a response time not exceeding 15 minutes, The results of the study re-vealed the poor distribution of health services Al-Madinah Al-Munawwarah suffers from weak accessibility to health services coverage areas and is unable to meet the needs of its population at present. The current need for health services reached twenty-four locations, including two public hospitals, three specialized hospitals, two health centers, three ambulance facilities, four in-firmaries, three clinic complexes, four health units, and three Red Crescent centers.
Keywords
Urban Planning, Health Services, Accessibility, Location-Allocation Models, Geographic Information Systems, Spatial Distribution Efficiency and Equity How to cite this paper: Abdelkarim, A.
(2019) Integration of Location-Allocation and Accessibility Models in GIS to Improve Urban Planning for Health Services in Al- Madinah Al-Munawwarah, Saudi Arabia. Journal of Geographic Information System, 11, 633-662.
https://doi.org/10.4236/jgis.2019.116039
Received: October 19, 2019 Accepted: November 10, 2019 Published: November 13, 2019
Copyright © 2019 by author(s) and Scientific Research Publishing Inc. This work is licensed under the Creative Commons Attribution International License (CC BY 4.0).
DOI: 10.4236/jgis.2019.116039 634 Journal of Geographic Information System
1. Introduction
In recent years, the evaluation and planning of health services have received wide attention on the regional and urban scale because of its obvious impact on human development that requires efficient performance, which helps the city to perform its functions and activities successfully [1] [2] [3] [4]. Increasing the ef-ficiency of health services and creating a developed residential environment has its effect on economic development. Demand for rational and accessible health-care location planning has attracted widespread attention from researchers, planners, government agencies, especially with the global trend of massive pop-ulation growth, increasing disease and environmental degradation. The prob-lems of selecting health services locations have become increasingly noticeable in human society [5] [6], which hinder economic growth, as well as increase mor-tality rates in some developing cities. The treatment technology and medical equipment for most of the hospitals may not meet demand because of the un-derdeveloped economy [7]. Therefore, the completion of basic healthcare ser-vices should be prioritized in cities as a vital element in strategic management.
The integration of location-allocation and accessibility models provides a frame- work for investigating the use of health services and generating alternatives ei-ther to propose an effective service or to improve health services [8]. Accessibil-ity to health services indicates the relative ease with which health services can be accessed from a particular location [9] [10]. Many factors may affect access to health services, such as the availability of health services in the region (supply), the size of the population in the area (demand), geographical barriers between supply and demand, and others [11].
The allocation of spatial balance of public utilities is an effective approach to maximize social welfare through rational allocation of public resources [12]. The manner of balancing equity and efficiency is an important step to achieving spa-tial balance in the distribution of public service resources [13]. However, in many circumstances during the city development process, the authorities con-cerned tended to focus more on equality or efficiency at certain stages of devel-opment, taking into account the level of social and economic development. The geographical redistribution of health services is the necessary approach to cor-rect the misallocation of service resources. Moreover, converting public hospitals allocation from relatively sharp spatial variation to moderate equilibrium has become a major focus in some domains in recent years such as planning, man-agement, and geography [14] [15] [16].
DOI: 10.4236/jgis.2019.116039 635 Journal of Geographic Information System decisions taken by governments or local leaders are often far from ideal.
It is a well-known fact that basic healthcare services cannot reach the majority of the population because of poor geographic access unless quantitative loca-tion-allocation and GIS models are used. The city’s urban expansion, infrastruc-ture development, and changes in population density affect the spatial distribu-tion of health services, and the above challenges make the use of effective health services more difficult [19].
Researchers have many interests in studies of health services; some of them are interested in highlighting the pattern of geographical distribution of health services, and then evaluating this pattern through the study of the characteristics of beneficiaries and analysis of obstacles affecting the efficiency of these services and location selection and the impact of the location on various medical facilities
[20] [21]. Bennett [22] and Phillips [23], among others, discussed location
selec-tion and the impact of the locaselec-tion on various medical facilities. Another trend was concerned with the spatial distribution of health services in relation to pop-ulation growth rates and the evolution of the number of health service centers [24]. A third trend was concerned with using some theories to assess the distri-bution of health services such as the Central Place Theory and Models of Loca-tion of Facilities to improve accessibility to services and to achieve economic ef-ficiency of distribution [25]. Others were interested in studying the regional availability model [26], nucleus density models, [27], gravity model [28], and gatherings area models [29]. Furthermore, some have turned to the use of GIS-based location-allocation models [30] [31] [32] [33] and spatial analysis and calculation [34]-[39]. Moreover, the construction or improvement of hierarchic-al, random, competitive multi-objective location-allocation models and other complex models have gained great interest from most planners in the last decade
[31] [32] [40] [41] [42] [43].
One of the most important studies on accessibility is the study of Abdulkader [44] on the use of GIS in determining the differences in accessibility to health services in Jeddah. The study tackled the analysis of the service access area with-in the analysis of the road network with-inside GIS environment. Francisco etal.[45] study on the possibility of equitable access to health services in Extremadura (Spain), which examined network and spatial analysis to assess and guide deci-sions on accessibility to health services; and Peter etal.[46] study on emergency services planning using Geographic Information Systems based on geographic accessibility analysis. The study examined the methodology of analyzing the ser-vice access area within the analysis of the road network within the GIS environ-ment.
mea-DOI: 10.4236/jgis.2019.116039 636 Journal of Geographic Information System suring access to primary health care centers in Johannesburg, where the study examined access to primary health care centers in an urban area, using the me-thodology to analyze the service access area in the analysis of road networks within the GIS environment.
As for studies on location-allocation, there is a study by Rahman and Smith [8] on the use of location-allocation models in health service development plan-ning in developing countries. This study tackled the suitability of the loca-tion-allocation models to design health care systems and its importance in re-levance to the problems of overall development in those countries, and the Gus-tavo study [49] on location-allocation models applied to urban public services. The spatial analysis of primary health care centers in Logan, Argentina, where the study examined the spatial analysis of health care centers using allocation models in the GIS software and the identification of suitable locations for the es-tablishment of new health centers for equitable spatial distribution, and the Gina
etal. study [50] on the location-allocation and accessibility models to improve spatial planning for public health services. The study examined the integration of accessibility and location-allocation models in GIS as a proposed strategy for improving spatial planning for public health services.
Tom and Edward’s study [51] on a GIS-based location-allocation model for improving access to health care facilities in Mount Elgon sub-district, the study examined the use of the GIS-based allocation model to improve geographical accessibility to health care services in the Elgon sub-district, and the Irene etal.
study [52] on the improvement of the problem of location-allocation for phar-maceutical warehouses: a case study in Gaziantep, where the study dealt with the improvement of the problem of allocating the locations of pharmaceutical ware- houses by applying to a city (Gaziantep) using the mathematical models P-center and P-median.
Beheshtivar etal.[53] introduced a multi-goal location-allocation model that takes into account four objectives: reducing overall travel cost, unequal access to the clinic, incompatibility of land use in the study area, land acquisition costs and establishment of a facility in optimal locations for new clinics. Weidner and Horner [54] presented a model for the average hierarchy model based on GIS and strategies for spatial improvement to identify relief distribution points, the model aims to reduce travel costs for the different demand levels associated with the appropriate facility providing different relief services.
ac-DOI: 10.4236/jgis.2019.116039 637 Journal of Geographic Information System cessibility models and customizing the site in systems Geographical information. The current study to improve the spatial planning of health services in Al- Madinah Al-Munawwarah emphasizes the hypothesis that neglecting the as-sessment and planning of health services and its integration with accessibility models and location-allocation leads to the shrinking of an essential part of the land use in Al-Madinah Al-Munawwarah and prejudices the requirements of its success. This leads to the lack of a suitable environment to meet the health needs of the population.
This study seeks to determine the efficiency of the spatial distribution of health services and its compatibility with the distribution of residential districts in Al-Madinah Al-Munawwarah, and to verify the functional appropriateness required and propose new locations according to a new and unique approach combines accessibility to assess the efficiency of the spatial distribution of health services and to determine the current and future needs of different health ser-vices in Al-Madinah Al-Munawwarah according to the application of loca-tion-allocation models.
2. Study Area
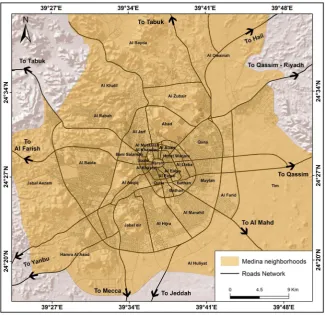
Al-Madinah Al-Munawwarah is located northwest of Saudi Arabia at the con-fluence of longitude 39˚36’E with latitude 24˚28’N and its area is 590 km2. The built area covers about half this area and the city is about 150 km away from the city of Yanbu’ on the Red Sea coast to the west, the latter is the sea gate for the visitors of the city. Al-Madinah Al-Munawwarah is 400 km away from Jeddah, the main port, and it is 980 km away from Riyadh, the capital of the Kingdom
(Figure 1, Figure 2).
Al-Madinah Al-Munawwarah is considered the second most important Is-lamic cities after Holy Mecca. Its importance is derived from the presence of the Prophet’s Mosque; Al-Madinah is also one of the holy cities that non-Muslims are not allowed to visit. Al-Madinah occupies a natural hillside basin more than 600 meters above sea level. The city is surrounded by a group of volcanic moun-tains, with the exception of its northern sides.
The population of Al-Madinah Al-Munawwarah doubled during the period 1974-2019 nearly 7.5 times from 198,055 people in 1974 to 1,487,478 people in 2019 as a result of the natural increase on the one hand and the increase in the population of arrivals. The increase during this period was about 1,289,423 people, and the increase was spread over 45 years, with a growth rate of 4.58% and an average annual increase of 28,654 people during that period. The period 1974-1992 is the highest rate of population growth in the history of Al-Madinah Al-Munawwarah as the annual growth rate has reached 6.44%, while the period 2013-2016 reached the highest average annual increase by 37,224 people.
3. Study Methodology and Data Processing
DOI: 10.4236/jgis.2019.116039 638 Journal of Geographic Information System analysis to assess the current situation of health services in Al-Madinah Al-Mu- nawwarah and determine the coverage area according to the established time in-tervals and analysis of the location-allocation to plan for the future of health ser-vices in Al-Madinah Al-Munawwarah, identify the deficit, and suggest new suitable locations for them if necessary. Network analysis within the GIS envi-ronment is one of the most important tools used for this purpose for its close connection with the road network, which is the main means of transport. Also, some methods of spatial and statistical analysis were used in GIS when evaluat-ing the type of spatial distribution of health services. The methodology of as-sessing and planning health services in Al-Madinah passed through five main stages through a software Arc GIS as shown in Figure 3.
DOI: 10.4236/jgis.2019.116039 639 Journal of Geographic Information System Figure 2.The districts of Al-Madinah in 2019.
Figure 3.Stages and methodology of work followed in the study.
[image:7.595.208.537.416.636.2]conso-DOI: 10.4236/jgis.2019.116039 640 Journal of Geographic Information System lidate outcomes and outputs.
The second stage was the implementation of topological construction on the roads layer in order to look for problems and spatial faults in them and treat them according to spatial controls of the surface network analysis. The third stage dealt with recording the metadata of the road links to the attribute table to function as weights for comparison when analyzing surface networks.
The fourth stage dealt with the construction of the road-network Network Dataset on the road layer after processing and recording weights within the GIS environment. The fifth stage is conducting accessibility analysis based on Ser-vice Area analysis to assess the current situation of the health serSer-vices in Al-Madinah and determine the area of coverage according to time intervals (5 minutes - 10 minutes - 15 minutes). The implementation of analysis comes after the construction of the road network, where the analysis layer is added from the surface network analysis toolbar Network Analysis After activation, the proper-ties of the analysis layer are then defined such as: Impedance Weight (distance or time) and its value, and configuration of outputs on the boundaries of the road network Trim Polygon, and merging the resulting domains (Merge by De-fault Break), after configuring the analysis layer properties.
The spatial location layer for services Facilities has been added inside theNet-work Analysis Window, And nettheNet-work solution Solve to obtain the results, the results were divided on the administrative boundaries of the study area to de-termine the percentage of service coverage from each administrative department and to determine the degree of coverage. Figure 4 shows the constructional model for analyzing the accessibility to health services in Al-Madinah Al-Mu- nawwarah.
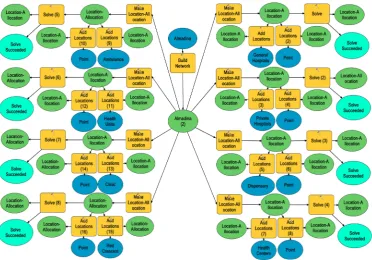
Stage five also included a location-allocation analysis Location-Allocation To plan the future of health services in Al-Madinah, identify the deficit, and suggest new suitable locations for them, if necessary, and the implementation of this analysis comes after the construction of the road network, where the analysis layer is added from the surface network analysis toolbar Network Analysis after it is activated, the properties of the analysis layer (such as the standard of analy-sis Impedance Weight (Distance or time), its value, and the number of allocation services Facilities to Choose, and allocation duration Impedance Cutoff, type of allocation model Location Problem Type. Figure 5 shows the structural model for the analysis of the allocation of the location to health services in Al-Madinah.
The analysis of location-allocation includes seven models [55] [56], and the maximum coverage model [8] has been used, whose formula states:
{
}
Maximize F =
∑
i I∈ a xi i (1)where: I: Set of demand points, a_i: Distance between request coverage limits, viewpoints, time duration, or population as weight, x_i: Site allocation coeffi-cient with only two values (0, 1).
DOI: 10.4236/jgis.2019.116039 641 Journal of Geographic Information System pointsDemand Pointwere added, which are the administrative sections of the study area after they have been converted to a bitmap layer within a window Network Analysis Window, and network solution Solve For the results, addi-tional sites were proposed for the services to be allocated to all administrative departments of the study area.
Figure 4.Structural model for accessibility analysis of health services in Al-Madinah.
[image:9.595.113.486.445.705.2]DOI: 10.4236/jgis.2019.116039 642 Journal of Geographic Information System The study was based on the official government digital sources provided by the Secretariat of Al-Madinah. Almost eleven digital layers were obtained, and they are represented in the layers: the administrative boundaries of Al-Madinah, the ad-ministrative division of Al-Madinah, and the boundaries of districts of Al- Madinah, and the provision of about eight different layers of health services in-cluding hospitals, public hospitals, specialized hospitals, health units, infirmaries, clinic complexes, health centers, Red Crescent centers and ambulance facilities.
4. Results and Discussion
4.1. Accessibility Analysis for Health Services in Al-Madinah
4.1.1. Public Hospitals
The results of the accessibility to public hospitals service during the five, ten and fifteen minute intervals, (Figure 6), revealed that the districts that can access the public hospitals service within five minutes via the road network and according to the speed limit are 88 districts out of the 107 districts in Al-Madinah with a percentage of 82.2% of the total number of Al-Madinah districts. The number of districts that cannot access public hospitals within five minutes are 19 districts which make up 17.8% of the total districts of Al-Madinah and these districts are: Nubala’a, Rahat, Al-Jissah, Bani Bayada, Al-Sharae’, Umm As-Suyouf, Khakh, Al-Muzayin, Al-Naqmi, Al-Sahwa, Al-Sadd Al-Ghaba, Al-Ghaba, Al-Sadeqiya, Al-Mufrahat, the Industrial City, Al-Sahlouj, Al-Balqa’a, Kittaneh and Wadi Al-Hamd, while all districts of Al-Madinah Al-Munawwarah can reach public hospitals in ten minutes, fifteen minutes via the road network according to the speed limit.
4.1.2. Specialized Hospitals
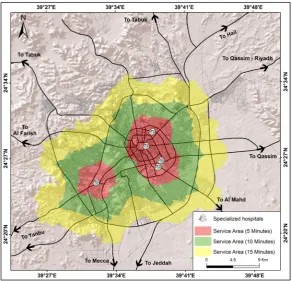
The results of the accessibility to the specialized hospitals service during the in-tervals of five, ten and fifteen minutes, (Figure 7), revealed that the districts that can access the service of specialized hospitals within five minutes through the road network and according to the speed limit are 79 districts out of the total number of the 107 districts in Al-Madinah with a percentage of 73.8%. The number of districts that cannot access the service of specialized hospitals within five minutes is 28 districts which constitute 26.7% of the total districts in Al-Madinah and these districts are: Rahat, Al-Jissah, Sharae’, Umm As-Suyouf, Khakh, Al-Muzayin, Al-Naqami, Al-Matar, Al-Khadra’, Abu Sidr, Sahwa, Sadd Al-Ghaba, Al-Ghaba, Al-Aqoul, Al-Anahi, An-Nakhil, As-Sadeqiya, Al-Mafra- hat, The Industrial City, Wadi Al-Battan, Hududa’, Tayba, Sahlouj, Balqa’, Az-Zahra, Kittaneh, Al-Hafia, and Wadi Al-Hamed, and the number of districts that can reach specialized hospitals services during ten minutes through the road network according to the speed limit are 106 districts of the 107 districts of Al-Madinah which constitute 99.1% of the total districts of Al-Madinah.
DOI: 10.4236/jgis.2019.116039 643 Journal of Geographic Information System reach the service of specialized hospitals within fifteen minutes via the road network and according to the speed limit.
Figure 6.Accessibility to public hospitals based on service area analysis.
[image:11.595.227.520.425.706.2]DOI: 10.4236/jgis.2019.116039 644 Journal of Geographic Information System 4.1.3. Primary Health Centers
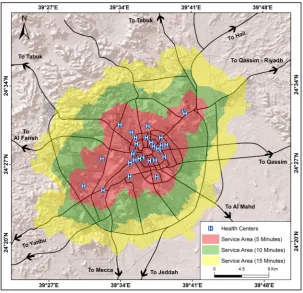
The results of the accessibility of the PHC service during the five, ten and fifteen minute intervals, (Figure 8), revealed that the districts that can access the PHC service within five minutes via the road network according to the speed limit are 90 out of the 107 districts in Al-Madinah which constitutes 84.1% of the total number of districts in Al-Madinah. The number of districts that cannot access the primary health centers within five minutes 17 districts which constitutes 15.9% of the total districts of Al-Madinah which are Al-Jissah, Sharae’, Umm As-Suyouf, Khakh, Al-Muzayin, Al-Naqami, As-Sahwa, Sadd Al-Ghaba, Al-Ma- farahat, The Industrial City, As-Sahlouj, Al-Balqa’, Al-Anahi, Ar-Rummanah, Wadi Al-Battan, Hududa’, and Wadi Al-Hamed while all Al-Madinah districts can access PHC service within time intervals of ten and fifteen minutes through the road network according to the speed limit.
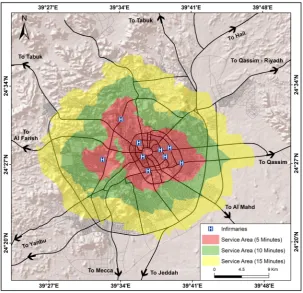
4.1.4. Infirmaries
[image:12.595.222.526.411.704.2]The results of the accessibility to the infirmaries service within the five, ten and fifteen minute intervals, (Figure 9), the number of districts that can access the infirmaries service within five minutes through the road network according to the speed limit is 81 out of the 107 districts in Al-Madinah which constitutes 75.7% of the total number of districts in Al-Madinah. The number of districts that cannot access the infirmaries within five minutes are 26 districts which con-stitutes 24.3% of the total districts in Al-Madinah and these districts are: Rahat,
DOI: 10.4236/jgis.2019.116039 645 Journal of Geographic Information System Figure 9. Accessibility to infirmaries based on service area analysis.
Al-Jissah, Sharae’, Umm As-Suyouf, Khakh, Al-Muzayin, An-Naqami, Al-Matar, Al-Khadra’, Abu Sidr, As-Sahwa, Sadd Al-Ghaba, Al-Mufrahat, the industrial city, As-Sahlouj, Al-Balqa, Bani Bayada, Nubala’, As-Sakb, Ash-Shahba’a, Ash- Shafiyah, “Ayra, Al-Sina’ah, Al-Hasa”, Warkan, and Abu Markhah. The number of districts that can access the infirmaries service within ten minutes via the road network and according to the speed limit are 106 districts out of 107 districts in Al-Madinah which constitutes 99.1% of the total districts in Al-Madinah. The number of districts that cannot access the infirmaries services within 10 minutes is one district which is 0.9% of the total districts in Al-Madinah, which is As-Sahwa district. All of the districts in Al-Madinah can access the infirmaries service within fifteen minutes through the road network according to the speed limit.
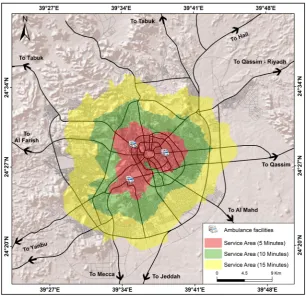
4.1.5. Ambulance Facilities
DOI: 10.4236/jgis.2019.116039 646 Journal of Geographic Information System Al-Anahi, As-Saiqiyah, Al_mifrhat, the industrial city, Wadi Al-Battan, Hadou-da’, AS-Sahlouj, Wadi Al-Hamed, Al-Ghara’, Ar-Roumanah, Nubala’, As-Sakb, Eira, Ash-Shafiyah, Al-Hisa’, Warkan, Ein Al-Kheif, As-Sina’eiah, As-Sikka, Abu Markha, and Katana. The number of districts that can access the ambulance ser-vice within ten minutes via the road network and according to the speed limit is 103 of the 107 districts in Al-Madinah which is 96.3% of the total districts in Al-Madinah, the number of districts that cannot access the ambulance facilities service within ten minutes are four districts which make 3.7% of the total dis-tricts in Al-Madinah and these disdis-tricts are: Abu Sidr, As-Sahwa, As-Sahlouj, and Al-Balqa’, while all districts in Al-Madinah can access the ambulance facili-ties service within fifteen minutes via the road network according to the speed limit.
4.1.6. Clinics Complex
[image:14.595.220.527.408.705.2]The results of the accessibility to the clinics complexes service within five, ten and fifteen minute intervals, (Figure 11), revealed that the districts that can access the clinics complexes service within five minutes via the road network and according to the speed limit are 72 districts of the 107 districts in AL-Madinah which constitutes 67.3% of the total number of districts in Al-Madinah. The number of districts that cannot access the clinics complexes service within five minutes are 35 districts constituting 32.7% of the total dis-tricts in Al-Madinah and these disdis-tricts are: Warhat, Al-Jissah, Ash-Sharae’,
DOI: 10.4236/jgis.2019.116039 647 Journal of Geographic Information System Figure 11.Accessibility to clinic complexes based on service area analysis.
Umm Al-Suyouf, Khakh, Al-Muzayin, An-Naqmi, Al-Matar, Al-Khadra’, Abu Sidr, As-Sahwa, Sadd Al-Ghaba, Al-Mufrahat, the Industrial City, As-Sahlouj, Al-Balqa’, Nubala’, As-Sakb, Al-Shafia, Aira, Al-Hassa’, Bani Bayada, Ar-Rum- manah, Jabal Ir, Al-Ghaba, Al-Aqol, Al-Anahi, King Fahd, Ain Al-Khaif, Al- Hadraa, Hadawda’, Kattanah, Al-Hafia, Wadi Al-Hamed, and Wadi Al-Battan. The number of districts that can access the service of clinics complexes within ten minutes via the road network according to the speed limit is 105 districts out of the 107 districts in Al-Madinah which constitutes 98.1% of the total number of districts in Al-Madinah,
The number of districts that cannot access the clinics complexes service with-in ten mwith-inutes is two of the districts constitutwith-ing 1.9% of the total number of districts in Al-Madinah and these districts are: As-Sahwa and Abu Sidr, while all districts in Al-Madinah can access the clinics complexes service within fifteen minutes via the road network according to the speed limit.
4.1.7. Health Units
DOI: 10.4236/jgis.2019.116039 648 Journal of Geographic Information System constituting 36.4% of the total number of districts in Al-Madinah. These dis-tricts are: Ash-Sharae’, Umm As-Suyouf, Khakh, Al-Muzayin, An-Naqmi, Al- Matar, Al-Khadra’, Abu Sidr, As-Sahwa, Sad Al-Ghaba, the industrial city, As-Sahlouj, Al-Balqa’, As-Sakb, Al-Hasa’, Ar-Rummanah, Al-Ghaba, Al-Aqol, Al-Anahi, Ein Al Kheif, Al-Hadra’, Hadouda’, Kattanah, Al-Hafia, Wadi Al- Hamed, Wadi Al-Battan, Ash-Shafiyah, Ash-Shahba’, As-Sina’ya, Abu Kabir, Warkan, As-Saiqiyah, As-Salam, Al-Mifrhat, As-Sikka, Abu Markha, Az-Zuhra, Ad-Difa’, and Al-Aziziah. The number of districts that can access the health units service within ten minutes via the road network according to the speed limit is 102 districts out of the 107 districts in Al-Madinah which constitutes 95.3% of the total number of districts in Al-Madinah. The number of districts that cannot access the health units service within ten minutes is five districts constituting 4.7% of the total number of districts in Al-Madinah and these dis-tricts are: As-Sahwa, Al-Mifrhat, the industrial city, As-Sahlouj, and Al-Balqa’. All districts in Al-Madinah can access the health units service within fifteen mi-nutes via the road network according to the speed limit.
4.1.8. Red Crescent
[image:16.595.227.521.426.707.2]The results of accessibility of the Red Crescent service within five, ten and fifteen minutes intervals, revealed that the districts that can access the Red Crescent service within five minutes via the road network and according to the speed limit 76 districts of the 107 districts in Al-Madinah constituting 71% of the total number of districts in Al-Madinah.
DOI: 10.4236/jgis.2019.116039 649 Journal of Geographic Information System The number of districts that cannot access the Red Crescent service in five minutes is 31 districts constituting 29% of the total districts in Al-Al-Madinah, which are: Ash-Sharae’, Umm As-Suyoouf, Khakh, Al-Muzayin, An-Naqmi, Al-Matar, Al-Khadra’, Abu Sidr, As-Sahwa, Sadd Al-Ghaba, the industrial city, As-Sahlouj, Al-Balqa’, Ar-Rummanah, Al-Ghaba, Hadouda’, Kitanna, Al-Hafia, Wadi Al-Hamed, Wadi Al-Battan, Ash-Shafiyah, As-Sadiqiah, Al-Mifrhat, Az- Zahra, Nubala’, Rahat, Al-Jissa, Al-Baraka, An-Nakhil, Aira, and Tiba.
The number of districts that can access the Red Crescent service within ten minutes via the road network and according to the speed limit is 101 of the 107 districts in Al-Madinah constituting 94.4% of the total districts in Al-Madinah, and the number of districts that cannot access the service The Red Crescent in ten minutes is six districts constituting 5.6% of the total districts in Al-Madinah and these districts are: As-Sahwa, Abu Sidr, Sadd Al-Ghaba, Al-Balqa’, Ketana, and Wadi Al-Hamed. All districts of Al-Madinah can access the Red Crescent service in fifteen minutes via Road network according to the speed limit, Figure 13.
4.2. Area of Coverage of Health Services Combined for Districts in
Al-Madinah
At this stage the algebraic addition Raster’s Sum was performed for the maps of health services resulting from network analysis of 8 different health services: public hospitals, specialized hospitals, health units, healthcare centers, infirma-ries, clinic complexes, Red Crescent Center, and ambulance facilities within the GIS environment Arc GIS From the Toolbox, and the Spatial Analysis Toolbox was selected Spatial Analyst Tool and a selection of calculations on maps was se-lected from it Map Algebra then the Raster Calculator tool. The results are as shown on the map (Figure 14), which shows the classification of the coverage area of health services in Al-Madinah in terms of access to health services as fol-lows:
4.2.1. Districts with High Health Services: (Coverage Ranges from 90% to 100%)
DOI: 10.4236/jgis.2019.116039 650 Journal of Geographic Information System high population density. All of these factors made this group have the best cov-erage of public services in Al-Madinah Al-Munawwarah.
Figure 13.Accessibility to Red Crescent centers based on service area analysis.
[image:18.595.231.516.419.693.2]DOI: 10.4236/jgis.2019.116039 651 Journal of Geographic Information System 4.2.2. Districts with Medium Health Services: (60% - 90% Coverage) This group includes forty-six districts representing about 43% of the total dis-tricts in Al-Madinah, and is considered the second group in terms of population and population density in Al-Madinah, and they cover an area of about 880.8 square kilometers, representing about 38.4% of the total area of Al-Madinah.
4.2.3. Districts with Low Health Services: (Covered Less Than 60%) This group includes four districts representing about 3.7% of the total districts in Al-Madinah, and these districts are inhabited by very few inhabitants of Al-Madinah, living on an area of about 1199.63 square kilometers, representing about 52.3% of the total area of Al-Madinah. These districts are: Umm As- Suyouf, Hadouda’, As-Sahwa, and Sadd Al-Ghaba. These districts are concen-trated in the north and south-east of Madinah, and the reasons for having low health services is due to its distance from the old nucleus of the city, the weak-ness of the road network, and its vast area in comparison to the rest of the city districts, which necessarily makes large parts of them inappropriate for housing, especially with the complex and intermingling topography of the city.
4.3. Location-Allocation Model to Determine Current Needs and
Future Planning of Health Services
4.3.1. General Hospitals
The allocated locations, i.e. the centers of Al-Madinah districts that received the service of public hospitals in the prescribed response period (15 minutes) is 103 districts, which constitutes 96.3% of the 107 districts in Al-Madinah, and the number of sites that did not receive public hospitals service is four districts, which constitutes 3.7% of the 107 districts in Al-Madinah. These districts are: Hadouda’, Umm As-Suyouf, Sadd Al-Ghaba, and As-Sahwa. It has been suggested to add two more public hospitals in order to service the biggest number of unserviced districts, and at the same time the cost of construction is low, Figure 15.
4.3.2. Specialized Hospitals
The allocated locations, i.e. the centers of Al-Madinah districts that received the service of specialized hospitals in the prescribed response time (15 minutes), is 102 districts, which constitutes 95.3% of the total districts in Al-Madinah. The number of locations that did not receive the service of specialized hospitals is five districts constituting 4.7% of the 107 districts of Madinah. These districts are Hadouda’, Umm As-Suyouf, Sadd Al-Ghaba, As-Sahwa and Wadi Al-Battan. It has been suggested to add three more hospitals in order to service the biggest number of unserviced districts, and at the same time the cost of construction is low, Figure 16.
4.3.3. Primary Health Centers
DOI: 10.4236/jgis.2019.116039 652 Journal of Geographic Information System constituting 3.7% of the 107 districts of Madinah. These districts are Hadouda’, Umm As-Suyouf, Sadd Al-Ghaba, and As-Sahwa. It has been suggested to add two more health centers in order to service the biggest number of unserviced districts, and at the same time the cost of construction is low, Figure 17.
Figure 15.Suggested locations for public hospitals based on location-allocation.
[image:20.595.236.512.437.706.2]DOI: 10.4236/jgis.2019.116039 653 Journal of Geographic Information System Figure 17. Suggested locations for health centers based on location-allocation.
4.3.4. Ambulance Facilities
The allocated locations, i.e. the centers of Al-Madinah districts that received the service of ambulance facilities in the prescribed response time (15 minutes), is 102 districts, which constitutes 95.3% of the total districts in Al-Madinah. The number of locations that did not receive the service of ambulance facilities is five districts constituting 4.7% of the 107 districts of Madinah. These districts are Hadouda’, Umm As-Suyouf, Sadd Al-Ghaba, As-Sahwa and Wadi Al-Battana. It has been suggested to add three more ambulance facilities in order to service the biggest number of unserviced districts, and at the same time the cost of con-struction is low, Figure 18.
4.3.5. Infirmaries
The allocated locations, i.e. the centers of Al-Madinah districts that received the service of infirmaries in the prescribed response time (15 minutes), is 101 dis-tricts, which constitutes 94.4% of the total districts in Al-Madinah. The number of locations that did not receive the service of infirmaries is six districts consti-tuting 5.6% of the 107 districts of Madinah. These districts are Hadouda’, Umm As-Suyouf, Sadd Al-Ghaba, As-Sahwa, Wadi Al-Battana, and the industrial city. It has been suggested to add four more infirmaries in order to service the biggest number of unserviced districts, and at the same time the cost of construction is
low, Figure 19.
4.3.6. Clinics Complex
DOI: 10.4236/jgis.2019.116039 654 Journal of Geographic Information System Figure 18.Suggested locations for ambulance facilities based on location-allocation.
Figure 19.Suggested locations for infirmaries based on location-allocation.
[image:22.595.230.517.387.662.2]num-DOI: 10.4236/jgis.2019.116039 655 Journal of Geographic Information System ber of locations that did not receive the service of clinics complexes is five dis-tricts constituting 4.7% of the 107 disdis-tricts of Madinah. These disdis-tricts are Ha-douda’, Umm As-Suyouf, Sadd Al-Ghaba, As-Sahwa and Wadi Al-Battana. It has been suggested to add three more clinics complexes in order to service the biggest number of unserviced districts, and at the same time the cost of con-struction is low, Figure 20.
4.3.7. Health Units
The allocated locations, i.e. the centers of Al-Madinah districts that received the service of health units in the prescribed response time (15 minutes), is 98 dis-tricts, which constitutes 91.6% of the total districts in Al-Madinah, While the number of locations that did not receive the service of health units is 9 districts, which constitutes 8.4% of the total number of districts in Al-Madinah. The dis-tricts are: Hadouda’, Umm As-Suyouf, Sadd Al-Ghaba, As-Sahwa, Wadi Al- Battana, the industrial city, Al-Mifrhat, As-Sahlouj, and Al-Balqa’. It has been suggested to add four more health units in order to service the biggest number of unserviced districts, and at the same time the cost of construction is low, Figure 21.
4.3.8. Red Crescent Centers
The allocated locations, i.e. the centers of Al-Madinah districts that received the service of Red Crescent centers in the prescribed response time (15 minutes), is 102 districts, which constitutes 95.3% of the total districts in Al-Madinah. The number of locations that did not receive the service of Red Crescent centers is five districts constituting 4.7% of the 107 districts of Madinah. These districts are Hadouda’, Umm As-Suyouf, Sadd Al-Ghaba, As-Sahwa and Wadi Al-Battan. It has been suggested to add three more Red Crescent centers in order to service the biggest number of unserviced districts, and at the same time the cost of con-struction is low, Figure 22.
5. Recommendations
DOI: 10.4236/jgis.2019.116039 656 Journal of Geographic Information System generate alternatives either by proposing an effective service or to improve an existing service.
Figure 20.Suggested locations for clinic complexes based on location-allocation.
[image:24.595.227.520.424.705.2]DOI: 10.4236/jgis.2019.116039 657 Journal of Geographic Information System Figure 22. Suggested locations for Red Crescent centers based on location-allocation.
Health services are one of the main elements in the urban development pro- cesses in Al-Madinah Al-Munawwarah, and the lack of quality levels in terms of number or spatial distribution is a strong determinant of the process of its sus-tainable urban development, especially in light of the growing and excessive population and urban expansion of the growing functional, regional and admin-istrative role of Al-Madinah Al-Munawwarah which gives it additional planning burdens in addition to poor coverage areas for health services accessibility in Al-Madinah Al-Munawwarah during the intervals of five, ten and fifteen mi-nutes, which created a negative impact on the management of the current urban environment.
In order to find planning solutions to reduce the dimensions of those prob-lems, the study recommends some suggestions that would provide and improve the reality of health services in Al-Madinah Al-Munawwarah through the redi-stribution of health services in Al-Madinah in proportion to the number and need of the population of them in an orderly manner serving all districts of Al-Madinah. This requires the filling of the current shortage of health services which is represented by twenty-four locations with two public hospitals, three specialized hospitals, two health centers, three ambulance facilities, four clinics, three clinic complexes, four health units and three Red Crescent centers.
DOI: 10.4236/jgis.2019.116039 658 Journal of Geographic Information System changes over time; introducing modern technologies commensurate with the need of the population of Al-Madinah; adopting the ease of access to public ser-vices as one of the main factors when the locations on these serser-vices are allocated and planned in Al-Madinah in addition to adopting foundations and standards of urban planning, and the adoption of statistical and spatial analysis methods in GIS when evaluating and planning health services in cities.
6. Conclusions
Al-Madinah Al-Munawwarah has faced many challenges in sustainable urban development during the past thirty years, and perhaps the most prominent of these challenges is the rapid urbanization without the availability of public ser-vices that keep pace with this increase, especially health serser-vices. The religious function of Al-Madinah Al-Munawwarah is the main powerhouse of its con-structional and administrative growth, and its concon-structional composition which greatly impacted the effectiveness of the geographic distribution of health ser-vices. The number of inhabitants of Al-Madinah has almost doubled in a period not exceeding 36 years (1394-1440 AH) as a result of the natural increase in the number of population and the increase of the number of incoming residents. Hence, the city expanded, its urbanization flourished, and its districts multiplied. As a result, there was an increasing pressure on the urban area at rates that ex-ceed the city’s ability to provide various health services and jobs to its commu-nity in terms of quantity and quality, which resulted in many problems related to the lack of various forms of health services, chaos in the use of land, the emer-gence of squatter areas, and the decline of health services. The adoption of new urban plans without taking into account the planning foundations has also con-tributed to the chaos in the use of land, the inability of some districts in the city to provide health services to the population at the appropriate level with no clear vision of the prevailing uses at the district level and some and at the city level as a whole, and this has affected the dispersion of health services and divergence, and the lack of supply to serve the population of the city.
DOI: 10.4236/jgis.2019.116039 659 Journal of Geographic Information System more than 60%.
Al-Madinah is currently unable to meet the needs of its population of health services at the present time the need for health services reached twenty-four sites with two public hospitals, three specialized hospitals, two health centers, three ambulance facilities, four clinics, three clinics complexes, four health units, and three Red Crescent Centers.
Conflicts of Interest
The author declares no conflicts of interest regarding the publication of this pa-per.
References
[1] Croser, J.L. (2003) Trauma Care Systems in Australia. Injury, 34, 649-651.
https://doi.org/10.1016/S0020-1383(03)00157-8
[2] Almer, C. and Goeschl, T. (2011) The Political Economy of the Environmental Criminal Justice System: A Production Function Approach. PublicChoice, 148, 611-630. https://doi.org/10.1007/s11127-010-9687-5
[3] Germani, A.R., Morone, P. and Testa, G. (2014) Environmental Justice and Air Pollution: A Case Study on Italian Provinces. Ecological Economics, 106, 69-82.
https://doi.org/10.1016/j.ecolecon.2014.07.010
[4] Cory, D.C. and Rahman, T. (2009) Environmental Justice and Enforcement of the Safe Drinking Water Act: The Arizona Arsenic Experience. Ecological Economics, 68, 1825-1837. https://doi.org/10.1016/j.ecolecon.2008.12.010
[5] Gosselin, R.A., Spiegel, D.A., Coughlin, R. and Zirkle, L.G. (2009) Injuries: The Neglected Burden in Developing Countries. Bulletin of the World Health Organiza-tion, 87, 246. http://www.who.int/bulletin/volumes/87/4/08-052290/
[6] Li, H., Liu, T. and Yin, X. (2012) Review and Analysis on Research Status of Trauma Emergency in Recent Ten Years in China. Journal of Traumatic Surgery, 14, 104-107. [7] Albert, J. and Phillips, H. (2003) Trauma Care Systems in the United Kingdom.
In-jury, 34, 728-734. https://doi.org/10.1016/S0020-1383(03)00151-7
[8] Rahman, S. and Smith, D. (2000) Use of Location-Allocation Models in Health Ser-vices Development Planning in Developing Nations. EuropeanJournalof Opera-tionalResearch, 123, 437-452. https://doi.org/10.1016/S0377-2217(99)00289-1
[9] Wang, L. (2007) Immigration, Ethnicity and Accessibility to Culturally Diverse Family Physicians. Health&Place, 13, 656-671.
https://doi.org/10.1016/j.healthplace.2006.10.001
[10] Luo, W. and Whippo, T. (2012) Variable Catchment Sizes for the Two-Step Floating Catchment Area (2SFCA) Method. Health&Place, 18, 789-795.
https://doi.org/10.1016/j.healthplace.2012.04.002
[11] Dai, D. (2010) Black Residential Segregation, Disparities in Spatial Access to Health Care Facilities and Late-Stage Breast Cancer Diagnosis in Metropolitan Detroit. Health&Place,16, 1038-1052. https://doi.org/10.1016/j.healthplace.2010.06.012
[12] Thisse, J. and Wildasin, D. (1992) Public Facility Location and Urban Spatial Struc-ture: Equilibrium and Welfare Analysis. Journal of Public Economics, 48, 83-118.
https://doi.org/10.1016/0047-2727(92)90043-F
DOI: 10.4236/jgis.2019.116039 660 Journal of Geographic Information System
https://doi.org/10.1007/978-3-319-68900-5_4
[14] Deverteuil, G. (2000) Reconsidering the Legacy of Urban Public Facility Location Theory in Human Geography. Progress in Human Geography, 24, 47-69.
https://doi.org/10.1191/030913200668094045
[15] Song, Z.N. (2016) Competitive Public Facilities Location Decision: Concept, Loca-tion SelecLoca-tion Principle and Model ConstrucLoca-tion. Scientia Geographica Sinica, 36, 1485-1494.
[16] Song, Z.N., Yan, T.G., Liu, T. and Huang, T. (2016) A New Gravity P-Median Mod-el and Empirical Test in Urban Comprehensive Hospital Location Decision Making: Take Wuxi as an Example. Progress in Geography, 35, 420-430.
[17] Rahman, S. and Smith, D. (1996) The Efficiency of Inefficiency: The Deployment of Health Facilities in Rural Bangladesh. In: Alauddin, M. and Hasan, S., Eds., Bangla-desh: Economy, People andtheEnvironment, Department of Economics, Universi-ty of Queensland, Brisbane, 197-209.
[18] Fisher, H. and Rushton, G. (1979) Spatial Efficiency of Service Locations and the Regional Development Process. Papers of the Regional Science Association, 42, 83-97. https://doi.org/10.1007/BF01935147
[19] Tekiner, H. (2014) Pharmacy in Turkey: Past, Present and Future. Pharmazie, 69, 477-480. https://www.ncbi.nlm.nih.gov/pubmed/24974586
[20] Hetzel, B. (1978) Basic Health Care in Developing Countries. Oxford University Press, Oxford.
[21] Phillips, D. (1990) Health and Health Care in Third World. Essex Longman, Lon-don.
[22] Bennett, W. (1981) A Location-Allocation Approach to Health Care Facility Loca-tion: A Study of the Undoctored Population in Lansing, Michigan. SocialScience& Medicine.PartD: MedicalGeography, 15, 305-312.
https://doi.org/10.1016/0160-8002(81)90006-X
[23] Phillips, D. (1986) Urban Hospital Location: London Research Series in Geography No 4: Leslie Mayhew George Allen and Unwin, London. Cities, 3, 357-358.
https://doi.org/10.1016/0264-2751(86)90080-6
[24] Taylor, E. (1982) Health Services Forum. Geneva, 395.
[25] Meade, S., Johm, W. and Wlibert, M. (1988) Medical Geography. The Guilford Press, New York.
[26] Guagliardo, M. (2004) Spatial Accessibility of Primary Care: Concepts, Methods and Challenges. InternationalJournalofHealthGeographics, 3, 3-14.
https://doi.org/10.1186/1476-072X-3-3
[27] Khan, A. (1992) An Integrated Approach to Measuring Potential Spatial Access to Health Care Services. Socio-EconomicPlanningSciences, 26, 275-287.
https://doi.org/10.1016/0038-0121(92)90004-O
[28] Joseph, E. and Bantock, P. (1982) Measuring Potential Physical Accessibility to General Practitioners in Rural Areas: A Method and Case Study. SocialScience& Medicine, 16, 85-90. https://doi.org/10.1016/0277-9536(82)90428-2
[29] Luo, W. and Wang, F. (2003) Measures of Spatial Accessibility to Health Care in a GIS Environment: Synthesis and a Case Study in the Chicago Region. Environment andPlanningB: PlanningandDesign, 30, 865-884. https://doi.org/10.1068/b29120
[30] Cho, C. (1998) An Equity-Efficiency Trade-off Model for the Optimum Location of Medical Care Facilities. Socio-Economic Planning Sciences, 32, 99-112.
DOI: 10.4236/jgis.2019.116039 661 Journal of Geographic Information System [31] Yasenovskiy, V. and Hodgson, J. (2007) Hierarchical Location-Allocation with Spa-tial Choice Interaction Modelling. Annals of the Association of American Geo-graphers, 97, 496-511. https://doi.org/10.1111/j.1467-8306.2007.00560.x
[32] Baray, J. and Cliquet, G. (2013) Optimizing Locations through a Maximum Cover-ing/p-Median Hierarchical Model: Maternity Hospitals in France. Journal of Busi-ness Research, 66, 127-132. https://doi.org/10.1016/j.jbusres.2012.09.003
[33] Guerriero, F., Miglionico, G. and Olivito, F. (2016) Location and Reorganization Problems: The Calabrian Health Care System Case. European Journal of Operation-al Research, 250, 939-954. https://doi.org/10.1016/j.ejor.2015.09.064
[34] Marks, A.P., Thrall, G.I. and Arno, M. (1992) Siting Hospitals to Provide Cost-Effec- tive Health Care. Geographic Information System, 2, 58-66.
[35] Brown, L. and Barnett, J.R. (2004) Is the Corporate Transformation of Hospitals Creating a New Hybrid Health Care Space? A Case Study of the Impact of Co-Loca- tion of Public and Private Hospitals in Australia. Social Science & Medicine, 58, 427-444. https://doi.org/10.1016/S0277-9536(03)00163-1
[36] Tulchinsky, T.H. and Varavikova, E.A. (2014) Chapter 12-Planning and Managing Health Systems. In: Tulchinsky, T.H., Varavikova, E.A. and Bickford, J.D., Eds., The New Public Health, 3rd Edition, Academic Press, San Diego, 613-641.
https://doi.org/10.1016/B978-0-12-415766-8.00012-4
[37] Moscelli, G., Siciliani, L., Gutacker, N. and Gravelle, H. (2016) Location, Quality and Choice of Hospital: Evidence from England 2002-2013. Regional Science and Urban Economics, 60, 112-124. https://doi.org/10.1016/j.regsciurbeco.2016.07.001
[38] Shortt, N.K. and Moore, A.J. (2006) Functional Localities: An Integrated Spatial Approach towards Health Care Locality Definition. GeoJournal, 67, 27-40.
https://doi.org/10.1007/s10708-006-9005-4
[39] Wu, C., Lin, C. and Chen, H. (2007) Optimal Selection of Location for Taiwanese Hospitals to Ensure a Competitive Advantage by Using the Analytic Hierarchy Process and Sensitivity Analysis. Building and Environment, 42, 1431-1444.
https://doi.org/10.1016/j.buildenv.2005.12.016
[40] Zhang, W., Cao, K., Liu, S. and Huang, B. (2016) A Multi-Objective Optimization Approach for Health-Care Facility Location-Allocation Problems in Highly Devel-oped Cities Such as Hong Kong. Computers, Environment and Urban Systems, 59, 220-230. https://doi.org/10.1016/j.compenvurbsys.2016.07.001
[41] Schweikhart, B. and Smith, L. (1993) Location and Service Mix Decisions for a Ma-naged Health Care Network. Socio-Economic Planning Sciences, 27, 289-302.
https://doi.org/10.1016/0038-0121(93)90021-A
[42] Mestre, M., Oliveira, D. and Barbosa-Póvoa, P. (2015) Location-Allocation Ap-proaches for Hospital Network Planning under Uncertainty. European Journal of Operational Research, 240, 791-806. https://doi.org/10.1016/j.ejor.2014.07.024
[43] Ammari, F., Ogawa, K. and Miyagi, T. (2000) Spatial Interaction Model in Health- Care Facility Location-Allocation. Infrastructure Planning Review, 17, 219-228. [44] Abdulkader, M. (2018) Using GIS for Determining Variations in Health Access in
Jeddah City, Saudi Arabia. ISPRS International Journal of Geo-Information, 7, 254.
https://doi.org/10.3390/ijgi7070254
[45] Francisco, J., José, A., Emilio, H., Silvia, L., Jin, S., María, N. and Alejandro, R. (2017) Network and Spatial Analysis to Assess and Guide Decisions about Equitable Accessibility to Health Services: The Public Palliative Care System in Extremadura (Spain). DiversityandEqualityinHealthandCare, 14, 184-192.
DOI: 10.4236/jgis.2019.116039 662 Journal of Geographic Information System [46] Chéri G., Gerbrand, M., Peter, S., David, M. and Mark, W. (2014) Planning for
Emergency Services Using GIS-Based Geographic Accessibility Analysis. Town and Regional Planning, 64, 1-12.
https://www.ajol.info/index.php/trp/article/view/116216/105743
[47] Rodzi, A. and Vini, I. (2013) Facility Location Models Development to Maximize total Service Area. TheoreticalandEmpirical Researches inUrban Management, Special Number 1S.
https://www.questia.com/library/journal/1G1-210725580/facility-location-models-d evelopment-to-maximize-total
[48] Hunadi, M. (2014) Measuring Access to Primary Health Care: Use of a GIS-Based Accessibility Analysis. Built Environment, Council for Scientific and Industrial Re-search, 19-22. http://hdl.handle.net/10204/7913
[49] Gustavo, B. (2013) Location-Allocation Models Applied to Urban Public Services Spatial Analysis of Primary Health Care Centers in the City of Lugan, Argentina, HungarianGeographicalBulletin, 62, 387-408.
http://www.mtafki.hu/konyvtar/kiadv/HunGeoBull2013/HunGeoBull_2013_4_387-408.pdf
[50] Gina, P., Mera, A., Fernando, F. and Ricardo, A. (2015) Location-Allocation and Accessibility Models for Improving the Spatial Planning of Public Health. PLoS ONE, 10, e0119190. https://doi.org/10.1371/journal.pone.0119190
[51] Kemboi, T. and Waithaka, E. (2013) GIS Location-Allocation Model in Improving Accessibility to Health Care Facilities: A Case Study of Mt. Elgon Sub-County. In-ternationalJournalofScienceandResearch, 4, 3306-3310.
https://pdfs.semanticscholar.org/b151/2510750c2a6721dbfe0c33a477f0fda55e09.pdf ?_ga=2.98046047.1378241492.1568455666-514517534.1566633811
[52] Eren, Ö., Ayşenur, U., Mehmet, E., Cihan, Ç. and Selçuk, K. (2017) Optimizing the Location-Allocation Problem of Pharmacy Warehouses: A Case Study in Gaziantep. AnInternationalJournalofOptimizationandControl: Theories&Applications, 7, 117-129. https://doi.org/10.11121/ijocta.01.2017.00373
[53] Beheshtifar, S. and Alimoahmmadi, A. (2015) A Multiobjective Optimization Ap-proach for Location-Allocation of Clinics. International Transactions in Operation-al Research, 22, 313-328. https://doi.org/10.1111/itor.12088
[54] Widener, J. and Horner, W. (2011) A Hierarchical Approach to Modeling Hurri-cane Disaster Relief Goods Distribution. Journal of Transport Geography, 19, 821- 828. https://doi.org/10.1016/j.jtrangeo.2010.10.006
[55] ESRI. Arc GIS, Version 10X Help.
http://desktop.arcgis.com/zh-cn/arcmap/latest/extensions/network-analyst/types-of-n
etwork-analyses.htm#ESRI_SECTION1_DEAE22E63F944F6C958668B8C4AA96DA
[56] Hakimi, S. (1964) Optimum Locations of Switching Centers and the Absolute Cen-ters and Medians of a Graph. Operations Research, 12, 450-459.
https://www.jstor.org/stable/168125