Research Paper
Integration of copy number and transcriptomics provides risk
strati
fi
cation in prostate cancer: A discovery and validation cohort study
H. Ross-Adams
a,1, A.D. Lamb
a,b,c,⁎
,1, M.J. Dunning
a,1, S. Halim
a, J. Lindberg
d, C.M. Massie
a, L.A. Egevad
e,
R. Russell
a, A. Ramos-Montoya
a, S.L. Vowler
a, N.L. Sharma
f, J. Kay
a,g, H. Whitaker
a,g, J. Clark
h, R. Hurst
h,
V.J. Gnanapragasam
b,c, N.C. Shah
b, A.Y. Warren
i, C.S. Cooper
h, A.G. Lynch
a, R. Stark
a, I.G. Mills
a,j,k,l,
H. Grönberg
c,1, D.E. Neal
a,b,1, on behalf of the CamCaP Study Group
2a
Cancer Research UK Cambridge Institute, University of Cambridge, Cambridge CB2 0RE, UK
b
Department of Urology, Addenbrooke's Hospital, Cambridge CB2 2QQ, UK
c
Academic Urology Group, University of Cambridge, Cambridge, CB2 0QQ, UK
dDepartment of Medical Epidemiology and Biostatistics, Karolinska Institutet, Stockholm, Sweden
eDepartment of Oncology–Pathology, Karolinska Institutet, Stockholm, Sweden
f
Nuffield Department of Surgical Sciences, University of Oxford, Roosevelt Drive, Oxford, UK
g
Molecular Diagnostics and Therapeutics Group, University College London, WC1E 6BT, UK
h
University of East Anglia, Norwich Research Park, Norwich NR4 7TJ, UK
i
Department of Pathology, Addenbrooke's Hospital, Cambridge CB2 2QQ, UK
j
Prostate Cancer Research Group, Centre for Molecular Medicine Norway, Nordic EMBL Partnership, University of Oslo and Oslo University Hospital, N-0318 Oslo, Norway
kDepartment of Molecular Oncology, Institute of Cancer Research, Oslo University Hospitals, N-0424 Oslo, Norway
l
Prostate Cancer UK/Movember Centre of Excellence for Prostate Cancer Research, Centre for Cancer Research and Cell Biology, Queen's University, Belfast, UK
a b s t r a c t
a r t i c l e i n f o
Article history: Received 12 June 2015
Received in revised form 10 July 2015 Accepted 14 July 2015
Available online 29 July 2015
Keywords: Prostate cancer Risk stratification Genomics Prognosis Gene signature Biochemical relapse Personalised medicine
Background:Understanding the heterogeneous genotypes and phenotypes of prostate cancer is fundamental to improving the way we treat this disease. As yet, there are no validated descriptions of prostate cancer subgroups derived from integrated genomics linked with clinical outcome.
Methods:In a study of 482 tumour, benign and germline samples from 259 men with primary prostate cancer, we used integrative analysis of copy number alterations (CNA) and array transcriptomics to identify genomic loci that affect expression levels of mRNA in an expression quantitative trait loci (eQTL) approach, to stratify patients into subgroups that we then associated with future clinical behaviour, and compared with either CNA or tran-scriptomics alone.
Findings:We identifiedfive separate patient subgroups with distinct genomic alterations and expression profiles based on 100 discriminating genes in our separate discovery and validation sets of 125 and 103 men. These sub-groups were able to consistently predict biochemical relapse (p = 0.0017 and p = 0.016 respectively) and were fur-ther validated in a third cohort with long-term follow-up (p = 0.027). We show the relative contributions of gene expression and copy number data on phenotype, and demonstrate the improved power gained from integrative analyses. We confirm alterations in six genes previously associated with prostate cancer (MAP3K7,MELK,RCBTB2, ELAC2,TPD52,ZBTB4), and also identify 94 genes not previously linked to prostate cancer progression that would not have been detected using either transcript or copy number data alone. We confirm a number of previously pub-lished molecular changes associated with high risk disease, includingMYCamplification, andNKX3-1,RB1andPTEN deletions, as well as over-expression ofPCA3andAMACR, and loss ofMSMBin tumour tissue. A subset of the 100 genes outperforms established clinical predictors of poor prognosis (PSA, Gleason score), as well as previously pub-lished gene signatures (p = 0.0001). We further show how our molecular profiles can be used for the early detec-tion of aggressive cases in a clinical setting, and inform treatment decisions.
⁎ Corresponding author.
E-mail addresses:[email protected](H. Ross-Adams),[email protected](A.D. Lamb),[email protected](M.J. Dunning),
[email protected](S. Halim),[email protected](J. Lindberg),[email protected](C.M. Massie),[email protected](L.A. Egevad),[email protected]
(R. Russell),[email protected](A. Ramos-Montoya),[email protected](S.L. Vowler),[email protected](N.L. Sharma),
[email protected](J. Kay),[email protected](H. Whitaker),[email protected](J. Clark),[email protected](R. Hurst),[email protected]
(V.J. Gnanapragasam),[email protected](N.C. Shah),[email protected](A.Y. Warren),[email protected](C.S. Cooper),
[email protected](A.G. Lynch),[email protected](R. Stark),[email protected](I.G. Mills),[email protected](H. Grönberg),[email protected]
(D.E. Neal).
1
These authors contributed equally to this work.
2
List of participants and affiliations appear at the end of the paper.
http://dx.doi.org/10.1016/j.ebiom.2015.07.017
2352-3964/Crown Copyright © 2015 Published by Elsevier B.V. This is an open access article under the CC BY license (http://creativecommons.org/licenses/by/4.0/).
Contents lists available atScienceDirect
EBioMedicine
Interpretation:For thefirst time in prostate cancer this study demonstrates the importance of integrated genomic analyses incorporating both benign and tumour tissue data in identifying molecular alterations leading to the gen-eration of robust gene sets that are predictive of clinical outcome in independent patient cohorts.
Crown Copyright © 2015 Published by Elsevier B.V. This is an open access article under the CC BY license (http://creativecommons.org/licenses/by/4.0/).
1. Introduction
Disease stratification based on molecular signatures has aided the management of other epithelial cancers such as breast cancer (Curtis et al., 2012). In contrast, prostate cancer treatment decisions are still based almost exclusively on histological architecture (Gleason score) (Gleason, 1966; Gleason and Mellinger, 1974), prostate-specific antigen (PSA) levels (Catalona et al., 1994) and local disease state (TNM, WHO 2009), without attention to molecular characteristics. However, recent studies show that prostate cancer can be stratified according to molec-ular signatures (Glinsky et al., 2004; Varambally et al., 2005; Tomlins et al., 2007; Irshad et al., 2013; Taylor et al., 2010). Prostate cancer is the most non-cutaneous common cancer in males in the UK and USA (www.cancerresearchuk.organdwww.cdc.gov) and genetic changes associated with aggressive disease, when present in early tumours,
herald the onset of early biochemical relapse (Ramos-Montoya et al., 2014). Early treatment of primary prostate cancer is very effective, but it is still difficult to identify those patients who are likely to progress and to treat them appropriately.
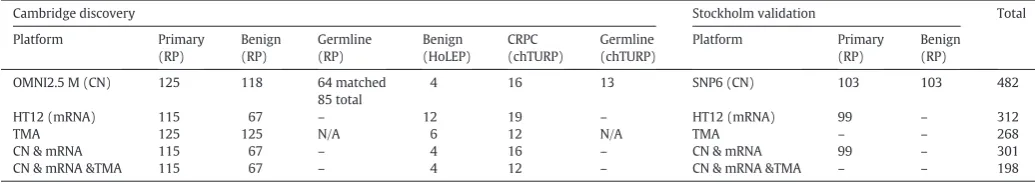
[image:2.595.36.554.331.736.2]Here we describe the comprehensive, integrated analysis of genomic and transcriptomic data from 351 tissue and blood samples from 156 British men, including 125 radical prostatectomy (RP) samples, 118 with matched benign tissue; 64 matched germline DNA; 19 castrate-resistant prostate cancer (CRPC) from channel transurethral resection of the prostate (chTURP) samples, 13 with matched germ-line DNA, and 12 independent samples with benign prostatic hyperplasia (BPH). We identifyfive distinct molecular profiles for primary prostate cancer that are predictive of biochemical relapse, based on the integrative anal-ysis of transcript levels and somatic copy number alterations (CNAs). These findings hold when castrate-resistant prostate cancers are
Table 1
Summary of clinical characteristics of discovery (Cambridge) and validation (Stockholm) cohorts.
Cambridge Stockholm
Primary tumour—RP CRPC—chTURP Primary tumour—RP
n = 125 % n = 19 % n = 103 %
Age (years)
Mean 60.9 72.4 63.9
Range 41–73 59–93 54–75
Pre-operative PSA (ng/ml)
b4 3 2% 0 7 7%
4–10 87 70% 3 16% 60 58%
N10 34 27% 16 84% 28 27%
Unknown 1 1% – 8 8%
Gleason Grade (RP)
5 – – 2 2%
6 18 14% – 20 19%
7 (3 + 4) 76 61% 58 56%
7 (4 + 3) 21 17% 1 5%
8 8 6% 2 11% 6 6%
9 2 2% 9 47% 9 9%
10 0 0% 2 11% 1 1%
Neuroendocrine – 1 5% –
Small cell – 1 5% –
Ungraded/unknown – 1 5% 7 7%
Pathology stage
pT2 38 30% – 52 50%
pT3a 76 61% – 28 27%
pT3b 9 7% – 15 15%
pT4 2 2% –
Unknown 6 6%
Follow-up (months)
Mean 37 – 78
Range 2–67 – 2–122
Biochemical relapse 21 17% – 48 47%
% tumour cellularity
Mean 52% 65% tissue selected for≥70%
Range 20%–90% 20%–95%
Positive surgical margins 30 24% – 44 43%
Extra-capsular extension 87 70% 1 5% 43 42%
Metastases 1 1% 2 11% 4 4%
ERG status⁎
2EDEL 8 6% – –
2ESPLIT 12 10% – –
EDEL 20 16% – –
ESPLIT 17 14% – –
N 64 51% – –
Unknown 4 3% – –
considered, and further replicate in a separate cohort of 206 samples from 103 Swedish primary prostate cancers with long-term follow-up (Table 1). We further validate our prognostic molecular profiles in a well-established American cohort (Taylor et al., 2010), the only pub-lished study of similar size with comparable genomic and clinical data at the time (Suppl. Table 1). An overview of the data generation is pro-vided inTable 2. We describe key genetic changes that stratify men into different risk groups and suggest possible therapeutic and prognostic application for these discoveries.
2. Methods
2.1. Patient samples
Ethical approval for the use of Cambridge samples and data collec-tion was granted by the local Research Ethics Committee under ProMPT (Prostate Mechanisms for Progression and Treatment)“Diagnosis, in-vestigation and treatment of prostate disease”(MREC 01/4/061). The Cambridge discovery cohort comprised 358 fresh frozen samples from 156 men, including 125 primary prostate cancer from radical prostatec-tomy (RP) with matched benign tissue, 64 matched germline genomic DNA (gDNA), 19 castrate-resistant prostate cancer (CRPC) from channel transurethral resection of the prostate (chTURP), 13 with matched germline gDNA, and 12 independent benign samples from holmium laser enucleation of the prostate (HoLEP). The Stockholm validation co-hort comprised 206 samples of 103 primary prostate cancer with matched germline DNA, as previously described and 99 samples of mRNA (Liu et al., 2013), and was selected for 50% rate of relapse. Com-prehensive clinical (diagnostic) data were collected for each cohort, in-cluding pre-operative and 6-monthly follow-up PSA, TNM staging and Gleason score (Table 1; Suppl. Table 2). In all cases, biochemical relapse was defined according to European Guidelines as a persistent rise above 0.2ng/ml (Mottet et al., 2014) or triggered salvage radiotherapy.
2.2. Histopathology
Cambridge samples were prepared as described (Warren et al., 2013). Relative proportions of benign, epithelial, stromal and tumour cells were determined by consultant histopathologist (AW) (Suppl. Table 2); samples with≥20% tumour and matched non-tumour cores (when available) were included (Yuan et al., 2012). Stockholm samples were similarly assessed (LE), and included with≥70% tumour content.
2.3. Genomic processing
Cambridge: gDNA and total mRNA were extracted from tissue samples (Qiagen AllPrep), and gDNA from whole blood (Tepnel). All DNAs were assayed on Illumina HumanOmni2.5–8 M bead chip arrays;
16 samples were also assayed on Affymetrix SNP6 arrays (Aros, Denmark). Stockholm gDNA samples were assayed on Affymetrix SNP6 arrays, as previously described (Liu et al., 2012). All mRNAs were profiled on Illumina HT12 v4 BeadChip arrays.
2.4. Expression data analysis
For each cohort, bead level data were pre-processed to remove spatial artefacts, log2-transformed and quantile normalized using the
beadarraypackage (Dunning et al., 2007) in Bioconductor prior to
analy-sis. The ComBAT method (Johnson et al., 2007), as implemented in the
svaBioconductor package, was used address batch effects in the expres-sion data. Like other microarray technologies, Illumina arrays are known to harbour a large number of probes that do not match their intended ge-nomic location, or map to gege-nomic locations that are not useful for gene expression studies (Barbosa-Morais et al., 2010). Furthermore, including such probes in an analysis can be misleading (Dunning et al., 2010). We therefore restricted downstream analyses to‘perfect’ probes only (Barbosa-Morais et al., 2010), and whenever a gene-centric analysis was required we chose the probe with the highest Inter-quartile range (IQR) to represent each gene. Probes (genes) were ranked by IQR values, and the 100 most variable probes across expression data were selected for clustering, based on k-means method (seeChalise et al., 2014for a re-view on clustering methods), where each observation belongs to the cluster with the nearest mean that best describes that cluster. A linear modelling approach was used to estimate the expression of each probe in thefive subtypes, and the set of matched benign samples. Differential expression statistics for the comparison of each subtype to benign were then generated following Bayes' shrinkage of variance (Smyth, 2004).
2.5. Copy number analysis
[image:3.595.42.560.77.169.2]Data were pre-processed and quality checked using‘Call Rate QC’ (AROS), gender calls from PennCNV (Wang et al., 2007); sample pairings were confirmed using BADGER (Lynch et al., 2012). SNP6 data were analysed with ASCAT (Van Loo et al., 2010), where Cambridge & Stockholm data were mapped to hg19, andTaylor et al. (2010)data were mapped to hg18. Discovery cohort samples included all available tumour and matched benign pairs. Copy number-relatedfigures are coloured accordingly with intensity illustrating degree of gain/loss. CN = 2 is diploid, 0/1 indicates homo- or heterozygous loss; 3/4 indi-cates hetero- or homozygous gain; Discovery cohort was analysed in OncoSNP (Yau et al., 2010), using only rank1 & 2 calls (out of ranks1– 5) for CNA or LOH at each genomic location; this captures larger changes and/or highest confidence. This collapses CN segments to all local genes with the same CN state; OncoSNP reports a separate segment when it sees a gene with a different CN state. All loci altered (CN≠2) in at least 10% of samples were included, so a total of 117 primary RP tumour
Table 2
Number and type of tissue analysed by each platform.
Cambridge discovery Stockholm validation Total
Platform Primary
(RP)
Benign (RP)
Germline (RP)
Benign (HoLEP)
CRPC (chTURP)
Germline (chTURP)
Platform Primary
(RP)
Benign (RP)
OMNI2.5 M (CN) 125 118 64 matched
85 total
4 16 13 SNP6 (CN) 103 103 482
HT12 (mRNA) 115 67 – 12 19 – HT12 (mRNA) 99 – 312
TMA 125 125 N/A 6 12 N/A TMA – – 268
CN & mRNA 115 67 – 4 16 – CN & mRNA 99 – 301
CN & mRNA &TMA 115 67 – 4 12 – CN & mRNA &TMA – – 198
CN = copy number. RP = radical prostatectomy.
HoLEP = holmium laser enucleation of the prostate. chTURP = channel transurethral resection of the prostate. OMNI2.5 M = Illumina OMNI2.5 M Genotype Beadchip. SNP6 = Affymetrix SNP6 Genotype array.
samples were included in this analysis. Stockholm validation cohort was analysed in ASCAT (Van Loo et al., 2010), with all calls displayed. Genome plots were generated using ggbio package in Bioconductor (Yin et al., 2012). Percentage genomic alteration (PGA) was calculated by summing the number of bases with CN≠b2, and dividing by 3 billion. Only OncoSNP rank1 calls (highest confidence) were included.
2.6. Integrative clustering & iCluster comparison
See Supplementary Methods.
2.7. Pathway analysis
Gene ontology pathway enrichment was determined using GeneGo MetaCore (Thomas Reuters) andhttp://www.pantherdb.org/using default settings and FDR p≤0.05. All genes with log2FC≥ + 1 or log2FC≤ −1 difference in expression were used in each analysis, to ensure a meaningful number of targets were included for gene-set enrichment analyses, to determine whether any particular pathways or nodes were specific to different clusters.
2.8. ERG gene status
TMPRRS2-ERGgene fusion status was determined for Cambridge RP
samples using a break-apart FISH assay on purpose-made tissue micro-arrays as previously described (Clark et al., 2008) from tissue cores ad-jacent to those included in the genomics study—see below. Categories used were based on those with known clinico-pathological associations; when mixed signals were identified, the sample was assigned to the de-letion or split category with the most significant clinical implications, according toAttard et al. (2008); i.e. according to increasing order of severity 2 N, N, ESPLIT/2ESPLIT, EDEL/2EDEL.
2.9. Study TMA
Single 3 mm cores from the immediately adjacent slice of each patient tumour and benign core used for genomic analysis (RNA and DNA); i.e. if‘vial 6’was used for genomic study (based on percentage tumour cellularity), then a core was punched from the parrafin megablock in the region immediately neighbouring this vial on the prostate map (see Suppl. Table 2).
3. Results
In previous studies of breast (Curtis et al., 2012) and prostate cancer (Taylor et al., 2010), it has been suggested that either copy number or transcriptomic profiling alone provides superior clinical prediction. We therefore considered these data separately, before carrying out an integrated analysis combining CN data with associated mRNA transcript profiles of gene targets in an eQTL approach.
3.1. Copy number profiling
The overall genome-wide copy number (CN) profile of the Cambridge (discovery) cohort is consistent with previousfindings, with chromosome 8p loss/8q gain evident (Fig. 1). The detection of known prostate cancer risk CN changes (Williams et al., 2014; Sun et al., 2007) in our cohort is broadly consistent with other studies (Suppl. Table 3), with key tumour suppressorNKX3-1(8p21.2) deleted in 40% of samples, andRB1(24%),PTEN(18%), andTP53(11%) deletions also easily detected even with very stringent call ranking selection criteria applied (seeMethods). A similar overall profile is evident in the Stockholm validation data set (Suppl. Fig. 1), despite being assayed and analysed on different platforms (seeMethods). Thesefindings also show that well-established molecular changes in prostate cancer
1 2 3 4 5 6 7 8 9 10 11 12 13 14 15 16 17 18 19 20 21 22 X Y
0
25
50 50
25
Percentage samples af
fected 0 e g n a h c dl of e g ar e v A +1.5 +2.0 - 2.5 - 2.0 -1.5 +2.5 % 2 1 -C 4 P M H C % 2 1 -3 E N P C % 3 1 -2 K PI R % 2 1 -1 S S D T P % 2 1 -9 G A B E % 3 1 -2 E C M S N % 2 1 -2 5 D P T % 2 1 -1 A P MI % 2 1 -6 4 D R K N A % 3 1 -6 7 F R O 8 C % 1 1 -P 2 5 2 F N Z % 2 1 -R DI P S % 3 1 -C Y M 3 1. 1 2 q 8 1 2. 1 1 q 8 3. 1 2 q 8 1. 2 2 q 8 2. 2 2 q 8 2. 3 2 q 8 3 1. 4 2 q 8 1 2. 4 2 q 8 3. 4 2 q 8 % 1 1 -P B Y R % 0 1 -1 Q H S % 1 1 -1 P X O F 3 1 p 3 % 3 1 -7 K 3 P A M % 5 1 -2 S R A R % 4 1 -T T G N R % 2 1 -4 GI F 5 1 q 6 1 2 q 6 % 1 2 -1 B R % 8 1 -1 1 P A K A % 0 2 -2 F 2 F T G % 1 2 -2 B T B C R % 0 2 -2 B D T E S % 9 1 -1 1 F H P % 0 2 -3 1 MI R T % 9 1 -1 T G U S 13q14.11-q14.3
PTEN - 18%
GHITM - 8% MMS19 - 5% CUEDC2 - 5% 10q23.1 -10q24.32 % 7 3 - 1-3 X K N % 7 3 -7 P M H C % 7 3 -1 C C H 3 R % 6 3 -3 S B R O S % 6 3 -2 R A C C % 6 3 -8 5 F R O 8 C % 6 3 -2 B 0 6 1 M A F % 6 3 -N T M D % 5 3 -2 B 1 V 6 P T A % 5 3 -9 R M T M % 4 3 -1I R E % 4 3 -B 2 K T P % 3 3 -2 E 2 F T G % 3 3 -3 P L E % 3 3 -9 S T NI % 5 2 -2 D 2 M T % 5 2 -A 6 T A K % 4 2 -1 M S L % 4 2 -2 F R B % 6 3 -C C 3 P P P 1. 3 2 p 8 3. 1 2 p 8 2. 1 2 p 8 1. 1 2 p 8 2 1 p 8 3 2. 1 1 p 8 2 2. 1 1 p 8 1 2. 1 1 p 8 % 8 -1 H D C % 1 1 -9 5 R D W % 5 1 -1 P B S H % 6 1 -1I 4 X O C % 6 1 -4 C D H L K % 5 1 -L 2 C P P A R T % 5 1 -5 2 F C T % 5 1 -8 F E D 1. 2 2 q 6 1 1. 3 2 q 6 1 3. 3 2 q 6 1 % 1 1 -3 5 P T 1. 3 1 p 7 1 % 7 1 -B 1 N K D C 1. 3 1 p 2 1 TP63 GDF15 PCA3 MSMB OLMF4 16q24.1 16q24.3
[image:4.595.94.492.424.677.2]are detectable even at relatively low percentage tumour core content (Table 1).
The prostate cancer genome is dominated by wide-spread deletions: we found 986 genes affected by CN loss, compared to 508 genes with CN gains; only alterations affecting≥10% of the cohort were considered. In-deed, only chromosome 8q harbours frequent gains, involving many genes across the whole region. Most lie outside 8q24, although amplifi -cation atMYC(13%) was confirmed. In addition to somatic copy number alterations (CNA) inNKX3-1, we identified nineteen additional genes across chromosome 8p with at least as many alterations (24–37%). Only genes with CNAs in more than 10% of samples and also relevant in the subsequent integrative analysis are highlighted (Fig. 1). All other genes with CN changes in≥10% of the cohort are listed in Suppl. Table 4.
We confirmed previously identified (Taylor et al., 2010; Lalonde et al., 2014) CNAs inMAP3K7(15%; chr6q15), and further refined the
original 58 Mb signal across the 6q12–6q22 region, with CNAs identified
inRARS2(15%) andRNGTT(14%) 1- and 2-Mb upstream ofMAP3K7
respectively, as well as CNAs 18.8 Mb downstream, atFIG4 (12%; chr6q21). In contrast to previous work (Taylor et al., 2010), we did not see any significant correlation with local transcript expression of
RARS2orRNGTTand deletions atMAP3K7 locus (see below). In addition
to known tumour suppressorRB1(24%, chr13q14.2), we identified six other genes with comparable rates of CN change (18–21%), including
AKAP11,GTF2F2,SETDB2,PHF11,TRIM13, andSUGT1. These span an
8 Mb region, and are therefore probably distinct signals. Although we confirmed known deletions around CDH1 (8%, chr16q22.1), these were less frequent than in other studies (Williams et al., 2014; Sun et al., 2007). However, twice as common in this data set were CN losses spanning seven additional genes in 16q23.1–16q24.3 (11-16%) not yet fully characterised, includingTCF25,TRAPPC2L,DEF8,WDR59,HSBP1,
COX4I1, andKLHDC4. Conversely, a frequently deleted region on chr5q
% 50
25
0
25
50
50
25
0
25
50
50
25
0
25
50
50
25
0
25
50
50
25
0
25
50
+3
+2
0
-2
-3 +3
+2
0
-2
-3 +3
+2
0
-2
-3 +3
+2
0
-2
-3 +3
+2
0
-2
-3
1 2 3 4 5 6 7 8 9
Chromosome
10 11 12 13 14 15 16 17 18 19 20 2122 X Y
[image:5.595.78.527.55.513.2]log2
clust1 clust2 clust3 clust4 clust5
−2 −1 0 1 2
Relative Normalised Expression
0
5
0
100
150
Transcript Expression Color Key and Histogram
Count
0
100
200
300
Count
Copy Number Color Key and Histogram
−20 −10 0 10 20
No. Men with amplification/loss ampl. loss
Copy Number
Clusterchr16 − COX4I1 chr17 − ELAC2 chr16 − HSBP1 chr16 − WDR59 chr13 − CDC16 chr8 − TM2D2 chr8 − SORBS3 chr8 − R3HCC1 chr16 − TCF25 chr17 − ZBTB4 chr8 − ELP3 chr10 − CUEDC2 chr17 − COX10 chr16 − DEF8 chr16 − TRAPPC2L chr16 − KLHDC4 chr18 − RBFA chr17 − MPDU1 chr17 − ANKFY1 chr17 − SPAG7 chr8 − BRF2 chr17 − SAT2 chr16 − AARS chr10 − MMS19 chr18 − RALBP1 chr18 − PQLC1 chr17 − SLC25A11 chr18 − CXXC1 chr17 − CTNS chr16 − FUK chr8 − INTS9 chr8 − DMTN chr8 − ATP6V1B2 chr8 − GTF2E2 chr8 − PPP3CC chr8 − C8orf58 chr8 − ERI1 chr8 − KAT6A chr8 − CHMP7 chr8 − CCAR2 chr8 − FAM160B2 chr8 − PTK2B chr8 − LSM1 chr8 − MTMR9 chr13 − AKAP11 chr2 − ACVR1 chr13 − RCBTB2 chr13 − GTF2F2 chr13 − SETDB2 chr6 − HDDC2 chr13 − SUGT1 chr13 − PHF11 chr13 − TRIM13 chr10 − GHITM chr12 − SCAF11 chr9 − MELK chr3 − NUDT16P1 chr17 − CYB5D2 chr3 − LRRC31 chr9 − LPPR1 chr9 − GALNT12 chr6 − RARS2 chr12 − LINC00938 chr18 − PIGN chr2 − SFT2D3 chr2 − ERCC3 chr3 − YEATS2 chr18 − C18orf25 chr6 − MAP3K7 chr18 − HDHD2 chr6 − FIG4 chr6 − RNGTT chr9 − ZBTB34 chr2 − KCNK12 chr20 − MYLK2 chr1 − GPR88 chr3 − HMCES chr3 − EIF4G1 chr18 − AFG3L2 chr3 − ACAD9 chr12 − DCTN2 chr12 − COPS7A chr17 − SCN4A chr20 − COL20A1 chr7 − FSCN3 chr7 − ARF5 chr9 − MAPKAP1 chr8 − PTDSS1 chr8 − CHMP4C chr9 − RP11−60I3.5 chr8 − ZNF252P chr8 − TPD52 chr8 − ANKRD46 chr8 − EBAG9 chr8 − IMPA1 chr8 − SPIDR chr8 − RIPK2 chr8 − C8orf76 chr8 − CPNE3 chr8 − NSMCE2
Cambridge Discovery Cohort
clust1 clust2 clust3 clust4 clust5
Transcript Expression
Cohort
Stockholm Validation Cohort
0
4
0
8
0
120
−1 0 1
0
50
100
150
−20 −10 0 10 20 ampl.
[image:6.595.64.509.53.681.2]loss
nearCHD1/APC(Sun et al., 2007) was not that common in our dataset (38% vs 7%; Suppl. Table 4).
To determine the value of using CN data alone to stratify patients, we clustered primary tumours using all loci altered (seeMethods), and identifiedfive patient groups with distinct genomic profiles (Suppl. Fig. 2A). Despite this, clustering on the basis of CN profiling alone was not significant in a survival analysis (logrank p = 0.063; Suppl. Fig. 2B), where time to biochemical relapse (BCR) was used as the pri-mary outcome (seeMethods). This is in contrast to previousfindings that suggested CN state alone can be a prognostic indicator (Taylor et al., 2010; Lalonde et al., 2014).
3.2. mRNA transcript profiling
High levels of variability in gene expression between tumours have recently been shown to be more useful in identifying prostate, breast, colorectal and lung cancer risk genes (Gorlov et al., 2014) than
traditional tumour versus normal tissue differential expression approaches, where genuine genes driving aggressive behaviour can be obscured by more abundant but less biologically relevant effects. Fur-thermore, such inter-tumour variability in gene expression has been shown to have strong association with clinically useful features (Gorlov et al., 2012), such as Gleason score (prostate cancer) and tu-mour histology (lung cancer). To consider only the most informative genes, we applied k-means clustering to the top 100 mRNA transcript probes with the highest levels of inter-tumour variability in primary prostate cancer tissues. This partitioned the cohort intofive patient groups with distinct transcript profiles (Suppl. Fig. 3A; seeMethods).
Although this analysis identified known prostate cancer risk genes
AMACR,PCA3,GDF15andMSMB, as well as several possible candidate
genes showing high levels of inter-tumour variability (Suppl. Fig. 3A & Suppl. Table 5), survival analysis showed that transcript-only clustering was not predictive of prognosis (logrank p = 0.11, Suppl. Fig. 3B). In fact, this approach was only informative on inclusion of a small group
A
C
D
B
1 2 3 4 5
0 50 100
Integrative cluster
Gleason 3+3 Gleason 3+4 Gleason 4+3 Gleason 3+5 Gleason 4+5
Percentage of patients
E
F
Gleason - High(≥4+3=7):Low(≤3+4=7)
PSA - High(>10):Low(<10)
ECE - Y:N
PSM - Y:N
Hazard Ratio
Integrative cluster 1:4
Integrative cluster 2:4
Integrative cluster 3:4
Integrative cluster 5:4
Discovery cohort (Cambridge)
Validation cohort (Stockholm)
Hi:Lo p = 0.0017 Hi:Lo p = 0.016
0 10 20 30 40 50 60
0.0
0.2
0.4
0.6
0.8
1.0
Time(months)
Probability of freedom from
0 2 4 6 8
Time(years)
1_ 23(8)2_ 25(1) 3_ 9(3) 4_ 19(3) 5_ 30(4)
biochemical recurrence
1 2 3 4 5
0.0
0.2
0.4
0.6
0.8
1.0
−4 −3 −2 −1 0
0.0
0.2
0.4
0.6
0.8
Survival: 1000 random signature
Percentile:0.98 (Tests:1000 p=0.018) N = 1000 Bandwidth = 0.1638
Density
CamCaP Signature p−val <0.001 (−3.98) Significant p−val <0.05 (−1.30)
−4 −3 −2 −1 0
0.0
0.2
0.4
0.6
0.8
1.0
Survival: 189 known cancer signatures
Percentile:1.00 (Tests:189 p<0.001) N = 189 Bandwidth = 0.1481
Density
CamCaP Signature p−val <0.001 (−3.98) Significant p−val <0.05 (−1.30) 1_ 24(14)
[image:7.595.91.512.50.470.2]2_ 23(8) 3_ 7(5) 4_ 5(1) 5_ 26(13)
(n = 6) of outliers which dominated the test statistic (Suppl. Fig. 3C). For completeness, we also assessed sample clustering based on clinical risk factors. As expected, surgical Gleason score was a reliable prognos-tic indicator (logrank p = 5 × 10⁻⁶; Suppl. Fig. 4A), but no other clinical covariate tested was statistically significant (Suppl. Fig. 4B–F). To check our approach, we also considered a traditional fold-change analysis, which confirmed, for example,PCA3,GDF15andMSMBtranscript ex-pression as disrupted but unrelated to underlying changes at the DNA level (Fig. 1). We also identified putative tumour suppressorOLFM4to have the highest fold-change in expression (all tumour versus matched benign), an effect recently ascribed to CN loss (19% in our data set) and linked to prostate cancer progression (Li et al., 2013).
3.3. Integrative analysis identifies distinct patient subtypes with
characteristic molecular profiles
Previous studies have shown that most heritable gene expression traits are predominantly controlled by cis-acting proximal loci (b1 Mb), and that these signals are consistently more abundant and sta-ble than more distaltranseffects (Curtis et al., 2012). For an integrative analysis–combining copy number and gene expression data–we selected features displaying linear correlations between CN state and local transcript expression levels, to identify genome-wide expression quantitative trait loci (eQTL) in the discovery data set (see Methods).
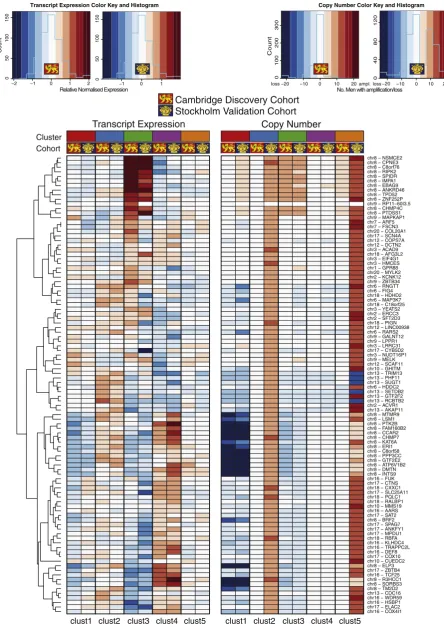
These eQTL features were used in a joint latent variable framework for integrative analysis (iClusterPlus (Mo et al., 2013); seeMethods), which identifiedfive distinct molecular subtypes (iCluster1–5) in the Cambridge cohort with characteristic copy number and gene expression profiles (Fig. 2). These were driven by a core set of 100 genes that had both CN and mRNA level changes (Suppl. Table 6). We confirmed this by comparing the results for alternative numbers of clusters (2–11) and features (100 to 1000) (see Suppl. Fig. 5A–C; Suppl. methods). Thesefive clusters (k= 4; 100 features) describe 60% of the total ob-served variance (Suppl. Fig. 5A). These same 100 gene features were used to train a classifier, and partition the Stockholm data set intofive patient subtypes with characteristic profiles (Suppl. Fig. 6), similar to those described in the discovery cohort.
We assessed transcript and copy number levels for these 100 classi-fying genes for both the discovery and validation cohorts (Fig. 3). There was clear consistency of expression and copy number aberrations in trained clusters with the exception of subsets of genes in iCluster 2 and 5, which displayed marked copy number amplification in the Stockholm cohort. There was consistent copy number loss and down-regulation of expression of genes on chromosome 8 (e.g.MTMR9,
LSM1andER1) in two particular subgroups iCluster 1 and 3, while iCluster 3 was characterised uniquely by copy number gain and upreg-ulation of neighbouring genes on chromosome 8 (e.g.RIPK2,SPIDRand
IMPA1). By contrast, iCluster 4 had consistent copy number loss and
downregulation of genes on chromosome 13 (e.g.TRIM13,PHF11and
SUGT1).
Finally, we considered the sample groups identified by our integra-tive analysis (Fig. 4A) as‘true’clusters with clinical relevance, and com-pared these‘true’clusters to the sample groupings suggested byeither
copy number (Suppl. Fig. 2)orgene expression data alone (Suppl. Fig. 3). We used two different approaches to determine the similarity of the alternative clustering methods to the‘true’clusters. Based on both theAdjusted Rand Index(ARI) (Hubert and Arabie, 1985) and the
Variation of Information Index(VII) (Meilă, 2007), sample clustering
based on CN-data is more similar to integrative (‘true’) clustering than is expression-based clustering (Suppl. Table 7; Suppl. methods).
3.4. Thefive subgroups are prognostic in multiple clinical cohorts
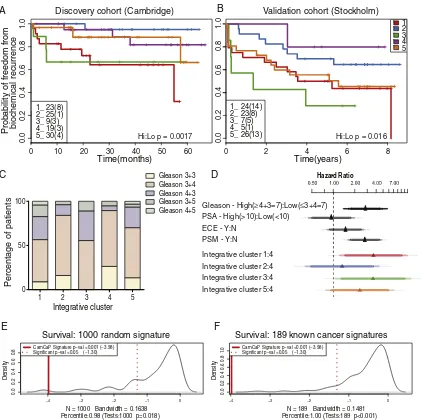
Survival analysis showed that these patient subgroups, driven by the 100-gene set, were predictive of outcome in the Cambridge cohort, and clearly distinguished patient groups with better (e.g. blue line;
iCluster2) and worse prognosis (e.g. red line; iCluster1), based on BCR-survival data over 60 months (logrank p = 0 · 015;Fig. 4A). Clinical characteristics of the primary tumours in each cluster are given in Suppl. Fig. 7, which also shows the distribution of CRPC samples across the clusters. Tumours with poor prognosis Gleason scores (≥4 + 3) are distributed across clusters (Fig. 4C; Kruskal–Wallis p = 0.6194), showing that the molecular subtypes identified are not driven solely by tumour grade. Except for explicable differences in BCR be-tween clusters (chi-squared p = 0.0462), and also extra-capsular ex-tension (chi-squared p = 0.029), these molecular subgroups are not obviously due to other known prostate cancer risk factors (Suppl. Fig. 8), suggesting that these molecular profiles describe additional bio-logical detail that has important prognostic significance.
Thesefive patient clusters were similarly prognostic in our second, novel Stockholm validation cohort (logrank p = 0.048,Fig. 4B), where the extended BCR data (100 months) allowed us to further assess the reliability of the sub-groups in predicting relapse. For example, we found that 56% and 78% of men in iClusters1 and 3 respectively, progressed to relapse disease. Finally, this 100-gene set also replicated in a third, published cohort with similar long-term follow-up (Taylor et al., 2010) (logrank p = 0.027) (Suppl. Fig. 9A; see Suppl. Table 8 & Suppl. Fig. 9B for clinical features of this cohort). Our method assigned 109 patients to clusters with good or poor outcome, similar to the anal-yses in our discovery (n = 125) and replication (n = 103) cohorts. This further demonstrates our gene set's utility and reproducibility in consis-tently identifying patient groups.
Finally, we determined Cox proportional hazard ratios (PHR) for Gleason score (≥4 + 3 = 7 vs≤3 + 4 = 7), PSA levels (highN10ng/ml
vslowb10ng/ml), presence of extra-capsular extension (ECE), and positive surgical margins (PSM). We also compared each subgroup to the best outcome cluster (iCluster4) (Fig. 4D), in a combined analysis of the Cambridge and Stockholm data sets, to ensure sufficient events for robust statistical testing (Peduzzi et al., 1995). We found that iClusters1 and 3 identified men with the highest risk of relapse more ef-fectively than either elevated Gleason score (≥4 + 3), high PSA, ECE or PSM.
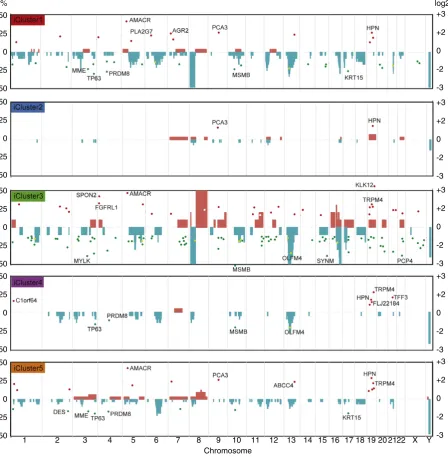
3.5. Genomic features of the molecular subtypes identified
In both the Cambridge and Stockholm data sets, the two groups with the best outcomes (iClusters2 and 4) were notable for having relatively few changes in copy number or expression. Conversely, the two groups with poor outcome (iClusters1 & 3) showed significant genomic insta-bility, with large regions of CN gain and loss evident, as well as many more differentially expressed genes (log2FCb−2 orN+ 2) (Fig. 2) in both cohorts. All cluster-specific differentially expressed genes (DEGs) with log2FCN1.5 orb−1.5 are given in Suppl. Table 9. Notably, dramatic CN changes were not always associated with changes in gene expres-sion level. For example, the marked CN losses and gains at chr8p and 8q respectively, particular to poor-prognosis iCluster3 subtype, were not correlated with marked changes in the expression levels of local genes. Conversely, chromosome 19q harbours multiple genes that were consistently over-expressed in all clusters, but not obviously asso-ciated with CN gains. These includeKLK12(log2FC 3.2 iCluster3;Fig. 2) andHPN(log2FC 1.6–2.2), which have both been linked with prostate cancer aggressiveness (Lose et al., 2013; Holt et al., 2010). Distal gene
FLJ22184at chr19p encodes a conserved calcium-channel protein most
highly expressed in iCluster4 (log2FC 1.7), but is as yet largely uncharacterised.
The previously reported eQTL at tumour suppressor geneOLFM4(Li et al., 2013) (chr13q) showed no change in CN or associated expression level in iCluster2. However, a clear deletion atOLFM4correlated with a marked reduction in transcript levels in iCluster3 (log2FC 2.6) and, to a lesser extent, in iClusters1 and 4 (log2FC 1.9 and 1.7, respectively). Genes typically associated with prostate cancer are evident:PCA3and
all tumour subgroups, and are not subtype-specific. However,AMACR
shows marked over-expression only in the poor outcome iClusters1, 3 and 5 (Fig. 2; Suppl. Table 9). Basal stem cell marker cytokeratin 15
(KRT15; chr17q) was also notably down-regulated in these clusters,
and may therefore be a useful biomarker of more aggressive disease, as has previously been reported in high-grade squamous epithelial neo-plasms (Khanom et al., 2012). In addition,TRPM4(chr19q), encoding a calcium-activated ion channel, is up-regulated in all clusters except best-prognosis iCluster2, and was recently identified as a driver gene in the progression to androgen-independent prostate cancer (Schinke et al., 2014), possibly via its role in cell proliferation andβ-catenin sig-nalling (Armisén et al., 2011). Loss ofMSMBexpression shows the same pattern–markedly reduced in all but good outcome iCluster2– consistent with its reported role in prostate cancer (Grisanzio et al., 2012). Principal components analysis (PCA) of gene signatures that may predict early BCR (Ramos-Montoya et al., 2014; Massie et al., 2011; Sharma et al., 2013; Mendiratta et al., 2009) on the Cambridge mRNA data set identified associations between key pathways in pros-tate cancer and molecular subtype (Suppl. Fig. 10). A summary of probe expression by iCluster is given (Suppl. Fig. 11). Together, these data suggest differences in the expression of transcripts associated with transcription factors such asAR,ERGorHES6(Lamb et al., 2014) within certain prostate cancer subtypes, as well as certain changes in the expression of specific transcripts such asNKX3-1upregulation (iCluster 5),CDH1-up (iCluster 3), cyclin-D1 down (iCluster 2) and
TP53downregulation (iCluster 3), consistent with previousfindings (Markert et al., 2011).
Recent reports have also shown that genomic instability itself–as measured by the percentage of the genome affected (PGA) by copy number changes–is also highly prognostic of PSA recurrence (Taylor et al., 2010; Lalonde et al., 2014; Hieronymus et al., 2014). We therefore determined the PGA for each patient iCluster in both discovery and validation cohorts (seeMethods), and found that genomic instability differs significantly between each genomic subtype in both datasets (Suppl. Fig. 12): Kruskal–Wallis p = 4.463 e−11 (Cambridge); p = 0.0009246 (Stockholm). In each case, iCluster3 showed the highest per-centage of genome affected, in keeping with our observations that this subgroup has the most genomic‘activity’(Fig. 2).
3.6. Gene signature pathway analysis
The 100 gene set includes six protein kinases (MAP3K7,MYLK2,
RIPK2,PTK2B,MELK,ACVR1) andfive transcription factors (TRIM13,
GTF2E2, PHF11, ERCC3, GTF2F2). Gene ontology analysis revealed
pathways relating to RNA and DNA processing, specifically sequence-specific transcription factor and nucleic acid binding, as well as the phosphorylation of proteins were strongly associated with this set (http://www.pantherdb.org/&Zhang et al., 2005) (Suppl. Fig. 13).
We assessed whether there were any genes in common between our gene set and the top 100 genes with the most variable expression between tumours (presumed therefore to be the most informative in clustering based on expression (Gorlov et al., 2012, 2014) Suppl Fig. 3, Suppl. Tables 5 & 6), but found no overlap. Of the 1493 common CNAs identified in our discovery cohort (Suppl. Table 4), 49 (3.3%) were in our gene set (Suppl. Fig. 14A). We found further limited overlap be-tween our gene set and any other published genes associated with risk in prostate cancer, based either on recurrent CN changes (Williams et al., 2014; 1 gene in common, out of 24), or transcript pro-filing (Gorlov et al., 2014; 5 genes in common, out of 135) (Suppl. Fig. 14B). As such, our eQTL-based approach has identified 94 additional gene targets that would not have been identified using copy number or transcript profiling data alone.
Within our 100-gene set, onlyMAP3K7(6q15) is known to harbour recurrent CNAs in prostate cancer (Suppl. Fig. 13B & Suppl. Table 3). Deletions inMAP3K7have recently been associated with early PSA recurrence, and in tumours that do not contain theTMPRSS2-ERGgene
fusion, a tumour-suppressor role forMAP3K7 has been proposed (Kluth et al., 2013). Overlapping the 100-gene set with differentially expressed genes from iCluster4 (best prognosis) and all other sample subgroups combined (all non-iCluster4 DEGs), identified two targets within the 100-gene set with the potential to distinguish subgroup iCluster4 from any other patient subtype with respect to gene expres-sion levels (≥2-fold expression change; Suppl. Fig. 14C). These were
CHMP4C(8q21, CNAs in 12%; 2-fold expression change in cluster3), a
chromatin-modifying protein the promoter of which contains transcrip-tion factor binding sites for multiple cell cycle control genes, and receptor-interacting protein kinase 2 (RIPK2) (8q21, CNAs in 14%, 2.5-fold change in cluster3). Ubiquitinated RIPK2 binds withMAP3K7/
TAK1, translocates to the nucleus and activates a transcriptional cascade involving genes controlling cellular growth, protection against apopto-sis and inflammatory response via NF-κB activation (Hasegawa et al., 2008).
Our 100-gene set also showed‘genomic alteration’(amplifications, deletions, missense or truncating mutations, and mRNA and protein level changes) in 249/257 prostate cancer samples with complete data at TCGA (the Cancer Genome Atlas;www.cbioportal.org).CHMP7and
CCAR2were the most frequently genomically altered genes in the
signa-ture, in 47% and 42% of samples, respectively.EIF4G1was also notable in that it was the only gene altered at the protein level in 14% of TCGA prostate cancer samples tested, measured by reverse-phase protein arrays (RPPA), which suggests it may be a useful histological biomarker.
3.7. The gene signature is prognostic
We tested the prognostic usefulness of the 100 CN and expression features contained within our integrated gene-set on the Stockholm cohort (Table 1&Methods). We found that the 100-gene signature showed significant power to separate out a poor prognosis patient group with quicker time to recurrence (chi-squared 0.017) in this large validation cohort (Suppl. Fig. 15A, B). We sought to refine this set further and identified subsets of approximately 50 genes (including copy number and expression features) that best defined each of thefive iCluster groups (see Suppl. methods). We selected the most informative subset of genes that predicted biochemical relapse to take forward as a signature (iCluster 4; Suppl. Fig. 16, Suppl. Table 10).
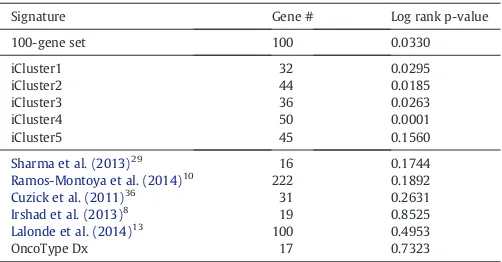
[image:9.595.311.562.612.743.2]Since there are several cancer gene signatures available, we tested the performance of our refined signature against other signatures. First, we compared it against 1000 randomly selected sets of compara-ble number of genes (Suppl. methods, Suppl. Fig. 17) (Venet et al., 2011). Our gene signature was in the 98th percentile of performance (pb0.001), with only 18 out of 1 000 random 50-gene signatures doing better in predicting relapse in the Stockholm data set (Fig. 4E, F). Then we tested how well previously identified oncogenic signatures were able to predict prognosis in our validation set. Initially, we consid-ered 189 known oncogenic signatures from multiple cancer types in MSigDB (Subramanian et al., 2005). A number of the known signatures
Table 3
Performance of signatures in predicting relapse in Stockholm validation cohort.
Signature Gene # Log rank p-value
100-gene set 100 0.0330
iCluster1 32 0.0295
iCluster2 44 0.0185
iCluster3 36 0.0263
iCluster4 50 0.0001
iCluster5 45 0.1560
Sharma et al. (2013)29
16 0.1744
Ramos-Montoya et al. (2014)10 222 0.1892 Cuzick et al. (2011)36 31 0.2631 Irshad et al. (2013)8
19 0.8525
Lalonde et al. (2014)13
100 0.4953
exhibit prognostic power; however our signature outperforms each one (pb0.001; Suppl. methods) (Suppl. Fig. 16). Next, we compared our gene signature to previously published signatures for prostate cancer (Irshad et al., 2013; Ramos-Montoya et al., 2014; Lalonde et al., 2014; Sharma et al., 2013; Cuzick et al., 2011) as well as the Oncotype Dx Prostate Cancer assay (see Suppl. Table 11; Suppl. methods) to deter-mine if our genes have prognostic power beyond other possible gene sets. It should be noted that there was limited overlap between the signatures (Suppl. Fig. 18). Our 100-gene signature outperformed all other gene sets in identifying patients with early time to biochemical relapse in the Stockholm cohort (p = 0.0001;Table 3).
4. Discussion
We have demonstrated that the integration of copy number and transcript profiling data provides effective risk stratification of men with localised prostate cancer in two novel, distinct cohorts totalling 259 men.
Previous approaches to partitioning samples have concentrated mainly on mRNA biomarkers (Suppl. Table 11). We have clearly shown that combining these two approaches in an eQTL analysis is more powerful in predicting outcome (Fig. 4), as well as in identifying new gene targets also likely to be functionally relevant (Suppl. Table 7). This insight may be particularly helpful to future studies in-volving large data sets with multiple classes of genomic information, for example the Cancer Genome Atlas (TCGA) or the International can-cer Genome Consortium (ICGC) that are relying on ever higher-resolution next-generation sequencing approaches to stratify patients and identify disease-specific driver mutations. In such studies it will be important to determine which genomic modifications are redundant and which are functionally relevant to the disease.
Our prostate cancer gene signature is associated with a distinct set of processes (nucleic acid processing, TF-binding and phosphorylation of proteins) compared to others that relate to cell-cycle control (Ramos-Montoya et al., 2014; Cuzick et al., 2011) or lipid metabolism (Lalonde et al., 2014). Nonetheless, there appears to be scant overlap between prostate cancer gene signatures generally (Suppl. Fig. 17), possibly due to the trend in generating ever smaller gene signatures. Despite this, our refined 100-gene set seems, in our analysis, to be more informative than any other published signature to date (Suppl. Table 12), and as such presents a practically useful, robust tool to help clinicians distinguish good and poor outcome disease. Furthermore, we propose that that it may help tackle the confounding effects of multi-focal heterogeneity highlighted recently in an in-depth whole genome sequencing study of three patients with prostate cancer (Cooper et al., 2015).
Three recent studies have addressed the question of heterogeneity within prostate cancer, identifying multiple foci of differing clonal origin in each case (Cooper et al., 2015; Gundem et al., 2015; Hong et al., 2015) and suggesting that single tissue samplings of a prostate risks missing information about the most important tumour clone. We are unable to address this directly in our study. However, we ensured that our specimens contained a minimum 20% tumour (range 20–90%), and fur-ther validated ourfindings in a more strictly defined, mature validation cohort (Stockholm;≥70% tumour content; mean 78 month follow-up). The robust replication of our initialfindings suggests that single sam-pling is adequate when translated to a large enough cohort of patients. We also had the opportunity to compare matched tumour and benign samples to germline DNA in order to assessfield effects (n = 64 triple matched samples). This will, no doubt, be of interest to the aforemen-tioned larger studies (TCGA, ICGC) which also depend mainly on single samples taken from men with prostate cancer. We suspect that addi-tional information will also be provided by sampling of genomic alter-ations from the cell-free DNA in the blood, and look forward to future publications investigating this approach in prostate cancer (see
Murtaza et al. (2013)).
Our data showed that tumours with poor prognosis Gleason sums (≥7) were distributed across allfive clusters, suggesting that the molecular subtypes identified are not solely driven by histology. Other biomarkers (elevated PSA,TMPRSS2-ERGdeletion) were also represented (Fig. 3C, Suppl. Fig. 8) across thefive patient subtypes. Furthermore, the most powerful subtype as regards prognosis was patient subtype iCluster3, associated with the most marked changes at the molecular level, and predictive of early biochemical relapse. Further analysis of this subgroup for mutations not detectable by copy number or SNP anal-ysis could identify additional, prognostic molecular markers. Importantly, we demonstrate that we can predict disease relapse based on a refined subgroup of our classifying gene set, and show the superiority of this signature compared to other available signatures (Table 3). Nonetheless, we acknowledge the shortcomings of using biochemical relapse as a surrogate for survival. We anticipate that these prognostic clusters will be further tested alongside other parameters as more mature cohorts become available with reliable disease-specific and overall survival data. Ourfindings are clinically significant because they will assist urolo-gists in recommending different treatment approaches for those men who are classified as being in low, intermediate or high risk categories according to conventional clinical criteria. To this end, we present the case of a man within iCluster3 subgroup who had low/intermediate risk disease on clinical assessment (Gleason 3 + 4, PSAb 10, T stagebT2c) but who relapsed early (Suppl. material). We propose that in future, men will be assigned membership to molecular groups such as this, and that this profiling will greatly assist their clinical management. Molecular signatures associated with the most aggressive disease will provide a rationale for early adjuvant treatment immediately after prostatectomy, or indeed after initial biopsy when such technologies can be applied to an 18 mm core biopsy. Further functional analyses of the gene targets presented here will also help us to better understand the biological consequences of tumour-associated molecular alteration. As such, we present a triple-matched resource of prostate cancer copy number and expression profiling data, with matched benign tissue and blood, as well as a fully annotated TMA as an invaluable tool for further translational research into the mutational landscapes of primary and castrate-resistant prostate cancers.
Author contributions
HRA, ADL, JC, RH, ARM, JK, HW conducted experimental work; ADL, VG, NLS, NCS, CSC, HG, DEN were responsible for patient recruitment and sample collection; ADL, JL, HRA, NLS were responsible for clinical follow-up; HRA, ADL, HG, IGM, DEN contributed to study design; AYW, LAE, JC performed histopathology; MJD, SH, SLV, RS, CMM, AGL, HRA, RR performed analyses; HRA, ADL, MJD, RS, wrote the manuscript. All authors read and approved thefinal manuscript submission.
Declaration
The authors declare that they have no competing interests.
Data and material availability
Study data are deposited in NCBI GEO (unique identifier number GSE70770). Associated sample TMAs are available on request.
CamCaP Study Group
Co-ChairsAlastair Lamb and Helen Ross-Adams.
Gnanpragasam, Andrew Doble, Christof Kastner, Tevita 'Aho, Anne War-ren, Beverley Haynes, Wendy Partridge, Elizabeth Cromwell, Asif Sangrasi, Jo Burge, Anne George, Sara Stearn, Marie Corcoran, Hansley Coret, Gillian Basnett, Indu Francis; Karolinska Institutet Henrik Gronberg (Principal Investigator), Lars Egevad, Thomas Whitington, Johan Lindberg.
Genomic/transcriptomic/histopathology analysis: Cancer Research UK Cambridge InstituteDavid Neal (Principal Investigator), Ian Mills, Helen Ross-Adams, Alastair Lamb, Mark Dunning, Rory Stark, Charlie Massie, Andy Lynch, Roslin Russell, Silvia Halim, Antonio Ramos-Montoya, Sarah Vowler, Hayley Whitaker, Jonathan Kay, Yinyin Yuan, Oscar Rueda, James Hadfield, Will Howat, Jodi Miller;University of East Anglia, NorwichColin Cooper (Principal Investigator), Jeremy Clark, Rachel Hurst, Daniel Brewer; Karolinska Institutet Henrik Gronberg (Principal Investigator), Lars Egevad, Thomas Whitington, Johan Lindberg.
Supplementary data to this article can be found online athttp://dx. doi.org/10.1016/j.ebiom.2015.07.017.
Acknowledgements
We thank those men with prostate cancer and the subjects who have donated their time and samples to the Wellcome Trust Clinical Research Facility, Addenbrooke's Clinical Research Centre, Cambridge, for their participation. We acknowledge the support of research staff in S4 who curated the samples and the follow-up data (Johanna Burge, Marie Corcoran, Anne George, and Sara Stearn), as well as Beverley Haynes at Addenbrooke's Hospital Human Research Tissue Bank. We acknowledge the support of the National Cancer Research Institute (National Institute of Health Research (NIHR)) collaborative study Prostate Cancer: Mechanisms of Progression and Treatment
(ProMPT)(grant G0500966/75466), which funded tissue and urine
col-lections in Cambridge. We thank the NIHR, University of Cambridge, Cancer Research UK and Hutchison Whampoa Limited, and Cancer Re-search UK Cambridge Institute Genomics and Bioinformatics core facil-ities. We thank Dr Christopher Yau at Nuffield Dept. for Medicine, University of Oxford, and Dr Oscar Rueda at CRUK Cambridge Institute, University of Cambridge, for their advice regarding data analysis in OncoSNP and iClusterPlus respectively. Cambridge work was funded by a CRUK programme grant CRUK grant C5047/A14835 awarded to DEN; Swedish work and tissue collections were funded by grants from the Linne ́Centre for Breast and Prostate Cancer (CRISP, grant 70867901), Karolinska Institutet, the Swedish Research Council (K2010-70X-20430-04-3), and the Swedish Cancer Society (11–0287). Funding bodies had no role in the decision to publish this report.
References
Armisén, R., Marcelain, K., Simon, F., et al., 2011.TRPM4 enhances cell proliferation through up-regulation of theβ-catenin signaling pathway. J. Cell. Physiol. 226 (1), 103–109.
Attard, G., Clark, J., Ambroisine, L., et al., 2008.Duplication of the fusion of TMPRSS2 to ERG sequences identifies fatal human prostate cancer. Oncogene 27 (3), 253–263.
Barbosa-Morais, N.L., Dunning, M.J., Samarajiwa, S.A., et al., 2010.A re-annotation pipeline for Illumina BeadArrays: improving the interpretation of gene expression data. Nucleic Acids Res. 38 (3), e17.
Catalona, W.J., Richie, J.P., Ahmann, F.R., et al., 1994.Comparison of digital rectal examina-tion and serum prostate specific antigen in the early detection of prostate cancer: results of a multicenter clinical trial of 6,630 men. J. Urol. 151 (5), 1283–1290.
Chalise, P., Koestler, D.C., Bimali, M., Yu, Q., Fridley, B.L., 2014.Integrative clustering methods for high-dimensional molecular data. Transl. Cancer Res. 3 (3), 202–216.
Clark, J., Attard, G., Jhavar, S., et al., 2008.Complex patterns of ETS gene alteration arise during cancer development in the human prostate. Oncogene 27 (14), 1993–2003.
Cooper, C.S., Eeles, R., Wedge, D.C., et al., 2015.Analysis of the genetic phylogeny of multifocal prostate cancer identifies multiple independent clonal expansions in neo-plastic and morphologically normal prostate tissue. Nat. Genet. 47 (4), 367–372.
Curtis, C., Shah, S.P., Chin, S.F., et al., 2012.The genomic and transcriptomic architecture of 2,000 breast tumours reveals novel subgroups. Nature 486 (7403), 346–352.
Cuzick, J., Swanson, G.P., Fisher, G., et al., 2011.Prognostic value of an RNA expression signature derived from cell cycle proliferation genes in patients with prostate cancer: a retrospective study. Lancet Oncol. 12 (3), 245–255.
Dunning, M.J., Smith, M.L., Ritchie, M.E., Tavare, S., 2007.beadarray: R classes and methods for Illumina bead-based data. Bioinformatics 23 (16), 2183–2184.
Dunning, M.J., Curtis, C., Barbosa-Morais, N.L., Caldas, C., Tavare, S., Lynch, A.G., 2010.The importance of platform annotation in interpreting microarray data. Lancet Oncol. 11 (8), 717.
Gleason, D.F., 1966.Classification of prostatic carcinomas. Cancer Chemother. Rep. 50 (3), 125–128.
Gleason, D.F., Mellinger, G.T., 1974.Prediction of prognosis for prostatic adenocarcinoma by combined histological grading and clinical staging. J. Urol. 111 (1), 58–64.
Glinsky, G.V., Glinskii, A.B., Stephenson, A.J., Hoffman, R.M., Gerald, W.L., 2004.Gene expression profiling predicts clinical outcome of prostate cancer. J. Clin. Invest. 113 (6), 913–923.
Gorlov, I.P., Byun, J., Zhao, H., Logothetis, C.J., Gorlova, O.Y., 2012.Beyond comparing means: the usefulness of analyzing interindividual variation in gene expression for identifying genes associated with cancer development. J. Bioinforma. Comput. Biol. 10 (2), 1241013–1241031.
Gorlov, I.P., Yang, J.Y., Byun, J., et al., 2014.How to get the most from microarray data: advice from reverse genomics. BMC Genomics 15, 223.
Grisanzio, C., Werner, L., Takeda, D., et al., 2012.Genetic and functional analyses implicate the NUDT11, HNF1B, and SLC22A3 genes in prostate cancer pathogenesis. Proc. Natl. Acad. Sci. U. S. A. 109 (28), 11252–11257.
Gundem, G., Van Loo, P., Kremeyer, B., et al., 2015.The evolutionary history of lethal metastatic prostate cancer. Nature 520 (7547), 353–357.
Hasegawa, M., Fujimoto, Y., Lucas, P.C., et al., 2008.A critical role of RICK/RIP2 polyubiquitination in Nod-induced NF-κB activation. EMBO J. 27 (2), 373–383.
Hieronymus, H., Schultz, N., Gopalan, A., et al., 2014.Copy number alteration burden pre-dicts prostate cancer relapse. Proc. Natl. Acad. Sci. U. S. A. 111 (30), 11139–11144.
Holt, S.K., Kwon, E.M., Lin, D.W., Ostrander, E.A., Stanford, J.L., 2010.Association of hepsin gene variants with prostate cancer risk and prognosis. Prostate 70 (9), 1012–1019.
Hong, M.K., Macintyre, G., Wedge, D.C., et al., 2015.Tracking the origins and drivers of subclonal metastatic expansion in prostate cancer. Nat. Commun. 6, 6605.
Hubert, L., Arabie, P., 1985.Comparing partitions. J. Classif. 2 (1), 193–218.
Irshad, S., Bansal, M., Castillo-Martin, M., et al., 2013.A molecular signature predictive of indolent prostate cancer. Sci. Transl. Med. 5 (202), 202ra122.
Johnson, W.E., Li, C., Rabinovic, A., 2007.Adjusting batch effects in microarray expression data using empirical Bayes methods. Biostatistics 8 (1), 118–127.
Khanom, R.S,.K., Pal, S.K., Shimada, Y., Morita, K., Omura, K., Miki, Y., Yamaguchi, A., 2012.
Expression of basal cell keratin 15 and keratin 19 in oral squamous neoplasms represents diverse pathophysiologies. Histol. Histopathol. 27 (7), 10.
Kluth, M., Hesse, J., Heinl, A., et al., 2013.Genomic deletion of MAP3K7 at 6q12-22 is as-sociated with early PSA recurrence in prostate cancer and absence of TMPRSS2:ERG fusions. Mod. Pathol. 26 (7), 975–983.
Lamb, A.D., Massie, C.E., Neal, D.E., 2014.The transcriptional programme of the androgen receptor (AR) in prostate cancer. BJU Int. 113 (3), 358–366.
Lalonde, E., Ishkanian, A.S., Sykes, J., et al., 2014.Tumour genomic and microenvironmental heterogeneity for integrated prediction of 5-year biochemical recurrence of prostate cancer: a retrospective cohort study. Lancet Oncol. 15 (13), 1521–1532.
Li, H., Rodriguez-Canales, J., Liu, W., et al., 2013.Deletion of the olfactomedin 4 gene is associated with progression of human prostate cancer. Am. J. Pathol. 183 (4), 1329–1338.
Liu, W., Lindberg, J., Sui, G., et al., 2012.Identification of novel CHD1-associated collabora-tive alterations of genomic structure and functional assessment of CHD1 in prostate cancer. Oncogene 31 (35), 3939–3948.
Liu, W., Xie, C.C., Thomas, C.Y., et al., 2013.Genetic markers associated with early cancer-specific mortality following prostatectomy. Cancer 119 (13), 2405–2412.
Lose, F., Batra, J., O'Mara, T., et al., 2013.Common variation in Kallikrein genes KLK5, KLK6, KLK12, and KLK13 and risk of prostate cancer and tumor aggressiveness. Urol. Oncol. 31 (5), 635–643.
Lynch, A.G., Chin, S.F., Dunning, M.J., Caldas, C., Tavare, S., Curtis, C., 2012.Calling sample mix-ups in cancer population studies. PLoS One 7 (8), e41815.
Markert, E.K., Mizuno, H., Vazquez, A., Levine, A.J., 2011.Molecular classification of pros-tate cancer using curated expression signatures. Proc. Natl. Acad. Sci. U. S. A. 108 (52), 21276–21281.
Massie, C.E., Lynch, A., Ramos-Montoya, A., et al., 2011.The androgen receptor fuels prostate cancer by regulating central metabolism and biosynthesis. EMBO J. 30 (13), 2719–2733.
Meilă, M., 2007.Comparing clusterings—an information based distance. J. Multivar. Anal. 98 (5), 873–895.
Mendiratta, P., Mostaghel, E., Guinney, J., et al., 2009.Genomic strategy for targeting therapy in castration-resistant prostate cancer. J. Clin. Oncol. 27 (12), 2022–2029.
Mo, Q., Wang, S., Seshan, V.E., et al., 2013.Pattern discovery and cancer gene
identi-fication in integrated cancer genomic data. Proc. Natl. Acad. Sci. U. S. A. 110 (11), 4245–4250.
Mottet, N., B, P.J., Bellmunt, J., van den Bergh, R.C.N., Bolla, M., van Casteren, N.J., Cornford, P., Joniau, S., Mason, M.D., Matveev, V., van der Kwast, T.H., van der Poel, H., Rouvière, O., Wiegel, T., 2014. Guidelines on Prostate Cancer.http://www.uroweb.org/gls/pdf/ 09%20Prostate%20Cancer_LRLV2.pdf(accessed 20 June 2014).
Murtaza, M., Dawson, S.J., Tsui, D.W., et al., 2013.Non-invasive analysis of acquired resistance to cancer therapy by sequencing of plasma DNA. Nature 497 (7447), 108–112.
Peduzzi, P., Concato, J., Feinstein, A.R., Holford, T.R., 1995.Importance of events per independent variable in proportional hazards regression analysis II. Accuracy and precision of regression estimates. J. Clin. Epidemiol. 48 (12), 1503–1510.
Schinke, E.N., Bii, V., Nalla, A., et al., 2014.A novel approach to identify driver genes involved in androgen-independent prostate cancer. Mol. Cancer 13, 120–132.
Sharma, N.L., Massie, C.E., Ramos-Montoya, A., et al., 2013.The androgen receptor induces a distinct transcriptional program in castration-resistant prostate cancer in man. Cancer Cell 23 (1), 35–47.
Smyth, G.K., 2004.Linear models and empirical bayes methods for assessing differential expression in microarray experiments. Stat. Appl. Genet. Mol. Biol. 3 (Article3).
Subramanian, A., Tamayo, P., Mootha, V.K., et al., 2005.Gene set enrichment analysis: a knowledge-based approach for interpreting genome-wide expression profiles. Proc. Natl. Acad. Sci. 102 (43), 15545–15550.
Sun, J., Liu, W., Adams, T.S., et al., 2007.DNA copy number alterations in prostate cancers: a combined analysis of published CGH studies. Prostate 67 (7), 692–700.
Taylor, B.S., Schultz, N., Hieronymus, H., et al., 2010.Integrative genomic profiling of human prostate cancer. Cancer Cell 18 (1), 11–22.
Tomlins, S.A., Mehra, R., Rhodes, D.R., et al., 2007.Integrative molecular concept modeling of prostate cancer progression. Nat. Genet. 39 (1), 41–51.
Van Loo, P., Nordgard, S.H., Lingjærde, O.C., et al., 2010.Allele-specific copy number analysis of tumors. Proc. Natl. Acad. Sci. U. S. A. 107 (39), 16910–16915.
Varambally, S., Yu, J., Laxman, B., et al., 2005.Integrative genomic and proteomic analysis of prostate cancer reveals signatures of metastatic progression. Cancer Cell 8 (5), 393–406.
Venet, D., Dumont, J.E., Detours, V., 2011.Most random gene expression signatures are significantly associated with breast cancer outcome. PLoS Comput. Biol. 7 (10), e1002240.
Wang, K., Li, M., Hadley, D., et al., 2007.PennCNV: an integrated hidden Markov model designed for high-resolution copy number variation detection in whole-genome SNP genotyping data. Genome Res. 17 (11), 1665–1674.
Warren, A.Y., Whitaker, H.C., Haynes, B., et al., 2013.Method for sampling tissue for research which preserves pathological data in radical prostatectomy. Prostate 73 (2), 194–202.
Williams, J.L., Greer, P.A., Squire, J.A., 2014.Recurrent copy number alterations in prostate cancer: an in silico meta-analysis of publicly available genomic data. Cancer Gen. 207 (10–12), 474–488.
Yau, C., Mouradov, D., Jorissen, R.N., et al., 2010.A statistical approach for detecting genomic aberrations in heterogeneous tumor samples from single nucleotide poly-morphism genotyping data. Genome Biol. 11 (9), R92.
Yin, T., Cook, D., Lawrence, M., 2012.ggbio: an R package for extending the grammar of graphics for genomic data. Genome Biol. 13 (8), R77.
Yuan, Y., Failmezger, H., Rueda, O.M., et al., 2012.Quantitative image analysis of cellular heterogeneity in breast tumors complements genomic profiling. Sci. Transl. Med. 4 (157), 157ra43.