Interpretable feature maps for robot attention
Kasim Terzi´ca,b and J.M.H. du Bufb
a
School of Computer Science, University of St Andrews, KY16 9SX Scotland
b
University of the Algarve, Faro 8000, Portugal
Abstract. Attention is crucial for autonomous agents interacting with complex environments. In a real scenario, our expectations drive atten-tion, as we look for crucial objects to complete our understanding of the scene. But most visual attention models to date are designed to drive attention in a bottom-up fashion, without context, and the features they use are not always suitable for driving top-down attention. In this paper, we present an attentional mechanism based on semantically meaningful, interpretable features. We show how to generate a low-level semantic representation of the scene in real time, which can be used to search for objects based on specific features such as colour, shape, orientation, speed, and texture.
1
Introduction
Scene interpretation is a process which aims at providing a rich semantic descrip-tion of the observed world. This includes all the observable objects and complex relations between them, which provide a sufficient basis for reasoning and action planning. It is a very complex problem which must be solved by many different processes acting together, including image pre-processing, low-level feature ex-traction, edge and line grouping, disparity and motion processing, segmentation, classification, and reasoning.
Each one of these processes can be improved by information obtained from other channels. This is evidenced by many visual illusions which become trivial once additional context is given, and by the large number of feedback connections in the primate visual cortex. Much literature shows that accurate segmentation makes object recognition easier, and that using strong top-down object models can provide good segmentation. However, all current scene interpretation sys-tems struggle when faced with a completely new scene and thousands of visual categories and potential scenarios.
2
Related Work
One of the most influential salience models was introduced by Laurent Itti, Christof Koch and Ernst Niebur [13, 12] In their approach, salience is seen as a filtering problem which detects salient regions using Difference-of-Gaussians filters at multiple scales. The input is represented as feature maps consisting of colour channels and responses of oriented Gabor filters. Recently, this approach has been modified to detect larger salient regions instead of points by Frintrop et al.[5], showing the continued appeal of the approach. Other modifications include weighting the different feature maps after identifying useful features [11] and exploring the role of saliency in overt attention [19]. When combined with traditional segmentation methods, eye fixation maps can segment salient objects in the image [16].
Salience has also been implemented in terms of visual perception [7], graph-based visual salience [9], and object-graph-based saliency features [8]. Additionally, salience has also been modelled as a discriminant process [6] and as a regression problem [14]. Multi-scale processing has been shown to improve salience on small-scale, high-contrast patterns [26].
In recent years, the focus has shifted towards detecting entire salient objects, usually in complex scenes. This is a very important step for providing top-down feedback for scene understanding in artificial intelligence [10, 21] and cognitive robotics [23]. Many current approaches to salience try to segment an entire ob-ject, typically modelling regions according to their colour and luminance [1], contrast [3, 2] or dissimilarity [4]. Another approach is to learn a correct fore-ground object segmentation from a set of training images [17].
All of these methods merely detect salient regions in a bottom-up, pre-attentive fashion, and these regions then need to be classified in order to un-derstand the scene, as in [18]. However, vision is a complex interplay between bottom-up and top-down processes, and attention is also driven by high-level expectations [10, 15], which is why it should be possible for high-level concepts about colour and shape to determine what is salient in an image. This is the approach often taken in cognitive robotics, where there is tight coupling between feature representation and action [27]. We believe that powerful scene interpre-tation can be built on top of interpretable, semantically meaningful features, which can simplify top-down queries because they directly relate to higher-level descriptions.
3
Salience Based on Local Feature Channels
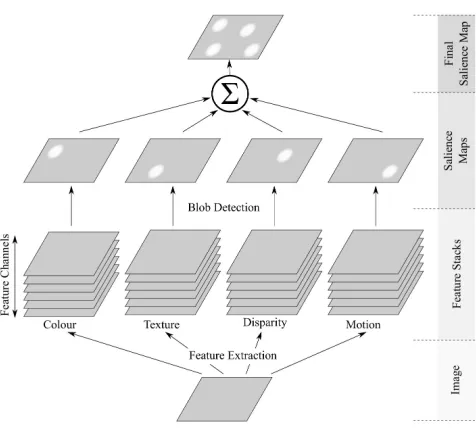
Fig. 1.Schematic diagram showing feature-based salience.
we obtain by combining different shape fragments into elementary shapes, and local complexity, which we obtain from end-stopped cells with large receptive fields.
Our implementation differs from most in that each of these features is en-coded in a way that is semantically meaningful: each of the features can be interpreted in terms of high-level concepts such as “smooth”, “red”, “fast” or “square.” This makes top-down driven attention possible.
We use four low-level feature channels for finding salient regions in the image: colour, texture, disparity and motion (see Fig.1). Feature-based salience is based on stacks S of retinotopic maps M which represent populations of cells, each map representing a specific feature value: e.g. a stack of colours (red, green, etc.), specific distances, or specific dominant directions of motion:
Sf =
Mf1, . . . , MfN , (1)
3.1 Colour
We construct a stack of 6 retinotopic maps representing different channels in the CIE L*a*b* colour-opponent space. The CIE L*a*b* model is based on retinal cones and provides a standard way to model biological colour opponency. The first three channels of the feature stack code the image in the Lab colour space, and thus represent white, green and blue colour components. The second three channels are the inverse of the first three channels and thus represent black, red and yellow components. All channels are scaled to fit within the interval [0. . .1]:
for1≤n≤3 Mcolourn (x, y) = ImageL∗a∗b∗(x, y)[n], (2)
for4≤n≤6 Mcolourn (x, y) = 1−Mcolourn−3 (x, y). (3)
Since each feature channel measures similarity to a basic colour, it is possible to perform queries based on these basic colours.
3.2 Disparity
We use a Kinect sensor to provide real-time depth information, but a disparity algorithm could easily be substituted instead. We represent disparities by a stack of retinotopic maps, with each map containing cells tuned to one particular distance. A neuron will react strongly to the correct disparity and its response is reduced as the disparity moves away from the preferred one. We organise these cells in a stack of retinotopic maps, where each map represents a certain preferred disparity. Constant disparity produces constant regions within the stack, whereas sharp changes in disparity result in discontinuities which are exploited in the final blob detection step:
Mdispn (x, y) =|Dobserved(x, y)−Dpreferred(n)|. (4)
In this representation, the layers represent “near”, “far” and “medium-distance” objects.
3.3 Texture
Our texture module is based on our previous work on texture discrimination [22]. The local power spectrum of a texture at a given pixel location can be estimated by a set of oriented Gabor filters, corresponding to the responses of complex cells at that location. The power spectrum is interpreted as a 2D matrix with orientation o and frequency f as the two principal axes. Since the spectrum often has the shape of an elongated 2D Gaussian, we approximate it with a Gaussian mixture model using five parameters:
P ≈g·exp −(f−µf) 2
2σ2 f
! exp
−(o−µ o)2 2σ2
o
here µo andµf represent the location of the mean andσo andσf the standard deviation in two dimensions. The mean is estimated by finding the location of the maximum in the spectrum matrix, and the standard deviations are calculated from the row and column vectors obtained by summing rows and columns, re-spectively. An additional parameter= (σf−σo)/(σf+σo) allows to distinguish isotropic from anisotropic textures.
The benefit of this texture representation is that it is, once again, seman-tically meaningful. The different feature dimensions represent isotropy (“ori-ented pattern” vs. “not ori(“ori-ented”), dominant orientation (“horizontal pattern” vs. “vertical pattern”) and dominant scale (“coarse” vs. “fine”) which can be used to direct attention to relevant parts of the image.
3.4 Optical Flow
Optical flow is a major field in Computer Vision and we use the standard OpenCV implementation as our first step. As with other features, we then en-code this information in an easy-to-interpret format. The feature stack contains 8 maps representing 8 directions of motion (above a minimum speed threshold), with values on the interval [0. . .1]:
Mmotionn (x, y) =|θobserved(x, y)−θpreferred(n)|. (6)
In words, 1 occurs when a pixel is moving in the preferred direction, and 0 occurs when the pixel is not moving or moves in the opposite direction. Intermediate values indicate that the pixel is moving in a direction similar to the preferred di-rection. There is one additional map representing motion speed. Objects moving in a certain direction will thus cause large coherent regions in one of the maps of the stack which lead to salience peaks after the blob detection step.
This representation allows us to describe parts of the image as “stationary”, “slow-moving” and “fast-moving”, as well as to identify the direction of move-ment using one of the 8 principal directions. In an active vision scenario, we could focus attention on fast moving objects, or objects moving in a specific direction without having to generate expected feature values.
3.5 Feature-based Blob Detection
After extracting the feature stacks Sf, each individual map of each stack is filtered:
Bfn,m=Mfn∗Kblobm , (7)
whereKblobis a Difference of Gaussians blob detection kernel
Kblobm = exp
−(x2+y2)
2σ2 m
−Nmexp
−(x2+y2)
2(2σm)2
, (8)
withNma normalising constant which makesKblobm a pure bandpass filter. This
maps in each stack are summed and normalised to the range [0,1]. This yields a salience map for the featuref:
SMf = normalise X
n,m Bn,mf
!
. (9)
The final local-feature-based salience map SMLF is obtained by computing the weighted sum of all local features types:
SMLF= X
f
wfSMf. (10)
Figure 1 illustrates this process. The result is a bottom-up, pre-attentive salience map of the scene.
3.6 Salience Based on Shape
Shape is an important salience cue, and one of the most important features for object detection. We use a Bayesian detection framework [20]. In contrast to that work, shape detection is simpler, and works with larger descriptors and fewer features.
During a learning phase, the system is shown several basic shapes such as rectangles, squares, circles and cylinders. Keypoints are extracted from the im-ages of these basic shapes, and a local descriptor is computed at each point, at 16 different orientations. For each descriptor, the offset to the shape centre is recorded, and normalised by dividing it by the keypoint scale. In contrast to object detection, descriptors are extracted over larger regions surrounding the keypoint, to capture larger parts of the global shape.
The detection process in a novel image also begins by extracting keypoints from the image, and extracting the corresponding local descriptors. Each de-scriptor is compared to the dede-scriptors extracted during learning, at all orienta-tions. The offset corresponding to the best-matching descriptor is used to add a “vote” to the corresponding location in the neural map representing the shape associated with the winning descriptor. These votes are finally summed using the summing kernels as described in [20].
As with local features, the shapes are based on four basic shapes and designed to be easily interpreted. This makes it possible to search for specific shapes (e.g. “round”) in a top-down manner, without performing object-detection on the entire image first.
3.7 Salience Based on Local Complexity
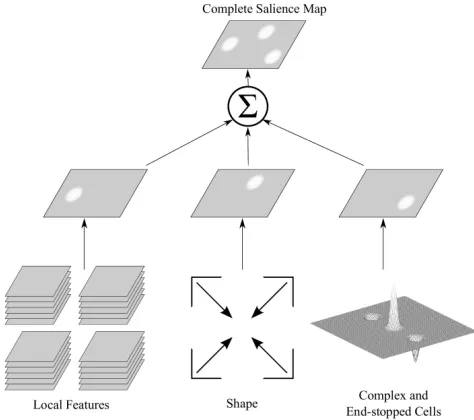
Fig. 2.Schematic diagram showing the complete process leading to the salience map.
line terminations and corner-like structures, cells with large wavelengths react strongly to blob-like structures in the image, and thus yield a further useful salience cue. By examining the relative strength of the responses of associated simple and complex cells, we extract the last two features, which are the domi-nant orientation of the region and elongation of the local object. These features are then thresholded to correspond to interpretable concepts such as “compact”, “elongated”, “horizontal” and “vertical”.
3.8 Top-down Attention and Feature Representation
Basic salience calculation was shown in Eq.10. Top-down context can be added by boosting the weightwf for features we are interested in (e.g. “red” and “fast-moving”) and reducing it for the features we are not interested in, thus adding top-down guidance to attention.
4
Preliminary Results
We applied our method in two robotic scenarios: the Bochum dataset (BOIL), which shows single objects from the overhead perspective, and the more complex tabletop dataset collected at the Algarve lab, which shows multiple objects from a perspective approximating the viewpoing of a human or a humanoid robot. Since there is no annotated ground truth information, we report the results by showing the salience and extracted low-level features on a number of images from both datasets.
4.1 Algarve Tabletop Scenario
We tested the performance of our method in bottom-up scenario on a tabletop scenario based on images collected in the Algarve vision lab. Each image shows multiple objects on a table. In this experiment, we used colour, texture, depth, shape and end-stopped cells for extracting local feature information. Figure 3 shows the results on several images from this dataset. In all images, the combi-nation of used features results in all objects exhibiting strong responses in the final salience map. It can be seen that the combination of different salience cues improves the final salience map.
4.2 Bochum Robotics Scenario
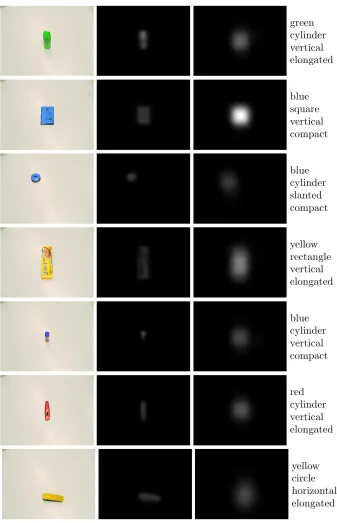
The feature representation was tested on the Bochum image database (BOIL) which consists of images of 30 objects taken by an overhead camera at different orientations. The dataset does not contain depth images or disparity maps, and the objects are not strongly textured, so we used colour, shape and end-stopped cells for orientation. The location of the maximum value in the combined salience map is taken as the most likely object location.
At this location, we read the values from the feature stacks as described in the previous section. We read the dominant colour, dominant orientation, elongation and the most likely shape and use this as a low-level description of the region. Figure 4 shows the results on several images from this dataset. As can be seen, our system provides many features of the object, providing context to higher-level processes. We are planning to use this low-level information to aid the sequential object recognition process which currently does not employ of any type of context.
5
Implementation
Our software is implemented using the OpenCV library and the keypoint imple-mentation from [25]. It takes an RGB image as an input, and it outputs a final salience map and the feature stacks described in Section 2. The salience map and feature stacks are provided as OpenCV matrices, which can be passed on to the CEDAR neural field simulator, for integrating into a robotics architecture.
Our software leverages multiple cores of modern CPUs and uses subsampling. With the exception of disparity processing, it can process input images at a resolution of 640×480 pixels at about 10 frames per second on our Intel i5 processor, which is fast enough for a real-time scenario. A GPU implementation could speed the process up even further.
6
Summary
We presented a novel algorithm for local gist estimation. It builds on our pvious work on low-level shape, colour, disparity and texture modelling, and re-formulates all these processes in a consistent way so they can be combined into a single algorithm.
Our algorithm accomplishes two tasks. First, it creates a salience map based on several low-level features: colour, texture, disparity, motion, complex cells and shape. All of these processes are based on biological models, including colour op-ponency, cortical keypoints and disparity-tuned binocular cells. The salience map is very fast to compute and our experiments show that it is useful for detect-ing objects in indoor robotic scenarios. Second, it provides a rich description of the image by representing local image content in terms of interpretable feature stacks. Once attention has been focused on a particular region of the image, the local features can be trivially extracted at no extra cost. This software therefore serves both as an early attention cue and as local context for more complex tasks, including object recognition, pose estimation, top-down attention and grasping.
Acknowledgements This work was supported by the EU under the FP-7 grant ICT-2009.2.1-270247 NeuralDynamics.
References
1. Achanta, R., Estrada, F.J., Wils, P., S¨usstrunk, S.: Salient region detection and segmentation. In: ICVS. pp. 66–75 (2008)
2. Cheng, M.M., Mitra, N.J., Huang, X., Torr, P.H.S., Hu, S.M.: Global contrast based salient region detection. IEEE T-PAMI 37(3), 569–582 (Mar 2015)
3. Cheng, M., Zhang, G., Mitra, N.J., Huang, X., Hu, S.: Global contrast based salient region detection. In: CVPR. pp. 409–416 (2011)
4. Duan, L., Wu, C., Miao, J., Qing, L., Fu, Y.: Visual saliency detection by spatially weighted dissimilarity. In: CVPR. pp. 473–480 (2011)
6. Gao, D., Vasconcelos, N.: Bottom-up saliency is a discriminant process. In: ICCV. pp. 1–6 (2007)
7. Goferman, S., Zelnik-Manor, L., Tal, A.: Context-aware saliency detection. In: CVPR. pp. 2376–2383 (2010)
8. Han, J., Ngan, K.N., Li, M., Zhang, H.: Unsupervised extraction of visual attention objects in color images. IEEE Trans. Circuits Syst. Video Techn. 16(1), 141–145 (2006)
9. Harel, J., Koch, C., Perona, P.: Graph-based visual saliency. In: NIPS. pp. 545–552 (2006)
10. Hotz, L., Neumann, B., Terzi´c, K., ˇSochman, J.: Feedback between low-level and high-level image processing. Tech. Rep. Report FBI-HH-B-278/07, Universit¨at Hamburg, Hamburg (2007)
11. Hu, Y., Xie, X., Ma, W., Chia, L., Rajan, D.: Salient region detection using weighted feature maps based on the human visual attention model. In: PCM. pp. 993–1000 (2004)
12. Itti, L., Koch, C.: A saliency-based search mechanism for overt and covert shifts of visual attention. Vision Research 40(10-12), 1489–1506 (May 2000)
13. Itti, L., Koch, C., Niebur, E.: A model of saliency-based visual attention for rapid scene analysis. IEEE Trans. Pattern Anal. Mach. Intell. 20(11), 1254–1259 (1998) 14. Jiang, H., Wang, J., Yuan, Z., Wu, Y., Zheng, N.: Salient object detection: a
discriminative regional feature integration approach. In: CVPR (2013)
15. Kreutzmann, A., Terzi´c, K., Neumann, B.: Context-aware classification for incre-mental scene interpretation. In: Workshop on Use of Context in Vision Processing. Boston (November 2009)
16. Li, Y., Hou, X., Koch, C., Rehg, J.M., Yuille, A.L.: The secrets of salient object segmentation. In: CVPR. pp. 280–287 (2014)
17. Liu, T., Sun, J., Zheng, N., Tang, X., Shum, H.: Learning to detect a salient object. In: CVPR (2007)
18. Neumann, B., Terzi´c, K.: Context-based probabilistic scene interpretation. In: IFIP AI. pp. 155–164 (Sep 2010)
19. Parkhurst, D., Law, K., Niebur, E.: Modeling the role of salience in the allocation of overt visual attention. Vision Res. 42(1), 107–123 (Jan 2002)
20. Terzi´c, K., du Buf, J.: An efficient naive bayes approach to category-level object detection. In: ICIP. pp. 1658–1662. Paris (2014)
21. Terzi´c, K., Hotz, L., ˇSochman, J.: Interpreting structures in man-made scenes: Combining low-level and high-level structure sources. In: International Conference on Agents and Artificial Intelligence. Valencia, Spain (Jan 2010)
22. Terzi´c, K., Krishna, S., du Buf, J.: A parametric spectral model for texture-based salience. In: GCPR. pp. 331–342. Aachen (Oct 2015)
23. Terzi´c, K., Lobato, D., Saleiro, M., Martins, J., Farrajota, M., Rodrigues, J., du Buf, J.: Biological models for active vision: Towards a unified architecture. In: ICVS 2013, LNCS. vol. 7963, pp. 113–122 (Jul 2013)
24. Terzi´c, K., Rodrigues, J., du Buf, J.: Fast cortical keypoints for real-time object recognition. In: ICIP. pp. 3372–3376. Melbourne (Sep 2013)
25. Terzi´c, K., Rodrigues, J., du Buf, J.: BIMP: A real-time biological model of multi-scale keypoint detection in V1. Neurocomputing 150, 227–237 (2015)