Your click decides your fate: Inferring Information Processing and
Attrition Behavior from MOOC Video Clickstream Interactions
Tanmay Sinha
1, Patrick Jermann
2, Nan Li
3, Pierre Dillenbourg
31
Language Technologies Institute, Carnegie Mellon University, Pittsburgh PA 15213, USA
2Center for Digital Education, EPFL, CH 1015, Switzerland
3
Computer-Human Interaction in Learning and Instruction, EPFL, CH 1015, Switzerland
1[email protected],
2,3<firstname.lastname>@epfl.ch
Abstract
In this work, we explore video lec-ture interaction in Massive Open Online Courses (MOOCs), which is central to stu-dent learning experience on these educa-tional platforms. As a research contribu-tion, we operationalize video lecture click-streams of students into cognitively plau-sible higher level behaviors, and construct a quantitative information processing in-dex, which can aid instructors to better un-derstand MOOC hurdles and reason about unsatisfactory learning outcomes. Our re-sults illustrate how such a metric inspired by cognitive psychology can help answer critical questions regarding students’ en-gagement, their future click interactions and participation trajectories that lead to in-video & course dropouts. Implications for research and practice are discussed.
1 Introduction
Mushrooming as a scalable lifelong learn-ing paradigm, Massive Open Online Courses (MOOCs) have enjoyed significant limelight in re-cent years, both in industry and academia (Hag-gard et al., 2013). The euphoria is about the transformative potential of MOOCs to revolution-ize online education (North et al., 2014), by con-necting and fostering interaction among millions of learners who otherwise would never have met and providing autonomy to these learners to grap-ple with the course instruction at their own pace of understanding. However, despite this expediency, there is also considerable skepticism in the learn-ing analytics research community about MOOC productiveness (Nawrot and Antoine, 2014), pri-marily because of unsatisfactory learning out-comes that plague these educational platforms and induce a funnel of participation (Clow, 2013).
With a “one size fits all” approach that MOOCs follow, scaled up class sizes and lack of face to face interaction coupled with such high student teacher ratios (Guo and Katharina, 2014), stu-dents’ motivation to follow the course oscillates (Davis et al., 2014). This is comprehensibly re-flected in escalating attrition rates in MOOCs, ever since they have started maturing (Belanger and Thornton, 2013; Schmidt and Zach, 2013; Yang et al., 2013). Because it is not feasible for MOOC in-structors to manually provide individualized atten-tion that caters to different backgrounds, diverse skill levels, learning goals and preferences of stu-dents, there is an increasing need to make directed efforts towards automatically providing better per-sonalized content in e-learning (Sinha et al., 2013; Lie et al., 2014; Sinha, 2014a). The provision of guidance with regard to the organization of the study and regulation of learning is a domain that also needs to be addressed.
reg-istrations in MOOC courses at EPFL in 2013, our experience reflects that out of the 100% students who register, 75% show up: 50% of them primar-ily watch video lectures and the rest 25% addition-ally work out homeworks and assignments. Thus, majority of students have video lecture viewing as their primary MOOC activity.
Video lectures form a primary and an extremely crucial part of MOOC instruction design. They serve as gateways to draw students into the course. Concept discussions, demos and tutorials that are held within these short video lectures, not only guide learners to complete course assignments, but also encourage them to discuss the taught syllabus on MOOC discussion forums. Specific to the context of video lectures, prior work has cut teeth on a)how video production style (slides, code, classroom, khan academy style etc) relates to students’ engagement (Guo et al., 2014), b)what features of the video lecture and instruction de-livery, such as slide transitions (change in visual content), instructor changing topic (topic model-ing and ngram analysis) or variations in instruc-tor’s acoustic stream (volume, pitch, speaking rate), lead to peaks in viewership activity (Kim et al., 2014b). There has been increasing focus on unveiling numerous facets of complexity of raw click-level interactions resulting from student activities within individual MOOC videos (Kim et al., 2014a; Sinha et al., 2014). However, to the best of our knowledge, we present the first study that describes usage of such detailed click-stream information to form cognitive video watch-ing states that summarize student clickstream. In-stead of using summative features that express stu-dent engagement, we leverage recurring click be-haviors of students interacting with MOOC video lectures, to construct their video watching profile.
Based on these richly logged interactions of stu-dents, we develop computational methods that an-swer critical questions such as a)how long will stu-dents grapple with the course material and what will their engagement trajectory look like, b)what future click interactions will characterize their be-havior, c)whether students are ultimately going to survive through the end of the video and course. As an effort to improve the second generation of MOOC offerings, we perform a hierarchical three level clickstream analysis, rooted in foundations of cognitive psychology. Incidentally, we explore at a micro level whether, and how, cognitive mind
states govern the formation and occurrence of mi-cro level click patterns. Towards this end, we also develop a quantitative information processing in-dex and monitor its variations among different stu-dent partitions that we define for the MOOC. Such an operationalization can help course instructors to reason how students’ navigational style reflects cognitive resource allocation for meaning process-ing and retention of concepts taught in the MOOC. Our metric aids MOOC designers in identifying which part of the videos might require editing. The goal is to develop an explanatory techno-cognitive model which shows that a set of metrics derived from low-level behaviors are meaningful, and can in turn be used to make effective predic-tions on high-level behaviors intuitively.
In the remainder of this paper, we describe our study context in the next section. In section 3, we motivate our three level hierarchical MOOC video clickstream analysis (operations, actions, in-formation processing activities), describing rele-vant related work along the way, along with the technical approach followed. In section 4, we val-idate our developed methodology by setting up certain machine learning experiments, specifically engagement prediction, next click state prediction, in-video and complete course dropout prediction. Implications for future work and conclusion is pre-sented in section 5.
2 Study Context
the Coursera platform unfortunately does not log whether or not a student has left the video in the middle, leaving the true video engagement time unknown. To avoid biased data, we only include video sessions containing video-end pauses. This has yielded a dataset of 222021 video sessions from 21952 students for our analysis in this paper.
3 Operationalizing the Clickstream
3.1 Level 1 (Operations)From our raw clickstream data, we construct a de-tailed encoding of students’ clicks in the follow-ing 8 categories: Play (Pl), Pause (Pa), SeekFw (Sf), SeekBw (Sb), ScrollFw (SSf), ScrollBw (SSb), RatechangeFast (Rf), RatechangeSlow (Rs). When two seeks happen within a small time range (<1 sec), we group these seek events into a scroll. Additionally, to encode ‘Rf’ and ‘Rs’, we look for the playrate of the click event that occurs just before the ‘Ratechange’ click and compare it with students’ currently changed playrate, to de-termine whether he has sped up/slowed down his playing speed. The reason behind encoding click-streams to such specific categories, accommodat-ing scrollaccommodat-ing behavior and clicks representative of increase and decrease in video playing speed, is to experimentally analyze and understand the impact of such a granularity on our experiments, which are designed with an objective to capture the mot-ley of differently motivated behavioral watching style in students.
As a next step, we concatenate these click events for every student, for every video lec-ture watched. Thus, the output from level 1 is this string of symbols that characterizes the se-quence of clickstream events (video watching state sequence). For e.g: PlPaSfSfPaSbPa.., PlSSb-PaRsRsPl..
3.2 Level 2 (Behavioral Actions)
Existing literature on web usage mining says that representing clicks using higher level categories, instead of raw clicks, better exposes the brows-ing pattern of users. This might be because high level categories have better noise tolerance than naive clickstream logs. The results obtained from grouping clickstream sequences at per click res-olution are often difficult to interpret, as such a fine resolution leads to a wide variety of se-quences, many of which are semantically equiv-alent. Therefore, to get more insights into
stu-dent behavior in MOOCs, we group clicks en-coded at very fine granularity into meaningful be-havioral categories. Doing this also reduces se-quence length which is easily interpretable. There is some existing literature (Banerjee and Ghosh, 2000; Wang et al., 2013), that just considers click as a binary event (yes/no) and discusses formation of concept based categories based on the area/sub area of the stimulus where the click was made.
To summarize a students’ clickstream, we ob-tain n-grams with maximum frequency from the clickstream sequence (a contiguous sequence of ‘n’ click actions). Such a simple n-gram represen-tation convincingly captures the most frequently occurring click actions that students make in con-junction with each other (n=4 was empirically de-termined as a good limit on clickstream subse-quence overspecificity). Then, we construct seven semantically meaningful behavioral categories us-ing these discovered n-grams, selectus-ing represen-tative click groups that occur within top ‘k’ most frequent n-grams (k=100). Each behavioral cate-gory acts like a latent variable, which is difficult to measure from data directly.
• Rewatch: PlPaSbPl, PlSbPaPl, PaSbPlSb,
SbSbPaPl, SbPaPlPa, PaPlSbPa
• Skipping:SfSfSfSf, PaPlSfSf, PlSfSfSf,
SfS-fSfPa, SfSfPaPl, SfSfSfSSf, SfSfSSfSf, Sf-PaPlPa, PlPaPlSf
• Fast Watching: PaPlRfRf, RfPaPlPa,
RfRf-PaPl, RsPaPlRf, PlPaPlRf (click group of Ratechange fast clicks while playing or paus-ing video lecture content, indicatpaus-ing speedpaus-ing up)
• Slow Watching: RsRsPaPl, RsPaPlPa,
PaPlRsRs, PlPaPlRs, PaPlRsPa, PlRsPaPl (click group of Ratechange slow clicks while playing or pausing video lecture content, in-dicating slowing down)
• Clear Concept: PaSbPlSSb, SSbSbPaPl,
PaPlSSbSb, PlSSbSbPa (a combination of SeekBw and ScrollBw clicks, indicating high tussle with the video lecture content)
• Checkback Reference: SbSbSbSb,
PlSbS-bSb, SbSbSbPa, SbSbSbSf, SfSbSPlSbS-bSb, Sb-PlSbSb, SSbSbSbSb (a wave of SeekBw clicks)
• Playrate Transition: RfRfRsRs, RfRfRfRs,
Case (Full, No, Partial
match) Clickstream A Clickstream B Fuzzy string matchingverdict 1:Varying clickstream
length PlPaPlSfPaSfSbSbPl PlPa(learner has performed lot more clicks)PlSfPaSfSbSbPlPaSbSbSbRfRsRf Weight(P,A)>Weight(P,B) 2:Behavioral pattern
ap-pears more than once PlPaPlSfPaSfSbSbPl PlPa(pattern is more characteristic as it ap-PlSfPaSfSbSbPlPlSfPaSf pears 2 times)
Weight(P,A)<Weight(P,B)
3:No appearance of
be-havioral pattern RfSbSbRs SSfSSfRsRsRsSfSfSfSfRfRfRfRfRf(string length doesn’t matter) Weight(P,A)(very low weight)6=(P,B) 4:Variation in number of
individual clicks RfSbSbRsPlSbPaSb RfSbSbRs(more clicks from pattern appear)PlSbSfPaSfSb Weight(P,A)<Weight(P,B) 5:Variation in scattering
of individual clicks (less scattering)RfSbRsPlSbSfPaSfSb (more scattering)RfSbRsPlSbSSbSfPlSbRsPaSbRfSf Weight(P,A)>Weight(P,B) 6:Reverse order of
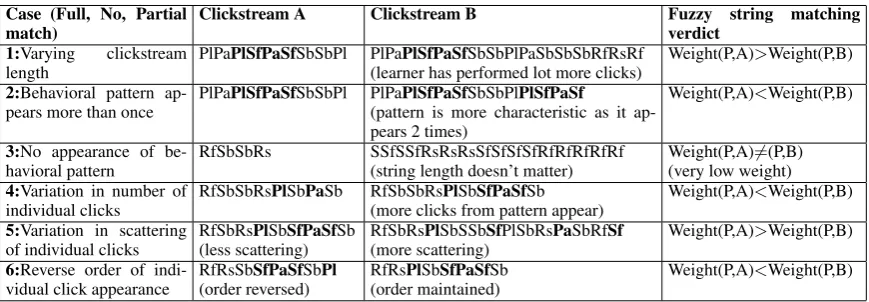
[image:4.595.79.514.54.205.2]indi-vidual click appearance RfRsSb(order reversed)SfPaSfSbPl RfRs(order maintained)PlSbSfPaSfSb Weight(P,A)<Weight(P,B) Table 1: Fuzzy string similarity weights for the sample behavioral action P(“PlSfPaSf”). Weight(P, A/B) represents the similarity of the pattern P w.r.t clickstream sequence A or B.
In an attempt to quantify the importance of each of the above behavioral actions in characterizing the clickstream, we adopt a fuzzy string match-ing approach. Usmatch-ing this approach, we assign a weight to each of the grouped behavioral pat-terns for a given students’ video watching state se-quence (based on similarity of click groups present in each behavioral category, with the full click-stream sequence). The fuzzy string method (Van, 2014) is justified because it caters to the noise that might be present in raw clickstream logs of stu-dents, in six different ways, as mentioned in Ta-ble 1. After identifying these cases and meticu-lous experimental evaluation, we apply the follow-ing distance metrics and tunfollow-ing parameters: Co-sine similarity metric between the vector of counts of n-gram (n=4) occurrences for Cases 1 and 2, Levenshtein similarity metric for Cases 3 (weight for deletion=0, weight for insertion and substitu-tion=1), 4, 5, 6 (weight for deletion=0.1, weight for insertion, substitution=1).
As a next step, all subcategories of click groups that lie within each behavioral category are aggre-gated by summing up the individual fuzzy string similarity weights that are obtained with respect to every students’ clickstream sequence. Then, we perform a discretization of these summed up weights, for each behavioral category, by equal frequency (High/Low). The concern of adding up two distance metrics that do not lie in the same range, is thus alleviated, because the dichotomiza-tion automatically places highly negative values in the “Low” category and positive values closer to 0 in the “High” category. The result is a click-stream vector for each video viewing session of the student, where every element of the vector
tells us about the weight (importance) of a behav-ioral category for characterizing the clickstream. Thus, the output from level 2 is such a summarized clickstream vector. For e.g: (Skipping=High, Fast Watching=High, Checkback Reference=Low, Re-watch=Low, ....).
3.3 Level 3 (Information Processing)
Watching MOOC videos is an interaction between the student and the medium, and therefore the con-ceptualization of higher-order thinking eventually leading to knowledge acquisition (Chi, 2000), is under control of both the a)student (who decides what video segment to watch, when and in what order to watch, how hard an effort be made to try and understand a specific video segment) and, b)medium/video lecture (the content or features of which decides what capacity allocation is re-quired by the student to fully process the informa-tion contained).
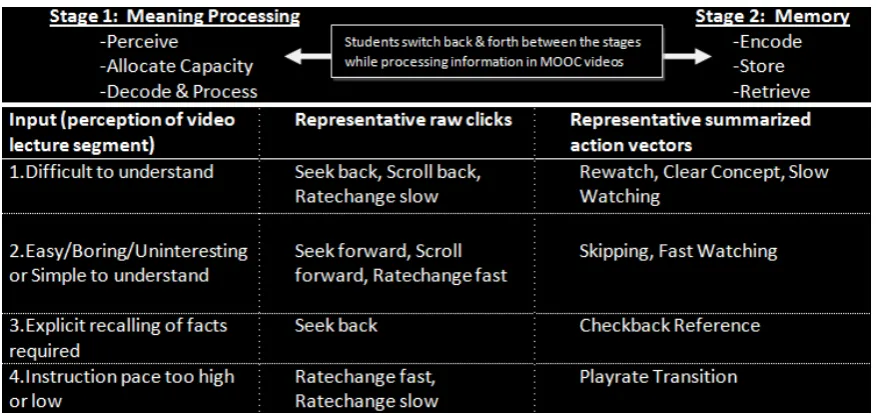
motiva-Figure 1: Relating students’ information processing to click behaviors exhibited in the MOOC, based on video lecture perception
tional system are skipping/fast watching. In this work, we try to construct students’ information processing index, based on the “Limited Capacity Information Processing Approach” (Basil, 1994; Lang et al., 1996; Lang, 2000), which asserts that people independently allocate limited amount of cognitive resources to tasks from a shared pool. Figure 1 depicts this idea.
We must acknowledge the fact that video watch-ing in MOOCs requires students to recall facts that they already know (specific chunks of declarative knowledge (Anderson, 2014). This helps them to build a mental representation of the information presented in a MOOC video lecture segment, fol-low and understand the concept being currently taught. However, it must be noted that depending on the a)expertise level, which decides how avail-able the past knowledge is and how hard is it to retrieve the previously known facts, b)perception of video lecture as difficult or simple to under-stand, c)motivation to learn or just have a look at the video lecture to seek specific outcomes, cog-nitive resource allocation would vary among these time sensitive subprocesses in stage 1 and 2 of the pipeline (depicted in Figure 1). This in turn, would be reflected by the underlying non linear navi-gational patterns that students have, specifically the nature of clicks which they make to adjust the speed of information processing (by pausing, seeking forward/backward, ratechange clicks), as responses to the stimuli.
Consider an example of students who watch the
MOOC lecture, primarily because of reasons such as gaining familiarity with the topic. Such stu-dents would purposely not allocate their process-ing resources to “memory” part of the information processing pipeline (encode, store, retrieve). Ad-ditionally, they will decode and process minimal information that is required to follow the story. On the contrary, students who watch the MOOC lecture, with the aim of scoring well in post-tests (MOOC quizzes and assignments), would allocate high cognitive processing to understand, learn and retain information from the lecture. Thus, such students would process information more fully and thoroughly, despite a possibility of cognitive overload.
[image:5.595.78.517.53.260.2]infor-mation processing index is defined as follows:
Information Processing Index (IPI)=
(−1)j P7
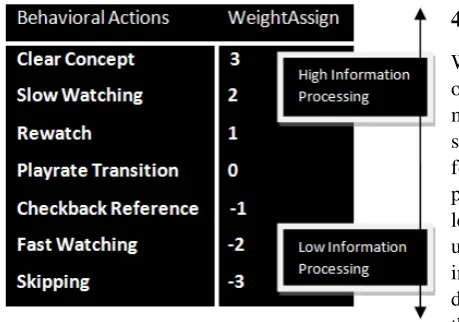
[image:6.595.81.311.144.305.2]i=1WeightAssign(Behavioral Action i), j=1,2 depending on whether the behavioral action is weighted low or high.
Figure 2: Linear weight assignments for behav-ioral clickstream actions, according to the infor-mation processing hierarchy developed
One of the focal utilities of developing such a quantitative index is that meaningful interven-tion could be provided in real time to students, as they steadily build up their video watching pro-file while interacting with MOOC video lectures. Viewing throught the lens of the Goldilocks prin-ciple (Kidd et al., 2012), our metric can poten-tially help instructors in understanding and differ-entiating between students looking away from the MOOC visual sequence, because of too simple or too complex representation. Adaptive presenta-tion of instrucpresenta-tional materials is another learning science application where leveraging our metric would be beneficial.
Specifically, when IPI > 0, it can be inferred that high information processing is being done by students. Therefore MOOC instructors need to check for coherency in pace of instruction de-livery and students’ understanding. This might also hint towards redesigning specific video lec-ture segments and simplifying them so that they become easier to follow. On the contrary, when IPI<0, low information processing is being done by students. Therefore MOOC instructors need to help students better engage with the course, by providing them additional interesting read-ing/assignment material, or fixing video lecture content such that it captures students’ attention.
The neutral case of IPI = 0 occurs when students’ locally exhibited high and low information pro-cessing needs in their evolving clickstream se-quence counterbalance each other. So, interven-tions need to made depending on the video lecture segment, where IPI was>0 or<0.
4 Validation Experiments
We use machine learning to validate the method-ology developed in section 3.1 and 3.2 for sum-marizing students’ clickstream, ensuring that the same student does not appear in the train and test folds. The motivation behind setting up these ex-periments is to automatically measure students’ length of interaction with MOOC video lectures, understand how they develop their video watch-ing profile and discern what viewwatch-ing profile of stu-dents leads to in-video and course dropouts. Fur-thermore, we validate the methodology developed in section 3.3 by statistically analyzing variations of IPI and testing its sensitivity to student attrition using survival models.
4.1 Machine Learning Experiment Design 4.1.1 How much do you engage?
Students, while watching MOOC video lectures can pause, seek, scroll and change rate of the video. Thus, it is meaningful to quantify students’ engagement as the summation of video playing time, seeks & pauses, multiplied by the playback rate. For example, if a student plays 700 secs out of a 1000 sec video, pauses 2 times for 100 secs each, at an average play rate of 1.5, he effectively engages with the video for (700+200)∗1.5=1350 secs. Such an interaction measure multiplied by playback rate, is representative of effective video lecture content covered.
Research Question 1: Can students’
click-stream sequence predict length of students’ inter-action with the video lecture?
Settings: The data for this experiment comes
rare feature extraction threshold being 2). As fea-tures, we extract N-grams of length 4 and 5, se-quence length and regular expressions from stu-dents’ clickstream sequences. In the changed setup, we consider summarized behavioral action vectors (output from level 2) as column features.
4.1.2 Are you bored or challenged?
Next, we focus our attention on how clickstream sequences evolve. If we know that students’ in-teraction with the video lecture is going to be for a long time (reflected by high engagement), it could have been the case that they were strug-gling at the current level of instruction (for exam-ple, a high combination of pause/seek backward events). Therefore, if such a phenomenon can be detected in real time video lecture interaction, such learners can be presented with reinforcement course material before moving forward. Alterna-tively, if we know that students’ interaction with the video lecture is going to be for a short time (re-flected by low engagement), they could be bored or are quite likely to skip course content forward often. Such students can be presented with ad-vanced study material. However, in order to de-velop such a real time knowledge model and tailor targeted interventions at students, we need to study the trajectory of click sequence formation.
Research Question 2: Can we precisely predict
what will be the next sequence of clicks that leads students to different engagement states?
Settings: The data for this experiment comes
from the same video lecture 4-6 (6th lecture in the 4th week of the course). The dependent variable is next click state of students (Pa, Pl, Sf, SSf, Sb, SSb, Rf, Rs). L2 regularized Lo-gistic Regression is used as the training algo-rithm (with 5 fold cross validation annotated by student-id and rare feature extraction threshold being 5). If we want to predict the click at the ith instant, we extract the following features from 0 till (i-1)th instant: a)Engagement with the video lecture as defined for Research Question 1(High/Low); b)Proportion of click events belong-ing to Pl/Pa/Sf/SSf/Sb/SSb/Rf/Rs (representative of kind of interaction with the stimulus); c)N-grams of length 4,5 and sequence length from students’ clickstream sequences. In the changed setup, we consider summarized behavioral action vectors (output from level 2) as column features.
4.1.3 Will you drop out of the video?
As students progress through the video, they slowly build up their video watching profile by interacting with the stimulus in different propor-tions, which in turn depend on their click action sequences. This motivates our next machine learn-ing experiment, which seeks to derive utility from the first two experiments. Navigating away from the video without completing it fully is an out-come of low student engagement. A student is more likely to watch till the end of a video, if the lecture activates his thinking. Thus, it would be in-teresting to investigate, whether the nature of stu-dents’ interaction provides us a hint about in-video dropout behavior. Prior work has made a prelim-inary study on how in-video dropout is correlated with length of the video, and how in-video dropout varies among first time watchers and rewatchers (Kim et al., 2014a). However, we consider video interaction features at a much finer granularity, representative of how students progress through the video. In doing so, we use detailed clickstream information, including seek, scroll and ratechange behavior, in addition to merely play and pause in-formation.
Research Question 3: What video watching
profile of students leads to in-video dropouts?
Settings: The data for this experiment comes
4.1.4 Will you watch videos and stay till the course end?
We may expect that when students find the course too tough to follow, uninteresting or boring, they will not engage with future videos. On the con-trary, when students seem very interested in un-derstanding the video and exhibit lots of rewatch-ing behavior, we might expect them to stay on till the course end video lectures. Students who do not stay till the last week of the course (exhibit any video lecture viewing), are considered as complete course dropouts. One principal application of de-tecting these dropouts early could be recommen-dation of selected future video lectures to watch (for example, where an interesting concept, case study or application is going to be discussed), to positively motivate and pull these students back into the MOOC.
Research Question 4: Can we discover
pat-terns in the video watching trajectory of students that can predict when are students most likely not to view future video lectures?
Settings: The data for this experiment comes
from all 48 videos of “Functional Program-ming in Scala” MOOC (4710 non-dropouts, 9596 dropouts). To address the skewed class distribu-tion, cost sensitive L2 regularized Logistic Re-gression is used as the training algorithm (with 5 fold cross validation annotated by student-id and rare feature extraction threshold being 5). The dependent variable is the binary variable, com-plete course dropout (0/1), indicating whether the student ultimately stayed on (watched any video lecture) till the last course week. Engagement (time in seconds) of a student is discretized by equal frequency into High and Low categories, considering all interactions in each video lecture separately (because length of each video differs, so the discretization criteria would also differ for each video). Video play proportion((video played length/video length)*100*average play rate) for a student is discretized by equal width (Very Low:
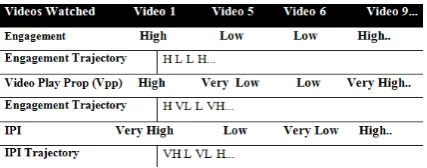
<50%, Low: 50-100%, High: 100-150%, Very High: >150%). IPI for a student is discretized by equal frequency (Very Low: <-1.00, Low: [-1.00, 1.00], High: [1.00, 3.00], Very High: >3.00). The discretization criteria (equal width, frequency and number of bins) was experimentally deter-mined. Development of trajectories for each of these factors is indicated in Figure 3. To extract the interaction footprint of students before they
[image:8.595.307.521.218.302.2]drop out of the course, we extract the following features: a)N-grams of length 4,5 and sequence length from “Engagement trajectory”, “Video Play Proportion trajectory” and “IPI trajectory” of stu-dents for the videos watched from 0 to (n-1)th in-stant, b)Engagement, Video Play Proportion and IPI trajectories for the nth instance (attribute for the last video lecture watched before dropping out), c)Proportion of different symbol representa-tions in the trajectories (for example, in a trajec-tory such as HLLHH, proportion(H)=60%, pro-portion(L)=40%.
Figure 3: Example depicting how different opera-tionalized trajectories of students are formed
4.2 Results
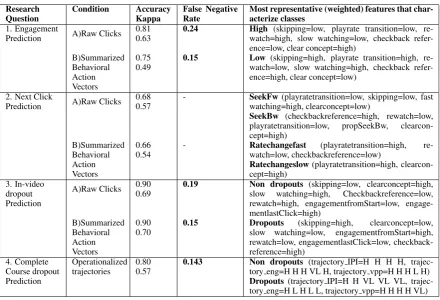
Results of the four machine learning experiments, along with the most representative (weighted) fea-tures that characterize classes, are reported in table 2. There are two important positives here: a)The summarized behavioral action vectors from level 2 are able to achieve nearly similar values of ac-curacy and kappa when compared to the raw level clicks. This means that we can reason different meaningful video viewing behaviors of students without getting our hands dirty in examining noisy and continually occurring raw clicks, b)Our met-ric of interest, i.e the false negative rate1is lower for Case 1.B and Case 3.B, as compared to Case 1.A and Case 3.A, which shows the effectiveness of the clickstream summarization approach (level 2) in pre-deciphering the fate of students to some extent.
Research
Question Condition AccuracyKappa False NegativeRate Most representative (weighted) features that char-acterize classes 1. Engagement
Prediction A)Raw Clicks 0.810.63 0.24 Highwatch=high, slow watching=low, checkback refer-(skipping=low, playrate transition=low, re-ence=low, clear concept=high)
B)Summarized Behavioral Action Vectors
0.75
0.49 0.15 Lowwatch=low, slow watching=high, checkback refer-(skipping=high, playrate transition=high, re-ence=high, clear concept=low)
2. Next Click
Prediction A)Raw Clicks 0.680.57 - SeekFwwatching=high, clearconcept=low)(playratetransition=low, skipping=low, fast SeekBw (checkbackreference=high, rewatch=low, playratetransition=low, propSeekBw, clearcon-cept=high)
B)Summarized Behavioral Action Vectors
0.66
0.54 - Ratechangefastwatch=low, checkbackreference=low)(playratetransition=high, re-Ratechangeslow(playratetransition=high, clearcon-cept=high)
3. In-video dropout Prediction
A)Raw Clicks 0.900.69 0.19 Non dropoutsslow watching=high,(skipping=low, clearconcept=high,Checkbackreference=low, rewatch=high, engagementfromStart=low, engage-mentlastClick=high)
B)Summarized Behavioral Action Vectors
0.90
0.70 0.15 Dropoutsslow watching=low, engagementfromStart=high,(skipping=high, clearconcept=low, rewatch=low, engagementlastClick=low, checkback-reference=high)
4. Complete Course dropout Prediction
Operationalized
[image:9.595.79.520.52.352.2]trajectories 0.800.57 0.143 Non dropoutstory eng=H H H VL H, trajectory vpp=H H H L H)(trajectory IPI=H H H H, trajec-Dropouts (trajectory IPI=H H VL VL VL, trajec-tory eng=H L H L L, trajectrajec-tory vpp=H H H H VL) Table 2: Performance metrics for machine learning experiments. Random baseline performance is 0.5
dropout in the MOOC is 37% less likely, if they have one standard deviation greater IPI than aver-age (Hazard ratio: 0.6367, p<0.001). Such stu-dents grapple more with the course material to achieve their desired learning outcomes (as re-flected by their video lecture participation), b)If students’ rewatching behavior changes from low to high, they are 33% less likely to dropout (Haz-ard ratio: 0.6734, p<0.001), c)As students start watching more proportion of the video lecture, they are 37% less likely to dropout of the MOOC (Hazard ratio: 0.6334, p<0.001). This is indica-tive of their continued interest in the video lecture. Next, to discern how IPI fluctuates among dif-ferent student partitions and validate whether our operationalization produces meaningful results, we plot figures 4, 5 and perform statistical tests, specifically z test (testing significance of differ-ence between means for large sample sizes, when population standard deviation is known). Pop-ulation refers to all students in the MOOC be-ing currently studied. The right half of figure 4 depicts the variation of average IPI, among high versus low engagers and in-video dropouts ver-sus non dropouts, in the same video lecture 4-6 from the course, that we have been
Figure 4: Variation of Average Information Processing Indices(IPI) for Video 4-6
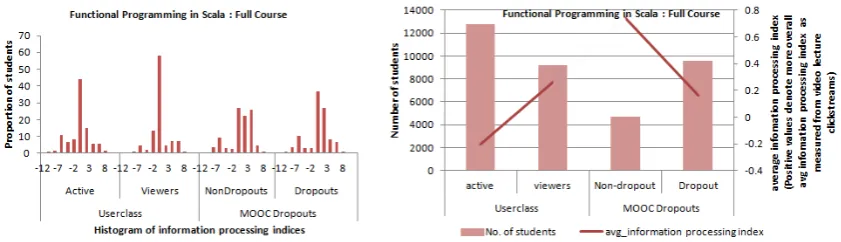
Figure 5: Variation of Average Information Processing Indices(IPI) for the full course
the last week, i.e, students who do not finish the course. An important observation in figure 5 is that IPI is clearly able to distinguish between Non-dropouts and Dropouts (|z|=9.06, p<0.01). This is also reflected in the histogram in the left half of figure 5, which verifies that more “Non dropouts” have positive IPI. More is the information pro-cessing done by students, greater is the video lec-ture involvement, higher are the chances to derive true utility from video lecture and remain excited and motivated to stay in the course. We also ob-tain striking differences between “Active” versus “Viewers” (|z|=10.45, p<0.01). Intuitively too, we expect “Viewers” to have higher IPI than “Ac-tive” class, because as their primary MOOC activ-ity, “Viewers” grapple more with the video lecture.
5 Conclusion
In this work, we have begun to lay a foundation for research investigating students’ information pro-cessing behavior while interacting with MOOC video lectures. Focusing the center of gravity on the human mind, we applied a cognitive video watching model to explain the dynamic process of cognition involved in MOOC video clickstream interaction. This paved way for the development
[image:10.595.86.507.225.346.2]References
Anderson, A., Huttenlocher, D., Kleinberg, J., & Leskovec, J. (2014, April). “Engaging with massive online courses”.In Proceedings of the 23rd interna-tional conference on World wide web(pp. 687-698). International World Wide Web Conferences Steering Committee.
Anderson, J. R. (2014). “Rules of the mind”. Psychol-ogy Press.
Banerjee, A., & Ghosh, J. (2000). “Concept-based clustering of clickstream data”.
Basil, M. D. (1994). “Multiple resource theory I ap-plication to television viewing”.Communication Re-search, 21(2), 177-207
Belanger, Y., & Thornton, J. (2013). “Bioelectricity: A Quantitative Approach Duke Universitys First MOOC”.
Brinton, C. G., Chiang, M., Jain, S., Lam, H., Liu, Z., & Wong, F. M. F. (2013). “Learning about so-cial learning in moocs: From statistical analysis to generative model”.arXiv preprint arXiv:1312.2159. Cacioppo, J. T., and Wendi L. G. (1999). “Emotion”.
Annual Reviews: Psychology, 50, 191-214.
Carini, R. M., Kuh, G. D., & Klein, S. P. (2006). “Stu-dent engagement and stu“Stu-dent learning: Testing the linkages”.Research in Higher Education, 47(1), 1-32.
Chi, M. T. (2000). “Self-explaining expository texts: The dual processes of generating inferences and re-pairing mental models”.Advances in instructional psychology, 5, 161-238.
Clow, D. (2013). “MOOCs and the funnel of participa-tion”In Proceedings of the Third International Con-ference on Learning Analytics and Knowledge, pp. 185-189. ACM
Coetzee, D., Fox, A., Hearst, M. A., & Hartmann, B. (2014, February). “Should your MOOC forum
use a reputation system?”. In Proceedings of the
17th ACM conference on Computer supported coop-erative work & social computing(pp. 1176-1187). ACM.
Davis, H. C., Dickens, K., Leon Urrutia, M., Vera, S., del Mar, M., & White, S. (2014). “MOOCs for Uni-versities and Learners An analysis of motivating fac-tors”.
Fischer, G. (2011). “Understanding, fostering, and sup-porting cultures of participation”. Interactions 18, no. 3: 42-53.
Guo, P. J., & Reinecke, K. (2014, March). “Demo-graphic differences in how students navigate through
MOOCs”.In Proceedings of the first ACM
confer-ence on Learning@ scale conferconfer-ence (pp. 21-30). ACM.
Guo, Philip J., Juho Kim, and Rob Rubin. (2014). “How video production affects student engagement:
An empirical study of mooc videos”ACM Learing
at Scale(L@S), pp. 41-50.
Haggard, S., S. Brown, R. Mills, A. Tait, S. Warburton, W. Lawton, and T. Angulo. (2013). “The maturing of the MOOC: Literature review of Massive Open Online Courses and other forms of online distance learning”BIS Research Paper 130
Huang, J., Dasgupta, A., Ghosh, A., Manning, J., & Sanders, M. (2014, March). “Superposter
behav-ior in MOOC forums”. In Proceedings of the first
ACM conference on Learning@ scale conference
(pp. 117-126). ACM.
Kidd, C., Piantadosi, S. T., & Aslin, R. N. (2012). “The Goldilocks effect: Human infants allocate attention to visual sequences that are neither too simple nor too complex”.PLoS One, 7(5), e36399.
Kim, J., Guo, P. J., Seaton, D. T., Mitros, P., Gajos, K. Z., & Miller, R. C. (2014a, March). “Understand-ing in-video dropouts and interaction peaks inonline lecture videos”.In Proceedings of the first ACM con-ference on Learning@ scale concon-ference(pp. 31-40). ACM.
Kim, J., Shang-Wen L., Carrie J. C., Krzysztof Z. G., Robert C. M. (2014b). “Leveraging Video Interac-tion Data and Content Analysis to Improve Video
Learning” CHI 2014 Workshop on Learning
Inno-vation at Scale
Kulkarni, C. E., Socher, R., Bernstein, M. S., & Klem-mer, S. R. (2014, March). “Scaling short-answer grading by combining peer assessment with algo-rithmic scoring”. In Proceedings of the first ACM conference on Learning@ scale conference(pp. 99-108). ACM.
Lang, A., John N., and Byron R. (1996). “Negative video as structure: Emotion, attention, capacity, and memory”.Journal of Broadcasting & Electronic Media, 40(4), 460-477
Lang, A. (2000). “The limited capacity model of me-diated message processing”.Journal of communica-tion, 50(1), 46-70.
Lie M. T., Debjanee B., Judy K. (2014). “Online learn-ing at scale: user modellearn-ing requirements towards motivation and personalisation”.In Learning Inno-vations at Scale CHI’ 14 Workshop
Miller Jr, Rupert G. (2011). “Survival analysis”. Vol. 66.John Wiley & Sons
North, S. M., Ronny R., and Max M. N. (2014). “To Adapt MOOCS, or Not? That is No Longer the
Question.” Universal Journal of Educational
Re-search2(1): 69-72
Ramesh, A., Goldwasser, D., Huang, B., Daum H. III, and Getoor, L. (2013). “Modeling Learner Engage-ment in MOOCs using Probabilistic Soft Logic”.In NIPS Workshop on Data Driven Education
Schmidt, D. C., and Zach M. (2013). “Producing and Delivering a Coursera MOOC on Pattern-Oriented Software Architecture for Concurrent and Net-worked Software”
Sinha, T., Banka, A., Kang, D. K., (2013). “Leveraging user profile attributes for improving pedagogical ac-curacy of learning pathways”.In Proceedings of 3rd Annual International Conference on Education and E-Learning(EeL 2013), Singapore
Sinha, T. (2014a). “Together we stand, Together we fall, Together we win: Dynamic team formation in massive open online courses”In Fifth International Conference on the Applications of Digital Informa-tion and Web Technologies (ICADIWT)pp. 107-112. IEEE
Sinha, T. (2014b). “Supporting MOOC Instruction
with Social Network Analysis”. arXiv preprint
arXiv:1401.5175
Sinha, T. (2014c). “Your click decides your fate”: Leveraging clickstream patterns from MOOC videos to infer students’ information processing & attrition behavior.arXiv preprint arXiv:1407.7143.
Sinha, T., Li, N., Jermann, P., Dillenbourg, P. (2014). Capturing attrition intensifying structural traits from didactic interaction sequences of MOOC learners.
Proceedings of the 2014 Empirical Methods in Nat-ural Language Processing Workshop on Modeling Large Scale Social Interaction in Massively Open Online Courses, Qatar, October 2014
Tillmann, N., De Halleux, J., Xie, T., Gulwani, S., and Bishop, J. (2013). “Teaching and learning program-ming and software engineering via interactive gam-ing”.In ICSE, 11171126
Van der L., Mark PJ. (2014). “The stringdist Package
for Approximate String Matching”The R Journal
Wang, G., Tristan K., Christo W., Xiao W., Haitao Z., and Ben Y. Z. (2013). “You are how you click: Clickstream analysis for sybil detection”In USENIX Security Symposium(Washington, DC)
Yang, D., Sinha T., Adamson D., and Rose C. P. (2013). “Turn on, Tune in, Drop out: Anticipating student
dropouts in Massive Open Online Courses”In NIPS