ISSN Print: 2161-7570
DOI: 10.4236/ojg.2017.78082 Aug. 25, 2017 1227 Open Journal of Geology
A Case Study of Evaluation and Distribution
of Tourism Climate by Using TCI:
Baluchestan Region of Iran
Chakavak Khajeh Amiri Khaledi
Department of Oceanography, Faculty of Marine Science, Chabahar Maritime University, Chabahar, Iran
Abstract
This study was conducted to evaluate the tourist’s comfort conditions of Ba-luchestan region by using Tourism Climate Index (TCI). Climate parameters data were collected from 5 synoptic stations (Khash, Saravan, Nikshahr, Iran-shahr and Chabahar) located in Baluchestan region of Iran between January 1995 and December 2015. Monthly TCI for each station was calculated and geographical distribution maps were prepared by using GIS software. In win-ter, Baluchestan had very good to ideal TCI. January and February are the best months for travelling to Chabahar based on TCI. Marginal to ideal TCI was observed in spring, except for Chabahar which had excellent TCI due to monsoon wind. In summer, elevation plays an important role for determina-tion of TCI and acceptable TCI was achieved. By decreasing temperature in autumn, better tourism conditions and ideal TCI were observed. Nikshahr and Iranshahr had ideal TCI in March, however, ideal TCI was observed in April, October and November for Khash and Saravan. It can be concluded that winter seems to be the best season for travelling to Baluchestan region as TCI ranged from very good to ideal except for Khash. Elevation has the im-portant effect on tourism climate condition and higher elevated counties (Khash and Saravan) have different tourism season compared to other coun-ties (Nikshahr and Iranshahr).
Keywords
Baluchestan, TCI, Climate Comfort
1. Introduction
Economic development in each country is dependent mainly to investment in How to cite this paper: Khaledi, C.K.A.
(2017) A Case Study of Evaluation and Distribution of Tourism Climate by Using TCI: Baluchestan Region of Iran. Open Journal of Geology, 7, 1227-1237.
https://doi.org/10.4236/ojg.2017.78082
Received: March 16, 2017 Accepted: May 23, 2017 Published: August 25, 2017
Copyright © 2017 by author and Scientific Research Publishing Inc. This work is licensed under the Creative Commons Attribution International License (CC BY 4.0).
http://creativecommons.org/licenses/by/4.0/
DOI: 10.4236/ojg.2017.78082 1228 Open Journal of Geology different parts of economics, and it cannot be expected to develop occupation, production and welfare without any investments in infra- and super-structure projects. Tourism is one of the largest and fastest developing industries through the world which plays an important role in socio-economic life of the people.
At present, many countries derive their socio-economic benefits from tourism industry and use its income to develop regional infrastructure [1]. Tourism not only promotes national economics and exchange revenues but also is a clean in-dustry which can produce many career opportunities especially in developing countries.
It is estimated that international tourist arrivals will reach a total of 1.6 million in 2020 and financial turnover will increase to over US$2 trillion [2]. Iran is one of the top 10 countries in the case of historical sites, however, income from tour-ism industry accounts for about 1% of total financial turnover. Weather and climate are critical factors which can directly affect tourist arrivals and travelling destination [3]. Tourists usually select a place with a favorable and comfortable climate conditions. Even the people travel for other purposes than vacations such as studying and cultural purposes, choosing a time period that their intended destination has the most convenient weather and climate conditions. Thus, it is important to use an index for evaluating tourist’s comfortable conditions.
Among different indices used for evaluating climate environments for tour-ism, Tourism Climate Index (TCI) seems the highest applicability because of commonly available climatological data [4]. The TCI is a combination of seven climate variables which was developed by Mieczkowski [5]. The TCI integrates climate elements including the mean maximum air temperature, the mean minimum relative humidity, the mean air temperature and the mean relative humidity, amount of precipitation, daily sunshine duration and mean wind speed [6] into one index to assess the conditions for general tourism activities [4]. Thus, as climate change is expected to affect a number of variables like tem-perature, wind and precipitations, it will have consequences on the degree of at-tractiveness of touristic destinations [7].
Some researchers used TCI for evaluating climate resources for tourism sea-sonality in China [4], climate change impacts on tourism activity in North America [8], Northwestern Europe [9], and Mediterranean [7] and also distribu-tion of tourism climate comfort for Azarbayejan [10], Kerman [11] and Khora-san [12] provinces of Iran. To our knowledge previous studies on Iran’s tourism climate classification have primarily explored the characteristics in some prov-inces except Baluchestan region. Therefore, this study was conducted to evaluate tourism climate classification by using TCI for specifically Baluchestan region; a south part of Sistan and Baluchestan province.
2. Methodology
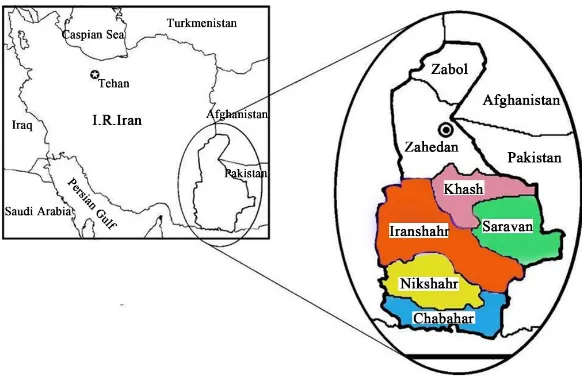
DOI: 10.4236/ojg.2017.78082 1229 Open Journal of Geology Climate Index [5]. Climate elements including the mean maximum air temper-ature, the mean minimum relative humidity, the mean air temperature and the mean relative humidity, amount of precipitation, daily sunshine duration and mean wind speed were collected from 5 synoptic stations located in Khash, Sa-ravan, Iranshahr, Nikshahr and Chabahar counties between January 1995 and December 2015. Figure 1 and Table 1 present study area and climate data of meteorological stations, respectively. Climate parameters were combined to achieve five sub-indices including Day time comfort index, Daily comfort Index, Precipitation, Sunshin and Rating of wind speed. The relative weights of sub- indices were integrated to calculate monthly TCI for each synoptic station ac-cording to the following formula [5]:
(
)
TCI 2 4CID CIA 2P 2S W= + + + +
[image:3.595.227.518.303.497.2]where CID is the Daytime Comfort Index, CIA is Daily Comfort Index, P is the Precipitation Index, S is the Sunshine Index and W is the Wind Index.
Figure 1. Study area and location of stations.
Table 1. Atmospheric parameters of counties located in Baluchestan region of Iran.
Counties
Atmospheric parameters
Multivariate classification Average air
temperature (˚C) Average humidity (%) Precipitation (mm)
Average wind speed (m/s)
Total Sunshine
(h)
Elevation (m) Summer Winter Annual Summer Winter Annual
Khash 28.7 11 20.1 19 45 30 145.2 3 3467 1394 warm temperate Semi arid and
Saravan 30.8 13.1 22.1 25 42 30 105.9 3.1 3475 1195 warm temperate Semi arid and
Iranshahr 36.1 16.9 26.8 25 42 30 110.1 2.1 3430 591 Dry and hot
Nikshahr 34 19.7 27.9 44 43 37 168.4 2.9 3494 510 hot desert Dry and
[image:3.595.57.543.542.740.2]DOI: 10.4236/ojg.2017.78082 1230 Open Journal of Geology Therefore, Mieczkowski’s classification scheme was divided into 10 categories, ranging from ideal (90 to 100) excellent (80 to 89), and very good (70 to 79) to extremely unfavorable (10 to 19) and impossible (9 to −30) [5].
Non-parametric test was conducted to check the data for homogeny, normal-ity and independency using HYFRAN-PLUS software (2008) [13] which in-cludes a number of powerful, flexible, user-friendly mathematical tools that can be used for the statistical analysis of extreme events including engineering, en-vironment, meteorology, medical sciences, etc. After calculating TCI for each station data were used in the GIS media to prepare the distribution maps during 12 months of the year.
3. Results and Discussion
3.1. Climate Comfort Conditions in January, February and March
Very good to ideal condition was observed after integration the weights of preci-pitation, wind, sunshine, CID and CIA to obtain TCI for the first three months of the year (Figure 2). Although, the temperature of most parts of the country tended to decrease, statistical analysis showed that none of the monthly average temperature of the studied counties was below 10˚C. Sub indices of CID and CIA decreased in counties with higher elevation (Khash and Saravan) which can be due to higher precipitation in winter. CIA and CID indexes reached the high-est point (5) and ideal TCI for Chabahar, however, for Iranshahr and Nikshahr only CID reached the maximum point (5) and TCI was excellent. These two in-dices (CID and CIA) were lower for Khash and Saravan and consequently the TCI ranged good to very good.3.2. Climate Comfort Conditions in April, May and June
Geographical distribution of TCI in April, May and June is given in Figure 3. These months refer to spring and thus tourism conditions are expected to be different from other months of the year. Ideal to good ranks were observed for counties with higher elevation and mountainous climate (i.e. Khash and Sara-van). However, marginal conditions were obtained for Nikshahr and Iranshahr by arriving summer because of warm weather. Sunshine hours (>4.5), summer precipitation (5) and high values of CID and CIA for high elevation counties were led to ideal to good TCI. In spite of similar sunshine and precipitation ranks, lower TCI values for other counties of Baluchestan can be due to extreme temperatures in Nikshahr and Iranshahr and humidity in Chabahar which nega-tively affect CID and CIA and consequently good to acceptable TCI. However, an exception was observed for Chabahar in June which can be attributed to the beginning of monsoon season and wind hence improving tourism conditions and TCI (excellent).
3.3. Climate Comfort Condition in July, August and September
DOI: 10.4236/ojg.2017.78082 1231 Open Journal of Geology January
February
[image:5.595.287.460.63.693.2]March
Figure 2. Geographical distribution of TCI in January, February and March for
DOI: 10.4236/ojg.2017.78082 1232 Open Journal of Geology April
May
[image:6.595.290.457.62.694.2]June
Figure 3. Geographical distribution of TCI in April, May and June for Baluchestan region
DOI: 10.4236/ojg.2017.78082 1233 Open Journal of Geology July
August
[image:7.595.288.459.63.690.2]September
Figure 4. Geographical distribution of TCI in July, August and September for
DOI: 10.4236/ojg.2017.78082 1234 Open Journal of Geology September. These months refer to summer and elevation significantly affects the TCI during these months. Elevated counties (Khash and Iranshahr) had better extreme temperatures in comparison with other counties and also had higher CID and CIA and TCI ranging from good to acceptable. CID and CIA indexes were too small (0 - 1) for Nikshahr and Iranshahr, thus marginal TCI was ob-served in July and August, however, in September, better climate condition was led to acceptable TCI. In Chabahar, in spite of lower temperature, high average humidity caused a decrease in CID and CIA indexes and TCI for July was mar-ginal and for August and September was acceptable.
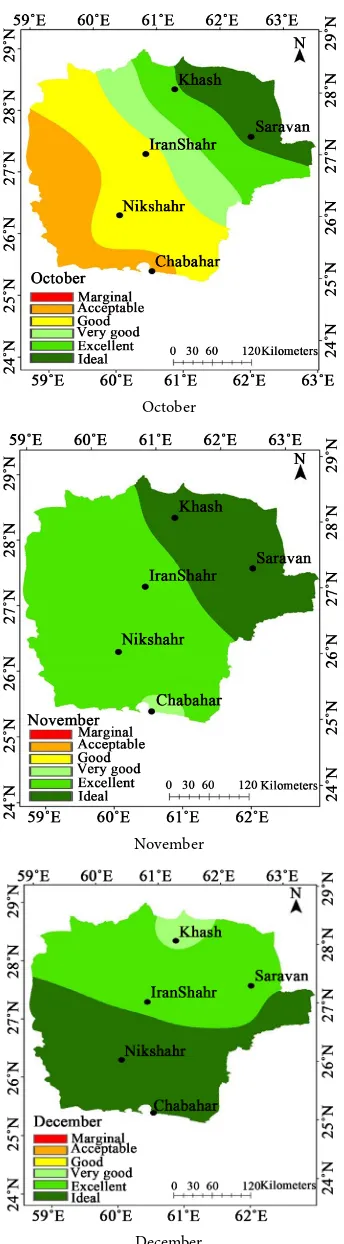
3.4. Climate Comfort Condition in October,
November and December
By decreasing temperature in autumn, climate condition changed (Figure 5). This season had better climate comfort in comparison with previous season and those counties (Nikshahr and Iranshahr) had marginal TCI in previous months were classified in a very good conditions. An increasing trend in CID and CIA indexes (from 2 to 4) represented higher TCI and better tourism conditions. Very good to ideal TCI was observed for all counties in December. TCI also in-creased from 62 (good) to 90 (ideal) for Nikshahr and Iranshahr. However, since December ends in winter, TCI decreased from excellent to very good in counties with high elevation (Khash and Saravan). Monthly scattering diagram of TCI in all counties of Baluchestan region is also shown in Figure 6.
Generally, elevation has the important effect on tourism climate condition of Baluchestan. Thus, higher elevated counties (i.e. Khash and Saravan) have dif-ferent tourism season compared to Nikshahr, Iranshahr and Chabahar. A high correlation was observed between Nikshahr and Iranshahr for TCI (R2 = 0.96) which may be due to the similar elevation. On the other hand, a good correlation of .63 was also observed between Saravan and Khash (with similar elevation) in the case of TCI. Khash had higher elevation and lower average temperature compared to Sravan and therefore is more suitable for tourism in spring and summer. Conversely, due to higher temperature as a result of lower elevation in Saravan, this county has better tourism climate conditions compared to Khash.
4. Conclusion
In winter, Baluchestan had very good to ideal TCI. Marginal to ideal TCI was observed in spring, except for Chabahar which had excellent TCI due to mon-soon wind. In summer, elevation plays an important role for determination of TCI and acceptable TCI was achieved. By decreasing temperature in autumn, better tourism conditions and ideal TCI were observed. Similar climate condi-tion in Nikshahr and Iranshhar and also in Khash and Saravan can be related to their similar elevation.
Acknowledgements
DOI: 10.4236/ojg.2017.78082 1235 Open Journal of Geology October
November
[image:9.595.288.460.65.687.2]December
Figure 5. Geographical distribution of TCI in October, November and December for
DOI: 10.4236/ojg.2017.78082 1236 Open Journal of Geology
Figure 6. Monthly scattering diagram of tourism climate index in Baluchestancounties.
Conflict of Interests
Authors have declared that no competing interests exist.
References
[1] Costa, J. and Eccles, G. (1996) Hospitality and Tourism Impacts: An Industry Pers-pective. International Journal of Contemporary Hospitality Management, 8, 11-19.
https://doi.org/10.1108/09596119610152014
[2] WTO (1998) Tourism 2020 Vision. Publications Unit, World Tourism Organiza-tion, Madrid.
[3] Matzarakis, A. (2006) Weather- and Climate-Related Information for Tourism.
Tourism and Hospitality Planning & Development, 3, 99-115.
https://doi.org/10.1080/14790530600938279
[4] Fang, Y. and Yin, J. (2015) National Assessment of Climate Resources for Tourism Seasonality in China Using the Tourism Climate Index. Atmosphere, 6, 183-194.
https://doi.org/10.3390/atmos6020183
[5] Mieczkowski, Z. (1985) The Tourism Climatic Index: A Method of Evaluating World Climates for Tourism. The Canadian Geographer, 29, 220-233.
https://doi.org/10.1111/j.1541-0064.1985.tb00365.x
[6] Matzarakis, A., Endler, C. and Nastos, P.T. (2014) Quantification of Climate-Tour- ism Potential for Athens, Greece-Recent and Future Climate Simulations. Global NEST Journal, 16, 43-51.
[7] Roson, R. and Sartori, M. (2012) Climate Change Impacts on Tourism in the Medi-terranean. No. 4624, EcoMod.
[8] Scott, D., Mcboyle, G. and Schwartzentruber, M. (2004) Climate Change and the Distribution of Climatic Resources for Tourism in North America. Climate Re-search, 27, 105-117.https://doi.org/10.3354/cr027105
[9] Nicholls, S. and Amelung, B. (2008) Climate Change and Tourism in Northwestern Europe: Impacts and Adaptation. Tourism Analysis, 13, 21-31.
https://doi.org/10.3727/108354208784548724
DOI: 10.4236/ojg.2017.78082 1237 Open Journal of Geology
Azerbaijan Province). Geography and Environmental Planning Journal, 49, 21-24. [11] Bakhtiari, B. and Bakhtiari, A. (2013) Determination of Tourism Climate Index in
Kerman Province. Desert, 18, 113-126.
[12] Gholami, Y., Moezi, S.A., Bakhshaei, H. and Khosravi, L. (2015) Climate Comfort Index Set for Tourists Using the Tci the Case Study: Khorasan Razavi Province (Northeast of Iran). Journal of Social Issues & Humanities, 3, 178-183.
[13] INRS (2008) Hyfran-Plus Software. Quebec.
https://www.wrpllc.com/books/HyfranPlus/indexhyfranplus3.html
Submit or recommend next manuscript to SCIRP and we will provide best service for you:
Accepting pre-submission inquiries through Email, Facebook, LinkedIn, Twitter, etc. A wide selection of journals (inclusive of 9 subjects, more than 200 journals)
Providing 24-hour high-quality service User-friendly online submission system Fair and swift peer-review system
Efficient typesetting and proofreading procedure
Display of the result of downloads and visits, as well as the number of cited articles Maximum dissemination of your research work
Submit your manuscript at: http://papersubmission.scirp.org/