ISSN Online: 2331-4249 ISSN Print: 2331-4222
DOI: 10.4236/wjet.2017.53B008 Aug. 11, 2017 62 World Journal of Engineering and Technology
Simulation on the Time Progress of the
Non-Point Source Pollution Load in Initial Stage
Runoff for Small Watershed
Mingyuan Sun
1,2, Tiantian Liu
2, Bo Chen
2, Yi Zhang
2, Longxi Han
1,21Key Laboratory of Integrated Regulation and Resource Development on Shallow Lake of Ministry of Education, College of
Environment, Hohai University, Nanjing, China
2College of Environment, Hohai University, Nanjing, China
Abstract
Taking a reservoir in South China as an example, we use rainfall-runoff unit hydrograph method to analyze the time changing process of surface runoff in-flow, which generated by typical design rainfall. On the basis of time series data of flow and water quality in control section of the main rivers in Xili Re-servoir, we establish mathematical response relation between non-point source pollutants flux, such as flux of COD, flux of NH3-H, in catchment area of control section and runoff. Then we simulate the time dynamic change progress of non-point source pollution load which generate with the initial stage runoff that generated by design rainfall and flow into reservoir. It can provide technical parameters for the design of non-point source which gener-ate from early runoff treatment project.
Keywords
Small Watershed, Initial Runoff, Non-Point Source Pollution Load, Time Change Process
1. Introduction
With the further development of point source pollution control, point source pollution has been initially controlled. However, the proportion of non-point source pollution is increasing in China [1] [2]. It has been the main object of comprehensive treatment of water pollution. Non-point source pollution accu-mulates on the surface of the earth and pollutes water bodies by the rainfall ero-sion and surface transportation. Due to the complexity and variety of pollutants How to cite this paper: Sun, M.Y., Liu,
T.T., Chen, B., Zhang, Y. and Han, L.X. (2017) Simulation on the Time Progress of the Non-Point Source Pollution Load in Initial Stage Runoff for Small Watershed. World Journal of Engineering and Tech-nology, 5, 62-70.
https://doi.org/10.4236/wjet.2017.53B008
DOI: 10.4236/wjet.2017.53B008 63 World Journal of Engineering and Technology pirical model [6], for example, based on the method of non-point source pollu-tion load output coefficient, Long, et al. [7] introduce the pollution load coeffi-cient and establish a mathematical model for nitrogen and phosphorus load in non-point sources. Then he forecast the total annual load of non-point source nitrogen and phosphorus in the Three Gorges Reservoir Area in 2020 by com-bining with distributed SLUP hydrological model. Cai, et al. [8] establish the correlation between rainfall and non-point source pollution load in research area by analyzing the water quality and hydrological monitoring data in Weihe Basin, then she calculate the total non-point source pollution load of single rainfall in watershed. Zhou et al. [9] analyze the monitoring data of rainfall and rainfall runoff pollutants in Zhenjiang ancient canal and establish the rainfall-runoff pollution equation. Furthermore, he uses the grey theory to forecast the rainfall in the future and get the total annual load of rainfall runoff pollution.
Up to now, the most study of the pollution load of rainfall runoff in Wa-tershed only give the total amount of non-point source pollution load in single rainfall, there is few study on the process of pollution load changing with time of raining. So, this article establishes the relationship between the concentration of pollutant source and cumulative runoff by the monitoring value of water and water quality of main river in Xili Reservoir. Furthermore, we give the progress of non-point source pollution load flux changing with time of a typical rainfall.
2. Situation of Typical Study Area
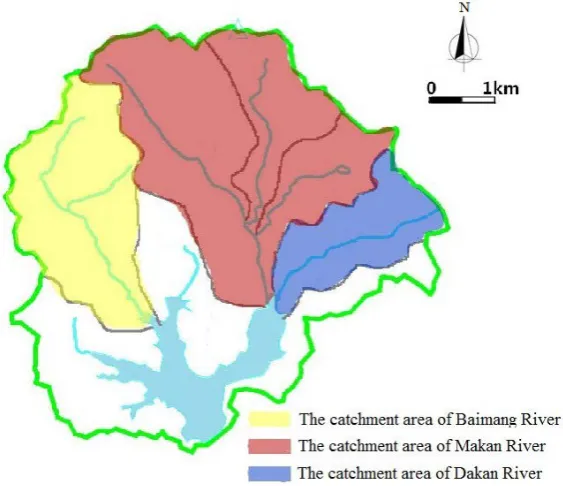
Xili reservoir is located in the Pearl River Delta in the upper reaches of Shahe River, and it is also in Shenzhen Nanshan District Xili Street. Its water area is about 4.6 km2 and total storage capacity is about 3.41 × 10⁷ m3. There are three main river in Xili reservoir which are Baimang River, Makan River and Dakan River respectively. Xili reservoir is one of the important drinking water source library of Shenzhen City. The catchment area and geographical parameters of control sections of the main inflow rivers are shown in Figure 1 and Table 1.
DOI: 10.4236/wjet.2017.53B008 64 World Journal of Engineering and Technology Figure 1. The catchment unit diagram of the main rivers in Xili reservoir.
Table 1. Geographic parameter table of the control section in the main rivers.
Section name Catchment area/km2 River length/km The average slope The control section of Baimang River 3.36 4.7 0.014 The control section of Baimang River 9.69 3.3 0.021 The control section of Baimang River 2.23 2.78 0.022
to dry year is 6:1 and the variation of annual inflow is consistent with the change of rainfall.
3. Simulation of the Progress of Runoff Generation and
Confluence in Small Watershed
3.1. The Manner of Simulating the Progress of Runoff Generation
and Confluence in Small Watershed
[image:3.595.206.541.364.433.2]DOI: 10.4236/wjet.2017.53B008 65 World Journal of Engineering and Technology Confluence
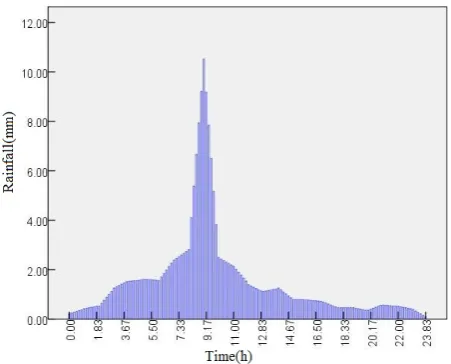
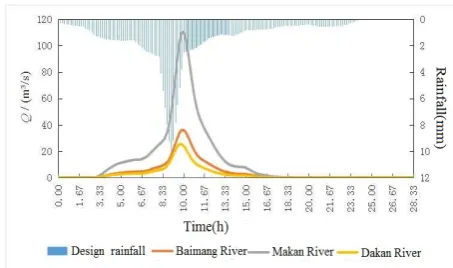
According to the design progress of rainstorm and the simulation method of the progress of runoff generation and confluence, we get rainfall-runoff unit hydro-graph and the design progress of flow for the watershed of the main rivers (Bai-mang River, Makan River, Dakan River). The result is shown in the Figure 3 and Figure 4.
[image:4.595.261.487.328.510.2]As can be seen from the above figure, under the above conditions, the flow in control section of main rivers begins to appear when it rains for 2.33 - 2.5 hours.
[image:4.595.260.488.542.693.2]Figure 2. The design progress of rainstorm in Xili Reservoir.
DOI: 10.4236/wjet.2017.53B008 66 World Journal of Engineering and Technology Figure 4. The progress of design rain and design runoff
hy-drograph corresponding of the main river.
The time difference between the maximum rainfall intensity of the design and the peak of the control section is 0.83 - 1 hour.
4. The Simulation Analysis of the Production Process of
Non-Point Source Pollution Load
4.1. The Establishment of the Mathematical Model of the
Watershed Surface Source Load
He [11] believes that the concentration of pollutants decreases in rainoff until it is stable by the cumulative runoff increasing. Based on the rain which rainfall is 188 mm in the study area, the measured data of the water quality and the meas-ured data of the rainfall in the entrance section are analyzed by the method of power function and exponential function. The results show that the index func-tion can be used to study the correlafunc-tion between the concentrafunc-tion of pollutants and the cumulative runoff. Among them, the function expression of the re-sponse relation mathematical function between measurement COD concentra-tion which is of the main control secconcentra-tion and the cumulative runoff or between measurement ammonia nitrogen concentration which is of the main control sec-tion and the cumulative runoff were respectively:
119.6258 1093.581*exp( / 31378.42)
CODBai
y = + −x (1)
3- 1.09985 37.30015*exp( / 20203.40)
NH NBai
y = + −x (2)
60.00308 597.65255*exp( /11853.291)
CODMa
y = + −x (3)
3- 1.85967 23.24033*exp( / 6233.355)
NH NMa
y = + −x (4)
In the calculation, y is the measurement contaminant concentration of the section, mg/L; X is the cumulative runoff of the control section, m³.
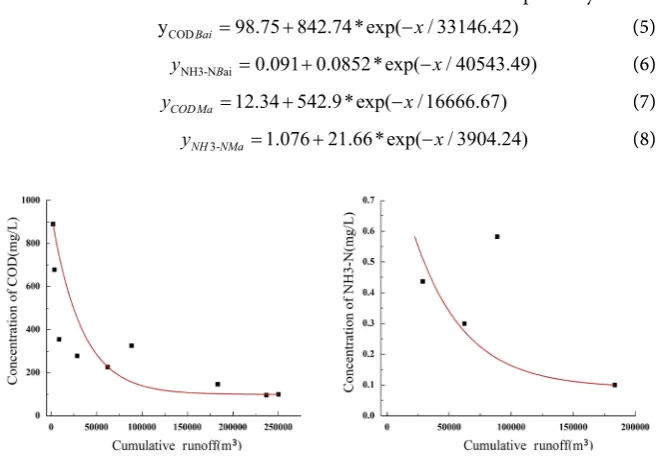
DOI: 10.4236/wjet.2017.53B008 67 World Journal of Engineering and Technology tant concentration and cumulative runoff can be got by mathematical fitting. The results are shown in Figure 5 and Figure 6. Among them, the function ex-pression of the response relation mathematical function between non-point source COD concentration which is of the main control section and the cumula-tive runoff or between non-point source ammonia nitrogen concentration which is of the main control section and the cumulative runoff were respectively:
COD
y Bai=98.75 842.74*exp( / 33146.42)+ −x (5)
NH3-N aiB 0.091 0.0852*exp( / 40543.49)
y = + −x (6)
12.34 542.9*exp( /16666.67)
CODMa
y = + −x (7)
3- 1.076 21.66*exp( / 3904.24)
NH NMa
[image:6.595.210.539.278.510.2]y = + −x (8)
Figure 5. The curve of concentration of non-point source pollutants with accumulated runoff in Baiman River.
[image:6.595.213.533.555.692.2]DOI: 10.4236/wjet.2017.53B008 68 World Journal of Engineering and Technology In the calculation, y is the non-point source contaminant concentration of the section, mg/L; X is the cumulative runoff of the control section, m³.
4.2. The Analysis of the Time Process of the Contamination
Con-centration of the Reservoir in the Basin
According to the correlation between non-point source pollutant concentration and cumulative runoff in Baimang River, Makan River and Dakan River, and the time variety progress of design runoff in Baimang River, Makan River and Da-kan River, it can get cumulative runoff and its corresponding non-point source pollutant concentration in different times. Then, based on the time variation progress of cumulative runoff, it get the time variety progress of non-point source pollutant concentration which flow into the reservoir (the time variation progress of non-point source COD pollutant concentration in the control sec-tion of Baimang River and Makan River is shown in Figure 7).
Due to the difference of the increment of cumulative runoff in unit time and the variation of non-point source pollutants concentration when the same cu-mulative runoff flow from the control section during rainfall duration, non- point source COD concentration in main rives decrease at different rates, until finally tends to be stable. The initial COD concentration in the Baimang River basin was 941 mg/L, it gradually stabilizes at 9.83 hours, and the steady concen-tration was about 98mg/L. The initial COD concenconcen-tration in the Makan River basin was 555 mg/L, it gradually stabilize at 6.50 hours, and the steady concen-tration was about 12 m g/L.
4.3. The Analysis of the Time Varialation Process of the Flux Time
of the Source of the Reservoir in the Basin
According to the time variation process of non-point source pollutants concen-tration in main rivers of the study area and the time variation process of design runoff, the time variation process of non-point source pollutants flux can be get (the time variation progress of non-point source COD pollutant flux in the con-trol section of Baimang River and Makan River is shown in Figure 8).
As can be seen from the above figure, the non-point source COD pollutant
DOI: 10.4236/wjet.2017.53B008 69 World Journal of Engineering and Technology Figure 8. The curve of the time variation progress of non-point source COD pollutant flux in the control section of Baimang River and Makan River.
flux in the control section of the Baimang River and the Makan River are fluc-tuating with the increase of the rainfall time. This phenomenon is caused by va-rying the change rate of the contaminant concentration at the same time as de-sign runoff in control section. For example, when the rain of Baimang River oc-curred 2.50 h - 4.83 h, the non-point source pollutant concentration of control section decrease more smoothly, but the runoff of control section increase rela-tively fast, so the non-point source pollutant flux is increasing. During the pe-riod of 4.83 h - 7.00 h, with the non-point source pollutant concentration of control section decrease rapidly and the runoff of control section increase slow-ly, the non-point source COD pollutant flux decrease.
5. Conclusions
1) The time variation progress of non-point source pollutant flux in study area which is based on the time series data of runoff and water quality which is si-multaneous observation of control section in Xili Reservoir has considered the loss of the process of non-point source pollutant from where it generates to con-trol section. This manner improves the accuracy of simulation calculation.
2) Because the time between runoff and pollution which is produced from the rain and the progress of the rain are different. The non-point source pollutant load of catchment for the main rivers began to enter the reservoir after the rain occurred for period of time. The non-point source pollutant concentration achieved peak when the runoff remitted to control section; then it decreased at a slower rate for a relatively short period of time. Afterwards, the concentration of non-point source pollutants decreased rapidly by the increase of the runoff.
DOI: 10.4236/wjet.2017.53B008 70 World Journal of Engineering and Technology produced from the first 10 hours accounted for 74.27% of the total non-point source ammonia nitrogen pollution load in the runoff which is produced from the whole rainfall process.
Acknowledgements
This research was supported by the Research Program for the key technologies of the Sewage Outlet Setting in Deepwater Region.
References
[1] Cai, S.W., Pei, X.M., Zhang, Y.L., et al. (2006) Research on Agricultural Diffuse Pollution and Controlling Technology. Journal of Soil and Water Conservation, 20, 192-195. (In Chinese)
[2] Zhao, Y.X., Liu, S.H. and Zhang, R.G. (2007) The Agricultural Non-Point Pollution and Measures of Prevention and Control. Inner Mongolia Environmental Science, No. 1, 9-12. (In Chinese)
[3] Wang, Y.H. (2007) Pollution of City Rainfall Runoff and Its Controlling Measures. Shanxi Architecture, 33, 184-185. (In Chinese)
[4] Wang, L., Huang, Y.F. and Wang, G.Q. (2010) Review of Urban Non-Point Source Pollution Models. Environment Sciences, 31, 2532-2540. (In Chinese)
[5] Park, S.Y., Lee, K.W., Park, I.H., et al. (2008) Effect of the Aggregation Level of Sur-face Runoff Fields and Sewer Network for a SWMM Simulation. Desalination, 226, 328-337. https://doi.org/10.1016/j.desal.2007.02.115
[6] Liu, M. (2012) A Thesis Submitted in Partial Fulfillment of the Requirements for the Degree of Master of Engineering. Thesis, Huazhong University of Science and Technology, Hubei. (In Chinese)
[7] Long, T.Y., Liang, C.D., Li, J.C., et al. (2008) Forecasting the Pollution Load of Non-Point Pollution Sources Imported to the Three Gorges Reservoir. Acta Science Circumstantiae, No. 3, 574-581. (In Chinese)
[8] Cai, M., Li, H.E. and Zhuang, Y.T. (2005) Rainfall Deduction Method for Estimat-ing Non-Point Source Pollution Load for Watershed. Journal of Northwest Sci-Tech University of Agriculture and Forestry (Natural Science Edition), No. 4, 102-106. (In Chinese)
[9] Zhou, M.T., Hu, X.D., Zhang, S.D., et al. (2015) Development of the Method to Es-timate the Annual Load of Rainfall-Runoff Non-Point Source Pollution—A Case
Study in Zhenjiang Ancient Canal. Chinese Journal of Mechanical Engineering, No. 8, 1381-1386. (In Chinese)
[10] Rui, X.F., Liu, N.J., Ling, Z., et al. (2012) Development and Inspiration of Unit Hy-drograph. Advance in Science and Technology of Water Resources, No. 2, 1-5. (In Chinese)
[11] He, L. (2011) Research on Surface Contaminants Washoff Rule and the First Flush Effect with Artificial Rainfall Simulation. Thesis, Wuhan University of Technology, Hubei. (In Chinese)
Display of the result of downloads and visits, as well as the number of cited articles Maximum dissemination of your research work