A Discriminative Model for Perceptually-Grounded
Incremental Reference Resolution
Casey Kennington CITEC, Bielefeld University
ckennington@cit-ec. uni-bielefeld.de
Livia Dia University of York
David Schlangen Bielefeld University
david.schlangen@ uni-bielefeld.de
Abstract
A large part of human communication involves referring to entities in the world, and often these entities are objects that are visually present for the interlocutors. A computer system that aims to resolve such references needs to tackle a complex task: objects and their visual features must be de-termined, the referring expressions must be recognised, extra-linguistic information such as eye gaze or pointing gestures must be incorporated — and the intended connection between words and world must be reconstructed. In this paper, we introduce a discriminative model of reference resolution that processes incrementally (i.e., word for word), is perceptually-grounded, and improves when interpo-lated with information from gaze and pointing gestures. We evaluated our model and found that it performed robustly in a realistic reference resolution task, when compared to a generative model.
1 Introduction
Reference to entities in the world via definite description makes up a large part of human communication (Poesio and Vieira, 1997). In task-oriented situations, these references are often to entities that are visible in the shared environment. In such co-located settings, interlocutors can make use of extra-linguistic cues such as gaze or pointing gestures. Furthermore, listeners resolve references as they unfold, often identifying the referred entity before the end of the reference (as found, inter alia, by Tanenhaus and Spivey-Knowlton (1995); Spivey (2002)). Computational research on reference resolution, however, has mostly focused on offline processing of full, completed referring expressions, and not attempted to model this online nature of human reference resolution. On a more technical level, most of the models making use of stochastic information (see discussion below) have been generative models; even though such models are known to often have certain disadvantages compared to discriminative models.1
In this paper, we introduce a discriminative model of reference resolution that isincrementalin that it does not wait until the end of an utterance to process, rather it updates its interpretation at each word. Moreover, the semantics of each word isperceptually groundedin visual information from the world. We evaluated our model and found that it works robustly when compared to a similar generative approach.
In the following section we explain the task of reference resolution and discuss related work. That is followed by an explanation of our model and evaluation experiment. We end with some analyses of the model’s strengths and areas of improvement.
2 Background and Related Work on Reference Resolution
Reference resolution (RR) is the task of resolving referring expressions (henceforth REs; e.g., the red one on the left) to the entity to which they are intended to refer; thereferent. This can be formalised as a functionfrr that, given a representationU of theREand a representationW of the (relevant aspects
1But see the nuanced discussion by Ng A.Y. & Jordan M. I. (2002).
of the) world (which can include aspects of the discourse context), returnsI∗, the identifier of one the
objects in the world that is the intended referent of theRE.
I∗ =frr(U, W) (1)
This functionfrrcan be specified in a variety of ways. A number of recent papers have used stochas-tic models using the following approach: givenW andU, the goal ofRRis to obtain a distribution over a specified set of candidate entities in that world, where the probability assigned to each entity represents the strength of belief that it is the referred one. The referred object is then the argmax of that distribution:
I∗ = argmax
I P(I|U, W) (2)
We have worked in this area before. Kennington and Schlangen (2013) we applied Markov Logic Networks (Richardson and Domingos, 2006) to the task of computing the distribution overI. The world
W, a virtual game board of puzzle pieces, was represented symbolically (e.g., objects were represented by their properties such as colour and shape). The utteranceUwas represented by its words. We repeated the experiments later in Kennington et al. (2013) where the utterance and world were represented in the same way, but the model that produced the distribution over the candidate objects was generative; it modeled the joint distribution over the objects and their properties, and the words in the utterance. (This model will be further discussed and used as a baseline for comparison below.) In Kennington et al. (2014); Hough et al. (2015) we used that same generative model and representation of W, butU was represented as a semantic abstraction.
Funakoshi et al. (2012) used a Bayesian network approach. The worldW (in their case, a set of tangram puzzle pieces) was represented as a set ofconcepts(e.g., shape type), and U was represented by the words in theREs, in an interctive human-human setting. The Bayesian network was used to learn a mapping between concepts and U. The model could handle various types of REs, namely definite references, exophoric pronoun references, and deictic (pointing) references to objects. Similar data was used in Iida et al. (2011), but the mapping betweenU andW was done with a support vector machine classifier. We recently applied our generative model to this data, with improved results in some areas Kennington et al. (2015).
Engonopoulos et al. (2013) also used a generative approach; W was modeled as an observation model(i.e., a set of features over the objects in a 3D scene), andU was asemanticmodel that abstracted over the referring expression.
In Matuszek et al. (2014),W was represented as a distribution over properties (e.g., color and shape) of real-world objects (small wooden blocks of various shapes and colors) as represented by computer-vision output. U was represented as a semantic abstraction in the form of a Combinatory Categorical Grammar parse. ResolvingI amounted to generatively computing a joint distribution over the represen-tation ofU andW.
In all of these approaches, the objects are distinct and have specific visualproperties, such as color, shape, and spatial placement. The set of properties is defined and either read directly from the world if it is virtual, or computed (i.e., discretised) from the real world objects. In this paper, we take a different approach to representing the worldW and how the distribution forIis computed. Instead of representing the world as a set of discrete properties or concepts, we represent the world with a set of more low-level visual features (e.g., color-values) and compute the distribution over objects discriminatively, as will be explained in Section 3. This represents a kind of perceptually-grounded learning of how visual features connect to words in the RE, where the meaning of the word is represented by a classifier, as explained below.
meaning into a formal semantics by a model that was tested in a game where participants described a simple object as being on theleftorrightside of the game board. Both of these approaches focused on a very limited lexicon of words that are used to described visual objects, namely colours or left/right, and these approaches only took limited perceptual information into account. In this paper, we don’t limit the lexicon to a certain class of words, rather we attempt to learn a perceptually-grounded meaning of all the words in a corpus (described below).
SituatedRRis a convenient setting for learning perceptually-grounded meaning, as objects that are referred to physically exist, are described by theRE, and have visual features that can be computationally extracted and represented. Kelleher et al. (2005) approached RR using perceptually-grounded models, focusing on saliency and discourse context. The task of RR was also used in Gorniak and Roy (2004); descriptions of objects were used to learn a perceptually-grounded meaning with focus on spatial terms such ason the left. However, unlike our approach, these approaches did not model the meaning of words directly, nor are they incremental.
3 A Model of Reference to Visible Objects
Our model interpolates information from the referring expression proper and from other, multimodal information sources such as gaze and pointing gestures. We will describe the parts of the model in turn.
3.1 A Discriminative Model of Linguistic Evidence
Overview As explained with formula (2), we want our model to give us a probability distribution over the candidate objects, given a referring expression (or, to be more precise, given possibly just a prefix of the expression). Instead of trying to learn a mapping between full referring expressions and objects, we break the problem down into one of learning a mapping between individual words and objects, and of composition of the evidence into a prediction for the full expression (or expression prefix).
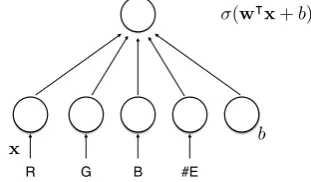
The Word Model At the basis of the model then is a prediction for a given word and a given object of how well the object fits the word. To compute this, we trained for each word w from our corpus of referring expressions a binary logistic regression classifier that takes a representation of a candidate object via visual features (x) and returns a probabilitypwfor it being a good fit to the word (wherewis the weight vector that is learned andσis the logistic function):
pw(x) =σ(w|x+b) (3)
This model is shown in Figure 1 as a one-layer neural network.
R G B #E
(w|x+b)
x b
Figure 1:Representation as 1-layer NN
hue, saturation, value red, green, blue number of detected edges
x,y coordinates horizontal skewness
[image:3.595.108.264.579.670.2]vertical skewness orientation value
Figure 2: List of features used in our model (total of 12 features).
shown in Algorithm 1. This selection of negative examples makes the assumption that the words from theREapply only to the referent. This is wrong as a strict rule, as other objects could have similar visual features as the referent; for this to work, however, this has to be the case only more often than it is not. This is so for our domain, and in general seems a plausible thing to assume that often words used inREs do indeed uniquely single out their referent.
Algorithm 1Training algorithm for our model, each word classifier receives a set of positive and negative training examples, then maximum likelihood is computed for each word.
1: procedureTRAIN(frame) 2: foreachREin corpusdo 3: foreachwordinREdo
4: pairwordwith features of object referred to byRE; add topositive examples 5: pairwordwith features ofnobjects not referred to byRE; add tonegative examples 6: end for
7: end for
8: foreachwordin vocabularydo 9: trainwordbinary classifier 10: end for
11: end procedure
Application and Composition This model gives us a prediction for a pair of word and object. What we wanted, however, is a distribution over all candidate objects, and not only for individual words, but for (incrementally growing) full REs. To get the former, we apply the word/percept classifier to each candidate object, and normalise (wherexiis the feature vector for objecti):
P(I =i|U =w, W) = Ppw(xi)
k∈Ipw(xk) (4)
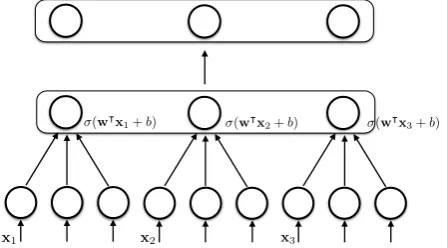
In effect, this turns this into a multi-class logistic regression / maximum entropy model—but only for application. The training regime did not need to make any assumptions about the number of objects present, as it trained classifiers for a 1-class problem (how well does this given object fit to the word?). The multi-class nature is also indicated in Figure 3, which shows multiple applications of the network from Figure 1, with a normalisation layer on top.
(w|x
1+b) (w|x2+b) (w|x3+b)
[image:4.595.189.413.496.620.2]x1 x2 x3
Figure 3:Representation as network with normalisation layer.
To compose the evidence from individual words into a prediction for the whole (prefix of the) re-ferring expression, we chose the simplest possible approach, namely simply to average the previous distribution with the new one. This represents an incremental model where new information from the current increment is added to what is already known. Such a simple model represents an intersective way of composing the words (or, rather, their denotations). More sophisticated approaches can be imagined (e.g., using syntactic structure); we leave exploring them to future work.
3.2 Evidence from Gaze and Deixis
The full model combines the evidence from linguistic information with evidence from other information sources such as the speaker’s gaze and pointing gestures. For each, we calculate a reference point (R) on the scene: for gaze, the fixated point as provided by an eye tracker; for deixis, the point on the scene that was pointed at based on a vector calculated from the shoulder to the hand (as described in Kousidis et al. (2013), using the Microsoft Kinect). The centroids of all the objects (I) can then be compared to that reference point to yield a probability of that object being ‘referred’ by that modality (i.e., gazed at or pointed at) by introducing a Gaussian window over the location of the point:
pdistance(Ri, Ij;σ) = exp−(xi−xj) 2
2∗σ2 ∗exp−
(yi−yj)2
2∗σ2 (6)
where the mean isRandσis set by calculating the standard deviation of all the object centroids and the reference point. This can then be normalised over all thepdistance scores to produce a distribution overI for each modality where the closer the object is to the reference point, the higher its probability. (We implicitly make the somewhat naive assumption here that the referred object will be looked at by the speaker most of the time during and around theRE. This is in general not true (Griffin and Bock, 2000), but works out here.)
Our final model of RR fuses the the three described modalities of speech, gaze, and deixis using a linear interpolation, where theαparameters are learned from held-out data by ranging over values such that theαvalues sum to one, and computing the average rank (metric explained below), retaining theα
values that produced the best score for that set:
P(I|S) =P(I|S1)α1+P(I|S2)α2+P(I|S3)(1−α1−α2) (7)
4 Evaluation
We will now explain our evaluation experiment, including the data we used, the pre-processing performed on it, a generative model that we will compare to, and the metrics that we will use in our evaluation. We end this section with the results.
4.1 Data
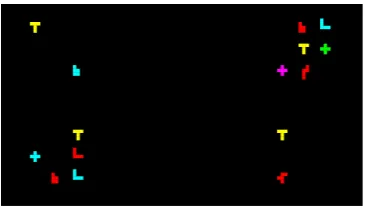
Figure 4:Example Pentomino board for gaze and deixis experiment; the yellow T in the top-right quadrant is the referred object.
Figure 5:Pentomino Board that has been dis-torted from its original form (Figure 4); all ob-jects have distorted shapes and colors.
For each episode, the corpus contains two transcriptions of the utterance (one performed by expert transcribers, as well as one created by Google Web Speech; WER 49.8% when compared to expert transcription), deixis and gaze information, as well as an image of what the board looked like to the participant, see Figure 4. Removing episodes that were flagged by the Wizard yielded 1049 episodes with corresponding data. We also have a version of each board image that has been processed in a more involved way, which will now be explained.
Scene Processing We want our model to work with images of real objects as input, even though for our particular data the scenes are represented symbolically (that is, we know without uncertainty each piece’s shape, color, and position). Using the images that were generated from these symbolic descriptions and performing computer vision on them does not introduce much uncertainty, as there is no variation in color or appearance of individual shapes, and so the data cannot serve to form generalisations. To get closer to conditions as they would hold when working with camera images (e.g., variations of color due to variations in lighting, distortion of shapes due to camera angles, etc.), we pre-processed these images:2
We shifted the color spectrum as follows: the hue channel by a random number between -15 and 15 and the saturation and value channels by a random number between -50 and 50. For the object shapes, we apply affine transformations defined by two randomly generated triangles and warp the image using that transform. This generates more complex shapes that retain some notion of their original form. Figure 5 shows a game board that has been distorted from its original in Figure 4.
Using these distorted images, we processed each image using the Canny Edge Detector (Canny, 1986) and used mathematical morphology to find closed contours of the objects, thereby segmenting the objects from each other. We acquired the boundary of the objects (always 15 of them), following the inner contours as identified by a border tracing algorithm (Suzuki and Abe, 1985). For each individual object we then extract the number of edges, RGB (red, green, blue) values, HSV (hue saturation value), and from the object’s moments: its centroid, horizontal and vertical skewness (third order moments measuring the distortion in symmetry around the x and y axis), and the orientation value representing the direction of the principal axis (combination of second order moments). Taken together, this set of features represents a single object, which can be used for the word-object classifiers described earlier.
Procedure Using 1000 episodes, we evaluate our model across 10 folds (900 episodes for training, 100 for evaluation). Our baseline model is a generative model of RR that will be described below (random baseline is 7%). We also incorporate gaze and deixis by treating them as individual RR models and interpolating their distributions with the distribution given by the model. We ran the experiments twice, once with hand-transcribed utterances as basis forU, and once with automatic speech recogniser (ASR) output. Theα weights (Equation 7) for hand-transcribed data were for speech, deixis and gaze: 0.72, 0.16, and 0.12 respectively, and for ASR0.53, 0.23, 0.24, respectively (note that forASR, more weight was given to the non-speech models).
Task The task isRR, as described earlier. At each increment, the model returns a distribution over all objects; the probability for each object represents the strength of the belief that it is the referred one. The argmax of the distribution is chosen as the hypothesised referent.
A Stronger Baseline Model for Comparison To be able to judge the performance of our model better, we compare its results to a generative model we developed for the same domain, thesimple incremental update model(SIUM) described in Kennington et al. (2013, 2014). SIUMis a good candidate to compare with this approach because it is also meant to work incrementally and it can accommodate uncertainty in the world representation. As a generative modelSIUMlearns the joint distribution betweenREU and the worldW, and it adds as a latent variableR, the properties of the object. This is formalised as follows (following (Kennington et al., 2013); see there for further details):
P(I|U, W) = P(1U)P(I)X
r∈R
P(U|R)PW(R|I) (8)
Here,PW(R|I)models the connection between objects and properties that are picked out for verbal-isation. In the version described in Kennington et al. (2013, 2014), this model is read off the symbolic representation of the scene: the assumption is made that every property that a given object has is equally likely to be verbalised. This is where uncertainty about properties can be inserted into the model, which we do here. We trained an SVM classifier to classify the objects (pre-processed and segmented as de-scribed above) with respect to colors (e.g., classes likered,blue, etc.) and for shapes (e.g.,X,T, etc.). The spatial placement of objects was determined by rules; the board was segmented into 4 quadrants and an object received aleft/right, andtop/bottomproperty with a probability of 1 if the object was in that corresponding area of the board. Where in Kennington et al. (2013, 2014) there was exact knowledge about the properties of objects, we now have distributions over properties, and the changed assumption now is that the likelihood of a property being verbalised is proportional to the strength of belief in it having this property. Other than that,SIUMremained unchanged.
4.2 Metrics for Evaluation
To give a picture of the overall performance of the model, we reportaccuracy(how often was the argmax the intended referent) after the full referring expression has been processed andaverage rank(position of intended referent among the 15 candidates on ordered distribution; ideal would be an average rank of 1, which would also correspond to 100% accuracy). Together, these metrics give an impression of how interpretable the full distribution is, beyond just the argmax. We report results for testing the model only given speech information (and no interpolation with the other models), and the other modalities added separately and jointly. We also computed results forSIUMgiven speech information.
We also look into how the model performs incrementally. For this, we followed previously used metrics (Schlangen et al., 2009; Kennington et al., 2013), where the predicted referent is compared to the gold refererent at each increment:
•first correct: how deep into theRE(%) does the model predict the referent for the first time? •first final: if the final prediction is correct, how deep into theREwas it reached and not changed? •edit overhead: how often did the model unnecessarily change its prediction (the onlynecessary pre-diction change happens when it first makes a correct prepre-diction)?
4.3 Results
0 10 20 30 40 50 60 70
hand asr
60.3 70
57.2 69.4
54 66.7
49.9 63.9
43.2 56.4
[image:8.595.74.524.72.239.2]SIUM DISC: speech +gaze +deixis all
Figure 6:Results of our model in accuracies; higher numbers denote better results.
0 1 2 3 4
hand asr
2.41
1.85
2.63
1.93
2.67
1.88
3.14
2.16
3.57
2.68
SIUM DISC: speech +gaze +deixis all
Figure 7: Results of our model in average rank; lower numbers denote better results.
ASR output does have an impact on the performance, as expeced. The speech+deixis models tend to work better than speech+gaze models in terms of accuracy; we speculate that this is due to the (naive) assumption implicit in our setup that participants gaze at the referred object most of the time, where in fact they often look at distractors, etc., making gaze a noisier model of predicting the referent. The story, however, is slightly different for the average rank: speech+deixis is slightly worse than speech+gaze at least for hand-transcribed data; this simply means that though speech+deixis gets the referred object into the argmax position more than speech+gaze, it doesn’t always mean a better overall distribution. As expected, the best-scoring average rank is when all models are interpolated, both for hand-transcribed and ASR. Overall, there is about a 6% increase when both modalities are included when using hand-transcribed data. The increase when including both modalities is slightly larger (10%) withASR. This nicely shows that when given noisier linguistic information, the model can partially recover by taking more benefit from interpolating with other information sources.
4.4 Incremental Results
Figure 8 gives an overview of the incremental performance of our model, compared to that of SIUM. (Results here are for the hand-transcribed utterances.) As the metrics talk about “% into expression”, these metrics can of course only be computed when the eventual length of the expression is known, that is, after the fact. Moreover, to make these units comparable (as “10% into the utterance” is very different in terms of words for an utterance that consists of 2 words than for one that is 12 words long), we bin REs into the classesshort,normal,long(1-6, 7-8, 9-14 words, respectively, as to group togetherREs that are of similar length).
Ideally for use downstream in a dialogue system, the reference resolver would make a first correct decision quickly, and this would also be the final decision (that is, in the graph the two bars would be close to each other, and at a low value). As the Figure shows, DISCis somewhat earlier thanSIUMand on average that decision is very close to the final decision it makes, but it pays for this in a higher edit-overhead. When looking at first-final, SIUMis not that far away from DISC, but nevertheless, the new model beats the baseline across the board (and, as shown in Table 1, is also correct more often). DISC produces less stable predictions, which is presumably due to its response to the expression being a simple summation of the responses to its component words, whereasSIUMis a proper update model.
5 Further Analysis
% edit overhead
utt length DISC SIUM
1-6 11.5 3.8
7-8 19.76 17.2
9-14 41.0 27.5
% never correct
[image:9.595.81.480.72.238.2]utt length DISC SIUM all lengths 19.5 32.0
Table 1:% edit overhead and never correct
DISC, 1-6 DISC, 7-8 DISC, 9-14 SIUM, 1-6 SIUM, 7-8 SIUM, 9-14
percentage into referring expression
0 % 10 % 20 % 30 % 40 % 50 % 60 % 70 % 80 % 90 % 100 %
71.0 % 57.1 %
61.0 % 62.0 % 46.6 %
46.6 %
58.4 % 47.3 %
52.7 % 50.0 % 44.2 %
45.9 %
First-Correct Final
Figure 8:Incremental Performance
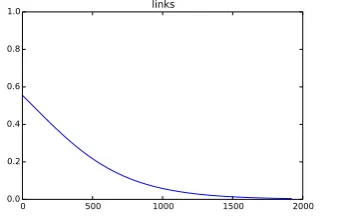
probability when given an object representation where the x-coordinate values are small (i.e., on the left of the screen), and lower probabilities for x values that are high. This was indeed the case, as shown in Figure 9. This is a nice feature of the model, as objects that are in the middle of the scene can still be described ason the left, albeit with a lower probability. We also tested how well classifiers were learned for colour words. In Figure 10 we show how changing the H S V features (representing colors) across the spectrum, keeping all other object features stable, yielded different responses from the classifier for the wordgelb (yellow), where the y-axis on the figure represents probability for that particular colour value.3
0 500 1000 1500 2000
[image:9.595.296.509.408.547.2]0.0 0.2 0.4 0.6 0.8 1.0 links
Figure 9: Strength of word links (German
for left) predicting when given different
x-coordinate values, the y-axis represents the
probability of that point beingleft.
0.0 0.2 0.4 0.6 0.8 1.0 0.0 0.2 0.4 0.6 0.8 1.0 gelb
0 50 100 150 200 250 0.5
[image:9.595.98.268.410.520.2]0.0 0.5 1.0 1.5
Figure 10: Strength of wordgelb(German foryellow) predicting when given different color (HSV) values.
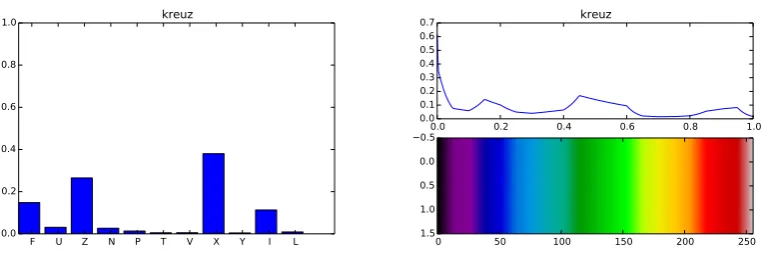
We further looked into shape words. Figure 11 shows the response of the classifier forkreuz(cross) when given object representations where only the shape-related features (number of edges, skewness) were varied across all possible shapes (the x-axis uses here the standard labeling of pentomino pieces with letters whose shapes are similar). Interestingly, the classifier generalised the word to apply not only to objects with the cross shape, but also the Z-shape piece (the red piece in the bottom of the top right group in Figure 4) and others which also intuitively seem to be more similar. For a sanity check, we looked at the responses to change in colour for the wordkreuz. As Figure 12 shows, this classifier does not pick out any specific color, as it should be. This shows that the word classifier managed to identify those features that are relevant for its core meaning, ignoring the others.
F U Z N P T V X Y I L 0.0
0.2 0.4 0.6 0.8
[image:10.595.107.489.73.204.2]1.0 kreuz
Figure 11: Strength of word kreuz (German for
cross) predicting when given different values of number of edges.
0.0 0.2 0.4 0.6 0.8 1.0 0.0
0.1 0.2 0.3 0.4 0.5 0.6
0.7 kreuz
0 50 100 150 200 250
0.5 0.0 0.5 1.0 1.5
Figure 12: Strength of word kreuz (German for
cross) predicting when given different color (RGB) values.
6 Conclusion
We presented a model of reference resolution that learns perceptually-grounded semantics from rela-tively low-level, computer vision-based features, rather than from pre-defined sets of object properties or ontologies. We tested the model and found that it worked well for the Pentomino corpus, despite having a very simple notion of compositionality. The model is discriminative and outperforms a genera-tive approach applied the same data. The model fused well with additional modalities, namely gaze and deixis, providing improved results in a reference resolution task. Perhaps best of all, the model is simple: besides the scenes and referring expressions, one only needs to know what object was referred in each scene in order to train the model, which is generally easy to annotate.
For future work, we will apply more principled methods of compositionality. We also plan to apply the model to a more systematic test of how well it performs under varied strengths of image distortion. We further plan on applying the model in a real-time multimodal learning scenario, using video images of real objects.
Acknowledgements We would like to thank the anonymous reviewers for their comments. We also want to thank Spyros Kousidis for his help with the data collection.
References
Canny, J. (1986, June). A computational approach to edge detection. IEEE transactions on pattern analysis and machine intelligence 8(6), 679–698.
Engonopoulos, N., M. Villalba, I. Titov, and A. Koller (2013). Predicting the resolution of referring expressions from user behavior. InProceedings of EMLNP, Seattle, Washington, USA, pp. 1354– 1359. Association for Computational Linguistics.
Funakoshi, K., M. Nakano, T. Tokunaga, and R. Iida (2012, July). A Unified Probabilistic Approach to Referring Expressions. InProceedings of SIGdial, Seoul, South Korea, pp. 237–246. Association for Computational Linguistics.
Gorniak, P. and D. Roy (2004). Grounded semantic composition for visual scenes. Journal of Artificial Intelligence Research 21, 429–470.
Iida, R., M. Yasuhara, and T. Tokunaga (2011). Multi-modal Reference Resolution in Situated Dialogue by Integrating Linguistic and Extra-Linguistic Clues. InProceedings of IJCNLP, Number 2003, pp. 84–92.
Kelleher, J., F. Costello, and J. Van Genabith (2005). Dynamically structuring, updating and interrelating representations of visual and linguistic discourse context.Artificial Intelligence 167(1–2), 62–102. Kennington, C., R. Iida, T. Tokunaga, and D. Schlangen (2015). Incrementally Tracking Reference
in Human/Human Dialogue Using Linguistic and Extra-Linguistic Information. In Proceedings of NAACL, Denver, U.S.A. Association for Computational Linguistics.
Kennington, C., S. Kousidis, and D. Schlangen (2013). Interpreting Situated Dialogue Utterances: an Update Model that Uses Speech, Gaze, and Gesture Information. InProceedings of SIGdial 2013. Kennington, C., S. Kousidis, and D. Schlangen (2014). Situated Incremental Natural Language
Under-standing using a Multimodal, Linguistically-driven Update Model. InProceedings of CoLing 2014. Kennington, C. and D. Schlangen (2012). Markov Logic Networks for Situated Incremental Natural
Language Understanding. InProceedings of SIGdial, Seoul, South Korea, pp. 314–322. Association for Computational Linguistics.
Kousidis, S., C. Kennington, and D. Schlangen (2013). Investigating speaker gaze and pointing behaviour in human-computer interaction with the mint.tools collection. InProceedings of SIGdial 2013. Kousidis, S., T. Pfeiffer, Z. Malisz, P. Wagner, and D. Schlangen (2012). Evaluating a minimally invasive
laboratory architecture for recording multimodal conversational data. InInterdisciplinary Workshop on Feedback Behaviors in Dialog, INTERSPEECH 2012 Satellite Workshop, pp. 39–42.
Larsson, S. (2013). Formal semantics for perceptual classification. Journal of Logic and Computation. Matuszek, C., L. Bo, L. Zettlemoyer, and D. Fox (2014). Learning from Unscripted Deictic Gesture
and Language for Human-Robot Interactions. InProceedings of AAAI Conference on Artificial Intel-ligence. AAAI Press.
Ng A.Y. & Jordan M. I. (2002, December). On Discriminative vs. Generative Classifiers: A compari-son of Logistic Regression and Naive Bayes, Neural Information Processing Systems. . InMachine Learning, Vancouver, Canada.
Poesio, M. and R. Vieira (1997, June). A Corpus-Based Investigation of Definite Description Use. Comput. Linguist. 24(2), 47.
Richardson, M. and P. Domingos (2006). Markov logic networks. Machine Learning 62(1-2), 107–136. Schlangen, D., T. Baumann, and M. Atterer (2009). Incremental Reference Resolution: The Task, Met-rics for Evaluation, and a Bayesian Filtering Model that is Sensitive to Disfluencies. InProceedings of SIGdial, London, UK, pp. 30–37. Association for Computational Linguistics.
Spivey, M. (2002). Eye movements and spoken language comprehension: Effects of visual context on syntactic ambiguity resolution. Cognitive Psychology 45(4), 447–481.
Steels, L. and T. Belpaeme (2005). Coordinating perceptually grounded categories through language: a case study for colour. The Behavioral and brain sciences 28(4), 469–489; discussion 489–529. Suzuki, S. and K. Abe (1985). Topological structural analysis of digitized binary images by border
following. Computer Vision, Graphics, and Image Processing 29(30), 396.