Evidence of syntactic working memory usage in MEG data
Marten van Schijndel Department of Linguistics The Ohio State University [email protected]
Brian Murphy∗ School of Electronics,
Electrical Engineering and Computer Science Queen’s University Belfast
William Schuler Department of Linguistics The Ohio State University [email protected]
Abstract
While reading times are often used to measure working memory load, frequency effects (such as surprisal orn-gram frequencies) also have strong confounding effects on reading times. This work uses a naturalistic audio corpus with magnetoencephalographic (MEG) anno-tations to measure working memory load dur-ing sentence processdur-ing. Alpha oscillations in posterior regions of the brain have been found to correlate with working memory load in non-linguistic tasks (Jensen et al., 2002), and the present study extends these findings to working memory load caused by syntactic center embeddings. Moreover, this work finds that frequency effects in naturally-occurring stimuli do not significantly contribute to neu-ral oscillations in any frequency band, which suggests that many modeling claims could be tested on this sort of data even without con-trolling for frequency effects.
1 Introduction
Current accounts of sentence processing (e.g., Gib-son, 2000; Lewis and Vasishth, 2005) usually in-volve working memory: parts of sentences are stored while unrelated material is processed, then re-trieved when they can be integrated. But evidence for the role of memory in sentence processing usu-ally comes in the form of latency measurements in self-paced reading or eye-tracking data, in which frequency effects are a powerful potential confound (Hale, 2001; Levy, 2008; Demberg and Keller, 2008;
∗Formerly of the Dept. of Machine Learning, Carnegie Mellon University
Roark et al., 2009; Smith and Levy, 2013; van Schijndel et al., 2014). For example, the direction of the correlation between memory load and reading times has been shown to be highly sensitive to com-plex frequency effects (Vasishth and Lewis, 2006; Schuler and van Schijndel, 2014).
Experiments described in this paper therefore at-tempt to find a clearer measure of variable mem-ory usage in sentence processing, independent of frequency influences. In particular, this paper fo-cuses on the coherence of oscillatory neural activity between anterior and posterior areas of left cortex. Areas including the left inferior frontal gyrus and the posterior left temporal cortex have been impli-cated in language use, especially passive listening tasks (Hagoort and Indefrey, 2014). Synchronous firing among neurons in disparate parts of the brain is thought to be a possible mechanism for the for-mation of cued associations in memory by caus-ing rapidly repeated communication between asso-ciation cue neurons and assoasso-ciation target neurons, which strengthens their connection through a pro-cess of long-term potentiation (von der Malsburg, 1995; Singer, 1999; Sederberg et al., 2003; Jensen et al., 2007; Fell and Axmacher, 2011). During pe-riods of high memory load, synchronous firing in the alpha band is thought to be associated with in-hibition of memory formation so as to protect ex-isting cues from interference (Jensen et al., 2002; Jensen et al., 2007). If this is correct, we should ex-pect to find high alpha power and coherence among brain regions responsible for language use when lan-guage users are processing center embedded text (e.g., the bracketed text in ‘The reporter [the senator
met] left’). Magnetoencephalographic (MEG) imag-ing results reported in this paper show that this does indeed seem to be the case. Exploratory analyses with the development partition of a dataset of MEG recordings of subjects listening to narrative text re-vealed a strong effect for memory load on alpha-band coherence between an anterior and posterior pair of left-hemisphere sensors. Follow-on valida-tion with a larger test partivalida-tion confirmed the signif-icance of this effect. Moreover, these effects could not be explained by frequency or sentence position predictors, unlike effects on self-paced reading and eye-tracking latencies (Demberg and Keller, 2008; Roark et al., 2009; Wu et al., 2010).
The remainder of this paper is organized as fol-lows: Section 2 provides a brief introduction to magnetoencephalography, Section 3 describes the MEG dataset used in these experiments, Section 4 describes the oscillatory coherence measure used to evaluate phase-aligned activation, Section 5 de-scribes the center-embedding depth predictor, Sec-tion 6 describes the regression experiments and their results, and Section 7 discusses implications of these results for some open debates about hierarchic sen-tence processing.
2 MEG Background
Magnetoencephalography (MEG), like electroen-cephalography (EEG), is a non-invasive means to record the electrical activity of the brain, specifically the aggregate of post-synaptic potentials produced by individual neurons. MEG has certain advan-tages over EEG, which is the most widely used neu-roimaging technique in psycholinguistics, due to its low cost, convenience and portability. While EEG’s high temporal resolution (100Hz) makes it suit-able for examining the neural processing timeline down to the level of individual words and phonemes, its spatial resolution does not compare to other tech-niques like fMRI (functional magnetic resonance imaging). In addition, the signals recorded with EEG (volume currents) are distorted as they pass through the skull and tissues of the head, attenuating higher frequencies, and blurring their spatial source. MEG records magnetic fields from the same neu-ral sources that generate the EEG-visible voltages at the scalp. As the head is transparent to
mag-netic fields, MEG signals are less noisy, have finer spatial resolution, and capture a wider range of fre-quencies. The EEG signal components familiar to psycholinguists (e.g., the N400 and P600) are also visible but produce different scalp distributions in MEG recordings (Pylkk¨anen and Marantz, 2003; Salmelin, 2007; Service et al., 2007), because of dif-fering spatial sensitivities: EEG and MEG are more sensitive to radial and tangential sources respec-tively, and MEG’s higher spatial resolution means that it is not as sensitive to deep sources. And cor-respondingly, any magnetic coherence between two sensors can be more reliably traced to coherence be-tween the two corresponding regions of the brain, whereas the poor spatial resolution of EEG means that coherence between sensors does not necessarily reflect coherence between the corresponding regions of the brain.
3 Data Collection
This study makes use of a naturalistic audio-book listening task during MEG recording. This de-sign allows us to examine language processing in a more ecologically realistic manner (Brennan et al., 2012; Wehbe et al., 2014a; Wehbe et al., 2014b), as both the participant experience (reading/listening to a story for enjoyment) and author’s aim are authentic language acts.
Participants were asked to sit still in an upright position with their eyes closed, while they listened to an 80-minute excerpt of an English-language novel. The listening task was split into 8 sections of ap-proximately 10 minutes each, and participants had the opportunity to rest between them.
The text used was the second chapter of the novel Heart of Darkness by Joseph Conrad, con-taining 628 sentences and 12,342 word tokens. The plain-text and audio book recording used were both sourced from the Gutenberg project.1
The data was recorded at 1000Hz on a 306-channel Elekta Neuromag device at the UPMC MEG Brain Mapping Center, Pittsburgh, USA. Dur-ing the experiment, the audio track was recorded in parallel to enable subsequent synchronization be-tween the brain activity and audio-book content.
1http://www.gutenberg.org/cache/epub/219/pg219.txt;
The 306 channels are distributed across 102 loca-tions in the device helmet. Each position has a magnetometer which measures the magnitude of the magnetic flux entering or leaving the helmet at that location. The two gradiometers measure gradients in local flux (i.e. its first derivative), each in a direction perpendicular to the other.
Informed consent was obtained from 3 healthy right-handed participants, following ethical approval provided by the Institutional Review Boards of both the University of Pittsburgh, and Carnegie Mellon University.
After recording, the MEG data was preprocessed in the following way to normalize and clean the signals. The Elekta custom MaxFilter software was used to apply SSP, SSS and tSSS methods (Taulu and Hari, 2009), correcting for head motion on a run-wise basis, and removing signal compo-nents which originated outside the recording hel-met and other non-brain artefacts. The EEGlab package was then used to apply a band-pass filter between 0.01–50 Hz, down-sample to 125Hz, and apply Independent Components Analysis (Delorme and Makeig, 2003). The signal time-courses and component scalp-maps were visually inspected for eye-movement and line-noise components, but none were identified.
The parallel audio recording channel was used to identify the precise sample points at which each of the 8 audio runs began and ended (these var-ied as participants chose to take breaks of differ-ent lengths). The eight excerpts were then spliced together to form a continuous set of MEG signals corresponding exactly to the complete audio-book time-course. This allowed us to use speech recog-nition forced alignment methods (MS HTK; Wood-land et al., 1994) to precisely locate the onset and offset times of each auditory word. These auto-matically derived onset and offset times were sub-sequently validated by hand.
4 Coherence
There are a variety of measures available that reflect the connectivity between two brain regions. This study makes use of ‘spectral coherence,’ which is sensitive both to power/energy increases registered by the relevant sensors and to the degree of phase
synchronization observed by those sensors. Spectral coherence is computed with the following formula:
coherence(x, y) = p E[Sxy]
E[Sxx]·E[Syy] (1) wherexandy are waveform signals from two sen-sors, andSij is the spectral density of waveformsi andj. Wheni= j,S is the power spectral density ofi, and wheni6=j,Sis the cross-spectral density betweeniandj. The expectations in the numerator and the denominator must be obtained by averaging over multiple frequency bands, multiple instances of the same frequency band in different epochs, or over both frequency bands and epochs.2 The present work adopts the second approach of averaging each frequency band over multiple epochs (see Section 6 for details), which enables higher frequency resolu-tion than if multiple frequencies had been averaged together, though it necessarily reduces the number of trials in the dataset. This work uses the MNE-python package to compute spectral coherence (Gramfort et al., 2013; Gramfort et al., 2014).3
As a measure of the correlation between two sig-nals, coherence can be between 0 and 1. When two signals have a constant phase difference and are of the same amplitude, their coherence is 1. As ei-ther the amplitudes diverge or the phase difference changes, the coherence approaches 0.
5 Center Embedding Depth
This study evaluates a measure of syntactic work-ing memory load as a predictor of MEG coherence. A canonical means of calculating syntactic working memory load is to count the number of center em-beddings in a sentence. For example, the sentence in Figure 1, ‘The cart that the horse that the man bought pulled broke,’ is thought to induce greater working memory load than the same sentence with-out the depth 3 region: ‘The cart that the horse pulled broke,’ (Chomsky and Miller, 1963).4 The in-creased memory load stems from an incomplete de-pendency (a subject lacking a predicate in the above 2If multiple instances are not averaged in Equation 1,
coher-ence is simply 1 (Benignus, 1969).
3http://martinos.org/mne/stable/mne-python.html
4In fact, this is an example ofself embedding, the most
d1The cart broke.
d2 that the horse pulled
d3 that the man bought
Figure 1: Center embeddings in ‘The cart that the horse that the man bought pulled broke.’ Each lexeme is asso-ciated with the given embedding depth on the left.
example) that must be retained in working mem-ory until the dependency can be completed (Gibson, 2000). The load should increase every time there is a right branch from a left branch in a syntactic binary-branching tree.5
Experiments described in this paper estimate syn-tactic memory load when processing a particular word of a sentence as the center-embedding depth of that word, which is the number of incomplete categories maintained while processing that word using a left-corner parser (Aho and Ullman, 1972; Johnson-Laird, 1983; Abney and Johnson, 1991; Gibson, 1991; Resnik, 1992; Stabler, 1994). To ob-tain an accurate estimate of center-embedding depth, this study uses the van Schijndel et al. (2013) left-corner PCFG parser trained on the Penn Treebank (Marcus et al., 1993) reannotated into a Nguyen et al. (2012) generalized categorial grammar (GCG),6 which makes PCFG probabilities sensitive to filler-gap propagation. This parser achieves a linguis-tic accuracy comparable to the Petrov and Klein (2007) parser, and the PCFG surprisal estimates it outputs using this grammar provide a state-of-the-art fit to psycholinguistic measures like self-paced read-ing times and eye-trackread-ing fixation durations (van Schijndel and Schuler, 2015).
The experiments described in Section 6 run this parser on transcripts of the Heart of Darkness dataset described in Section 3, calculating center-embedding depth for each word epoch based on its position in the best output parse. This parser is also used to calculate PCFG surprisal as a potentially confounding predictor.
5In fact, there are conditions where a post-modifier can
cre-ate a complex left-branching structure that does not cause an associated increase in memory load, but that effect is beyond the scope of this paper.
6http://sourceforge.net/projects/modelblocks/
6 Methodology
In this section we describe how we establish a reli-able effect of sentence embedding depth on alpha-band coherence in the MEG recordings. While our analysis is motivated by experimental results using non-linguistic stimuli (e.g., Jensen et al., 2002), we do not expect the scalp topology of EEG effects to be exactly replicated in MEG recordings, and we do not necessarily expect coherence observations during skilled behavior like sentence comprehen-sion to exactly match observations while processing word lists. This, and the possibility of frequency-based confounds, requires an exploratory analysis of a range of sensor-pairs, frequency bands, and time windows. To avoid the danger of selection biases we partition one third of the data into a development set and the rest of the data into a test set. The devel-opment data gives an indication of which sensor pair best reflects a stable correlation between embedding depth and MEG coherence, which is later confirmed using the test partition.
The van Schijndel et al. (2013) parser is used to obtain estimates of the embedding depth of each word in the corpus according to the best output parse of the sentence. As described in Section 5, these es-timates are used as a measure of the memory load that is present as each word is processed.
em-Figure 2: Top-down depiction of sensor locations in the Elekta Neuromag helmet. The front of the helmet is at the top of the figure. The sensors in blue are those used in this study.
bedding depths. Each depth grouping is further clus-tered into sets of four epochs; these sets are used to calculate the expectations necessary to compute co-herence.7 Continuous wavelet decomposition (Ga-bor, 1946) is employed to decompose the waveform signal recorded by each sensor into its component frequencies.
The memory load of a given epoch should be rel-atively constant throughout the duration of a given word, so the dependent variable tested in this study is the average coherence from 0-500 ms after the onset of each word. If the average coherence of a frequency is high due to a brief spike in coherence during that window rather than due to repeated syn-chronous firing of the neural clusters under investi-gation, the increased variance will penalize the sig-7The choice to cluster into sets of four epochs was driven by
the data. In order to obtain valid statistical significance in the development data regarding embeddings at an embedding depth of one, the data could only be divided by 4 beforendropped below 30. While statistical significance is not needed for ex-ploration, a less-than-representative sample in the development set would negate the purpose of having a development set for exploration.
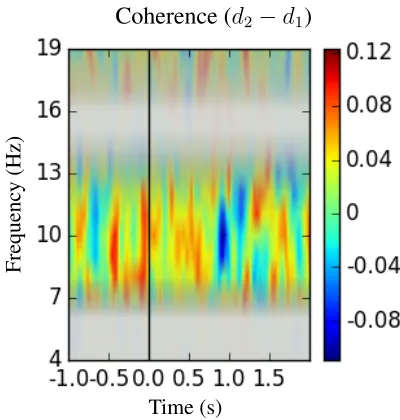
Coherence (d2−d1)
Frequenc
y
(Hz)
[image:5.612.325.525.58.268.2]Time (s)
Figure 3: A time-frequency depiction of the mean coher-ence in the depth = 1 condition subtracted from the mean coherence in the depth = 2 condition in development data. An overlay conveys the variance of different frequency bands. Faded regions have higher variance than clearer regions.
nificance of that frequency. Although this work ini-tially averaged over epochs during computation of coherence in order to obtain good frequency reso-lution, exploration using development data revealed that coherence often appears across several adjacent frequency bands, so to boost the signal-to-noise ra-tio, the dependent variable was recast as the average coherence within ±2 Hz of each frequency band. Since this study is focused on linguistic process-ing, the development data was searched for two sen-sors in the anterior and posterior regions of the left hemisphere with a high degree of depth-sensitive al-pha coherence. In analysis of the development set, gradiometer sensors 0132 and 1712 (anterior and posterior sensors, respectively; shown in Figure 2) showed a high coherence, so these were used in the evaluation on the test set. This was the only sensor pair evaluated on the test data.
[image:5.612.77.303.67.307.2]Factor Coef p-value
Unigram 5.1·10−5 0.941
Bigram 5.6·10−4 0.257
Trigram 4.3·10−4 0.073
PCFG Surprisal 2.8·10−4 0.482
Sentence Position −5.1·10−4 0.031
[image:6.612.323.529.56.155.2]Depth 3.6·10−2 0.005
Table 1: Development data results using each factor to predict alpha coherence from 0-500ms at 10±2Hz.
samples. TheU-test is used to see whether the dis-tribution of coherence at a given depth is the same as the distribution of coherence at another depth.
Development analysis finds that the depth 1 data (n= 40) and the depth 2 data (n= 1118) have sig-nificantly different coherence distributions around 10 Hz (p = 0.005; see Figure 3), which is in the middle of the alpha frequency range (8-12Hz). This finding suggests that alpha coherence between these two regions are predictive of linguistic work-ing memory load. To ensure that this findwork-ing was not caused by a single subject, the same analysis was re-peated over the development data after omitting each subject in turn, with similar results.
It may be, however, that these alpha coherence ef-fects are driven by confounding factors like sentence position (alpha coherence may be more likely to oc-cur near the beginnings or ends of sentences) or fre-quency (alpha coherence may tend to increase when processing rare or common words), which may be collinear with depth. In order to check for these possible confounds, the data must be re-ordered by sentence position or frequency predictors, then re-grouped into sets of four before computing coher-ence, in order to avoid computing coherence over unrelated factor levels.8
To rule out the confounds of sentence position and frequency, a variety of independent predictors are separately linearly regressed against the depen-dent variable of coherence. Four different frequency predictors are used: unigrams, bigrams, trigrams, and PCFG surprisal. Then-gram factors are all log-probabilities computed from the Corpus of
Contem-8Since only two values of depth are tested in the present
study, depth is always tested using aU-test, while the more con-tinuous variables are tested using linear regression.
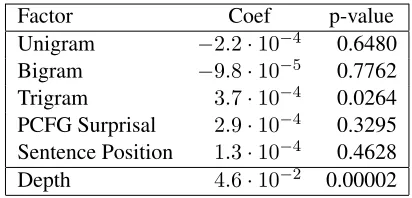
Factor Coef p-value
Unigram −2.2·10−4 0.6480
Bigram −9.8·10−5 0.7762
Trigram 3.7·10−4 0.0264
PCFG Surprisal 2.9·10−4 0.3295
Sentence Position 1.3·10−4 0.4628
Depth 4.6·10−2 0.00002
Table 2: Test data results using each factor to predict al-pha coherence from 0-500ms at 10±2Hz. Note that the trigram factor is not a significant predictor after applying Bonferroni correction.
porary American English (COCA; Davies, 2008) and PCFG surprisal is computed by the van Schijn-del et al. (2013) incremental parser. While sentence position is significant on the development partition (Table 1), none of the frequency-based effects are significant in the development set, but this may be due to having too little data in the development set, so all factors are tested again in the larger test set.9
To retain an α-level of 0.05 with six statistical tests, the threshold for significance must be Bonfer-roni corrected to 0.008. As shown in Table 2, sen-tence position fails to be a significant predictor of al-pha coherence on the test data (even without Bonfer-roni correction), but embedding depth remains a sig-nificant predictor of alpha coherence. The marginal effect of trigram predictability observed in the de-velopment set remains in the test set, but the effect is not significant after correcting for multiple com-parisons.
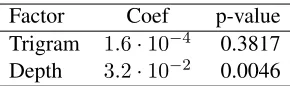
While Bonferroni correction would rule out tri-gram probability as a significant predictor even if it was the only non-depth predictor tested in this work, the fact that it is marginally significant in both datasets is suggestive of a true underlying effect. To determine whether trigram probability is actually predictive of MEG coherence, we increase the reso-lution of the coherence by using six epochs (rather than the previous four) to compute the expectations in Equation 1. The increase in resolution further
9In development testing, ‘significance’ is merely a
[image:6.612.85.289.56.154.2]Factor Coef p-value Trigram 1.6·10−4 0.3817
[image:7.612.113.258.56.99.2]Depth 3.2·10−2 0.0046
Table 3: Test data results after increasing coherence res-olution to six epochs.
shrinks the dataset, but the larger test set can absorb the loss and still provide valid significance results.10 The results (Table 3) show that, with greater coher-ence resolution, embedding depth remains a signif-icant predictor of MEG coherence, and that trigram probability is not even a marginally significant pre-dictor. These results reinforce the theory that alpha coherence reflects memory load and further shows that alpha coherence between the anterior and pos-terior regions of the left hemisphere may specifically reflect linguistic memory load.
7 Discussion
This study found that alpha coherence between the anterior and posterior regions of the left hemisphere of the brain is significantly correlated with embed-ding depth, which suggests that alpha coherence may reflect an effect of memory load on linguis-tic processing in those regions. This correlation was found in an exploratory study using develop-ment data and subsequently confirmed by general-izing to held-out test data. These results are consis-tent with patterns observed in fMRI experiments: a large survey (Hagoort and Indefrey, 2014) identifies activation of the left inferior frontal gyrus (LIFG, in-cluding “Broca’s area”) and posterior parts of the left temporal cortex (including “Wernicke’s area”), during both passive listening and passive reading tasks. Their findings indicate that, with listening tasks in particular, the anterior region of the right hemisphere is also active, and the results of Weiss et al. (2005) suggest that EEG coherence between the left and right hemispheres of the brain increases with embedding depth. Future study is needed to determine if rightside coherence or left-right coher-ence in MEG data is also associated with embedding depth.
Importantly, the alpha coherence found in this 10After increasing coherence resolution, trigramn= 1933,
depth 1n= 57, and depth 2n= 1428.
study did not correlate with sentence position or fre-quency effects. The lack of influence of position and frequency effects on MEG coherence could greatly facilitate future research on sentence processing, since these effects often present large confounds in predicting other psycholinguistic measures. The cost associated with collecting MEG data may limit the immediate widespread application of the present findings, but since MEG and EEG signals are pro-duced by electrical activity from the same under-lying brain sources, this gives hope that anterior-posterior left hemisphere alpha coherence in EEG may be able to provide a similarly clear signal for future studies.
The present data support findings like those of van Schijndel and Schuler (2015), who claim hierarchic structure must be used during linguistic process-ing because hierarchic structure improves the fit to reading times over competitive non-hierarchic mod-els. A potential criticism of that finding is that hu-mans may make use of linear sequences of part-of-speech tags but not hierarchic structure during lin-guistic processing (Frank and Bod, 2011). In that case, the improved fit of the hierarchic grammars in van Schijndel and Schuler (2015) may simply stem from the fact that hierarchic grammars also happen to contain part-of-speech information as well as hi-erarchic structure. The findings of the present study support the theory that hierarchic structure is used during linguistic processing since this study finds a clear effect of alpha coherence conditioned on hier-archic embedding depth.
conditions. That is, it permits direct measurement of whether and how much attentional resources must be expended in cohering disparate regions of the brain in those conditions. Such resource expendi-tures could manifest themselves in reading times in a variety of ways, but the present work has outlined a technique, seemingly independent of frequency ef-fects, of directly testing the underlying theoretical linguistic claims in naturalistic data.
Acknowledgements
Thanks to the anonymous reviewers for their help-ful feedback on this work. Thanks also to Roberto Zamparelli of the University of Trento, for advice on the pilot experimental and analytical design. This material is based upon work supported by the Na-tional Science Foundation Graduate Research Fel-lowship under Grant No. DGE-1343012. Support also came from the University of Pittsburgh Medical Center MEG Seed Fund, and the National Institutes of Health CRCNS grant No. 5R01HD075328-02. Any opinion, findings, and conclusions or recom-mendations expressed in this material are those of the authors and do not necessarily reflect the views of the funders.
References
Steven P. Abney and Mark Johnson. 1991. Memory re-quirements and local ambiguities of parsing strategies.
J. Psycholinguistic Research, 20(3):233–250.
Alfred V. Aho and Jeffery D. Ullman. 1972. The The-ory of Parsing, Translation and Compiling; Volume. I: Parsing. Prentice-Hall, Englewood Cliffs, New Jersey. V. A. Benignus. 1969. Estimation of the coherence spec-trum and its confidence interval using the fast Fourier transform. IEEE Transactions on Audio and Electroa-coustics, 17(2):145–150.
Jonathan Brennan, Yuval Nir, Uri Hasson, Rafael Malach, David J Heeger, and Liina Pylkk¨anen. 2012. Syntactic structure building in the anterior temporal lobe during natural story listening. Brain and Lan-guage, 120(2):163–173.
Noam Chomsky and George A. Miller. 1963. Introduc-tion to the formal analysis of natural languages. In
Handbook of Mathematical Psychology, pages 269– 321. Wiley, New York, NY.
Mark Davies. 2008. The corpus of contemporary ameri-can english: 450 million words, 1990-present.
Arnaud Delorme and Scott Makeig. 2003. EEGLAB: an open source toolbox for analysis of single-trial dynam-ics including independent component analysis. Jour-nal of Neuroscience Methods, 134(1):9–21, mar. Vera Demberg and Frank Keller. 2008. Data from
eye-tracking corpora as evidence for theories of syntactic processing complexity. Cognition, 109(2):193–210. Juergen Fell and Nikolai Axmacher. 2011. The role of
phase synchronization in memory processes. Nature Reviews Neuroscience, 12(2):105–118.
Stefan Frank and Rens Bod. 2011. Insensitivity of the human sentence-processing system to hierarchical structure. Psychological Science.
Dennis Gabor. 1946. Theory of communication.Journal of the IEEE, 93:429–441.
Edward Gibson. 1991. A computational theory of hu-man linguistic processing: Memory limitations and processing breakdown. Ph.D. thesis, Carnegie Mellon. Edward Gibson. 2000. The dependency locality theory: A distance-based theory of linguistic complexity. In
Image, language, brain: Papers from the first mind articulation project symposium, pages 95–126, Cam-bridge, MA. MIT Press.
A. Gramfort, M. Luessi, E. Larson, D. Engemann, D. Strohmeier, C. Brodbeck, R. Goj, M. Jas, T. Brooks, L. Parkkonen, and M. H¨am¨al¨ainen. 2013. MEG and EEG data analysis with MNE-python. Frontiers in Neuroscience, 7:267.
A. Gramfort, M. Luessi, E. Larson, D. Engemann, D. Strohmeier, C. Brodbeck, L. Parkkonen, and M. H¨am¨al¨ainen. 2014. MNE software for processing MEG and EEG data.NeuroImage, 86:446–460. Peter Hagoort and Peter Indefrey. 2014. The
neurobiol-ogy of language beyond single words. Annual Review of Neuroscience, 37:347–362.
Peter Hagoort. 2008. The fractionation of spo-ken language understanding by measuring electrical and magnetic brain signals. Philosophical Trans-actions of the Royal Society B: Biological Sciences, 363(1493):1055–1069, mar.
John Hale. 2001. A probabilistic earley parser as a psycholinguistic model. InProceedings of the second meeting of the North American chapter of the Associ-ation for ComputAssoci-ational Linguistics, pages 159–166, Pittsburgh, PA.
Ole Jensen, Jack Gelfand, John Kounios, and John E. Lis-man. 2002. Oscillations in the alpha band (9–12 hz) increase with memory load during retention in a short-term memory task. Cerebral Cortex.
Philip N. Johnson-Laird. 1983. Mental models: to-wards a cognitive science of language, inference, and consciousness. Harvard University Press, Cambridge, MA, USA.
Roger Levy. 2008. Expectation-based syntactic compre-hension. Cognition, 106(3):1126–1177.
Richard L. Lewis and Shravan Vasishth. 2005. An activation-based model of sentence processing as skilled memory retrieval. Cognitive Science, 29(3):375–419.
Richard L. Lewis, Shravan Vasishth, and Julie A. Van Dyke. 2006. Computational principles of working memory in sentence comprehension. Trends in Cog-nitive Science, 10(10):447–454.
Mitchell P. Marcus, Beatrice Santorini, and Mary Ann Marcinkiewicz. 1993. Building a large annotated cor-pus of English: the Penn Treebank. Computational Linguistics, 19(2):313–330.
Luan Nguyen, Marten van Schijndel, and William Schuler. 2012. Accurate unbounded dependency re-covery using generalized categorial grammars. In
Proceedings of the 24th International Conference on Computational Linguistics (COLING ’12), pages 2125–2140, Mumbai, India.
Slav Petrov and Dan Klein. 2007. Improved infer-ence for unlexicalized parsing. In Proceedings of NAACL HLT 2007, pages 404–411, Rochester, New York, April. Association for Computational Linguis-tics.
Liina Pylkk¨anen and Alec Marantz. 2003. Tracking the time course of word recognition with MEG. Trends in cognitive sciences, 7(5):187–189.
Philip Resnik. 1992. Left-corner parsing and psycho-logical plausibility. InProceedings of COLING, pages 191–197, Nantes, France.
Brian Roark, Asaf Bachrach, Carlos Cardenas, and Christophe Pallier. 2009. Deriving lexical and syn-tactic expectation-based measures for psycholinguistic modeling via incremental top-down parsing. Proceed-ings of the 2009 Conference on Empirical Methods in Natural Langauge Processing, pages 324–333. Riitta Salmelin. 2007. Clinical neurophysiology of
lan-guage: the MEG approach. Clinical neurophysiology : official journal of the International Federation of Clin-ical Neurophysiology, 118(2):237–54, mar.
William Schuler and Marten van Schijndel. 2014. Ef-fects of integration in eye tracking. InTwenty-Seventh Annual CUNY Conference on Human Sentence Pro-cessing, page 207.
Per B Sederberg, Michael J Kahana, Marc W Howard, Elizabeth J Donner, and Joseph R Madsen. 2003. Theta and gamma oscillations during encoding pre-dict subsequent recall. The Journal of Neuroscience, 23(34):10809–10814.
Elisabet Service, P¨aivi Helenius, Sini Maury, and Riitta Salmelin. 2007. Localization of Syntactic and Seman-tic Brain Responses using Magnetoencephalography.
Journal of Cognitive Neuroscience, 19(7):1193–1205. Wolf Singer. 1999. Neuronal synchrony: A versatile code for the definition of relations? Neuron, 24(1):49– 65.
Nathaniel J. Smith and Roger Levy. 2013. The effect of word predictability on reading time is logarithmic.
Cognition, 128:302–319.
Edward Stabler. 1994. The finite connectivity of linguis-tic structure. InPerspectives on Sentence Processing, pages 303–336. Lawrence Erlbaum.
Samu Taulu and Riitta Hari. 2009. Removal of mag-netoencephalographic artifacts with temporal signal-space separation: demonstration with single-trial auditory-evoked responses. Human Brain Mapping, 30:1524–1534.
Marten van Schijndel and William Schuler. 2015. Hi-erarchic syntax improves reading time prediction. In
Proceedings of NAACL-HLT 2015. Association for Computational Linguistics.
Marten van Schijndel, Andy Exley, and William Schuler. 2013. A model of language processing as hierarchic sequential prediction. Topics in Cognitive Science, 5(3):522–540.
Marten van Schijndel, William Schuler, and Peter W Culicover. 2014. Frequency effects in the processing of unbounded dependencies. InProc. of CogSci 2014. Cognitive Science Society.
Shravan Vasishth and Richard L. Lewis. 2006. Argument-head distance and processing complexity: Explaining both locality and antilocality effects. Lan-guage, 82(4):767–794.
Christoph von der Malsburg. 1995. Binding in models of perception and brain function. InCurrent Opinion in Neurobiology, pages 520–526.
Leila Wehbe, Brian Murphy, Partha Talukdar, Alona Fyshe, Aaditya Ramdas, and Tom Mitchell. 2014a. Simultaneously uncovering the patterns of brain re-gions involved in different story reading subprocesses.
PloS one, 9(11):e112575.
Leila Wehbe, Ashish Vaswani, Kevin Knight, and Tom Mitchell. 2014b. Aligning context-based statistical models of language with brain activity during reading. In Proceedings of the 2014 Conference on Empirical Methods in Natural Language Processing. ACL. Sabine Weiss, Horst M. Mueller, Baerbel Schack,
P.C. Woodland, J.J. Odell, V. Valtchev, and S.J. Young. 1994. Large vocabulary continuous speech recog-nition using HTK. In Proceedings of ICASSP ’94. IEEE International Conference on Acoustics, Speech and Signal Processing, volume ii, pages II/125–II/128. IEEE.