Assessment of the Spatial and Temporal Water
Eutrophication for Lake Baiyangdian Based on Integrated
Fuzzy Method
Shuxuan Liang1, Hong Wu1, Hongbo Li2, Yihong Wu2
1
College of Chemistry and Environmental Science, Hebei University, Baoding, China; 2Hebei Provincial Academy of Environmental Science, Shijiazhuan, China.
Email: [email protected]
Received October 29th, 2012; revised November 29th, 2012; accepted December 28th, 2012
ABSTRACT
Water quality evaluation entails both randomness and fuzziness. Considering that water eutrophication evaluation in- volves many indices, different classifications and interval values, fuzzy variable sets theory was developed to Lake Baiyangdian as a study case. Taking reference to eutrophication standard of Chinese lakes and local characteristic of Lake Baiyangdian, eutrophication degree of lake was divided into 8 levels. Total phosphorus, total nitrogen, and CODMn were selected as evaluation indices in this research. Based on the measured data, index feature value matrix of
sample was built. Index weights were determined by means of pure threshold value method. Relative membership de- gree of each index to each classification was calculated with relative difference function model. Then the stability of feature value of classification corresponding was received by the comprehensive calculation with the relative member-ship degree and index weights. The results show that the proposed models are effective tools for generating a set of re-alistic and flexible optimal solutions for complicated water quality evaluation issues. It concluded that the model was reasonable and practical.
Keywords: Eutrophication Evaluation; Fuzzy Method; Spatial Variation; Temporal Variation; Lake Baiyangdian
1. Introduction
Lake Baiyangdian is the largest fresh water lake and natural wetland in north China. The lake plays an impor- tant role in balancing the ecosystem there. It is described as the “Kidney of North China” and serves many envi- ronmental and economic services. The lake area is di- vided into various sizes and shapes by 39 villages, over 3700 ditches and 80 km2 of reeds. The ditches in the lake area are in crisscross patterns. The geographical feature of reed marsh, lotus ponds and fishing villages is unique throughout China. Lotus ponds and boundless reed mar- shes are the special sights of the lake, thus it enjoys the good reputation of “North China Pearl”.
While appearing pristine beauty in parts, Lake Bai- yangdian is under assault from a variety of sources, most notably industrial and domestic wastewater emptied up- stream, the holding back of replenishing waters into re- servoirs by upstream communities, and local fish farming [1,2]. In particular, Lake Baiyangdian has 39 in-lake vil- lages, which are surrounded by water in the lake, and 44 semi-in-lake villages, which are partly surrounded by water in the lake. An estimated 100,000 persons live in
the in-lake villages and another 100,000 persons in the surrounding areas of the lake. The low water level, rotten organic substance underwater, and other factors also led to deterioration of water quality and shrinkage of the lake area in recent years.
nment and local environmental protection bureau for its special location and ecological significance. Actually the lake eutrophication, influenced by many factors, is a ty- pical multi-criteria decision-making.
As an important basic research subject, building ap- propriate model and accurately evaluating the eutrophi- cation degree is the basis and premise for the control of lake eutrophication [5]. Eutrophication evaluation is such a problem that involves different indices, many classifi-cations and interval values. During eutrophication eva- luation, the evaluative result of each index is always in- compatible and independent. And directly basing on the evaluation of one index will cause information omission and even wrong result [6].
In the frame of the present work, a study was perform- ed for select certain evaluation indices and mathematic method. Different methods had been evaluated the water quality [7-9]. Fuzzy synthetic evaluation is a modified and corrected version of conventional synthetic evalua- tion [10,11]. The fuzzy evaluation is given in accordance with the evaluation criteria and themeasured values to evaluate the fuzzy transformation of things in a way. Fuzzy variable evaluation method can effctively deal with the influence of evaluation standard interval values and set up the comprehensive evaluation model to fulfill the comprehensive evaluation to water environment [12, 13].
The aim of this paper is to explore the use of fuzzy classification to eutrophication modelling in Lake Bai-
data. This evaluation aimed to ascertain the eutrophica- tion problems and then to improve the measures of com- prehensive treatment for Baiyangdian.
2. Objectives and Method
2.1. Study Area
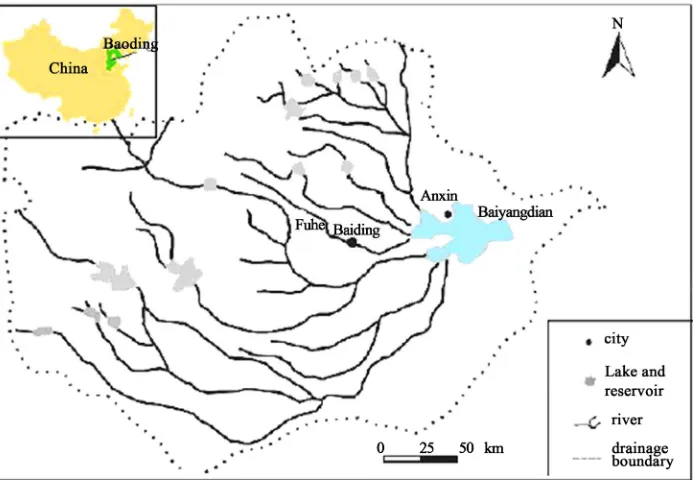
[image:2.595.126.473.478.718.2]The study area is located in Hebei Province (38.850˚N, 116.000˚E). This shallow lake is disk-shaped with sur- face area 366 km2 and water depth 1 - 2 m. The lake lies in the middle reaches of the Daqinghe River basin and ultimately discharges into the Bohai Gulf, Yellow Sea. Much of the upstream catchment totaling 31,500 km2 lies within Baoding municipality. While nine rivers and/or channels flow into Lake Baiyangdian, only two have re- gular but decreasing flows, namely, Fuhe and Juma River [14]. Water systems of Baiyangdian area was shown in
Figure 1.
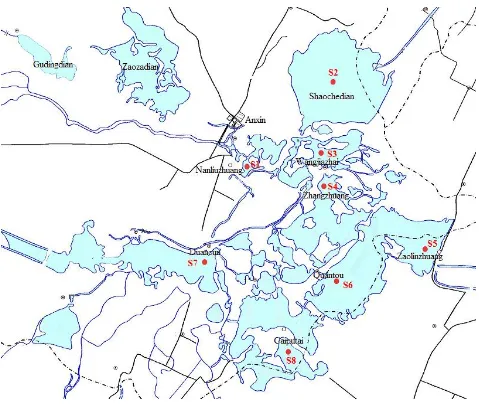
2.2. Sampling Points and Monitoring Data
The monitoring study was carried out with water sam- ples. Eight water-quality sampling sites were established. Sampling sites in Lake Baiyangdian were shown in Fig- ure 2.
The monitoring data were collected including CODMn,
TP, TN concentrations every month from 1996 to 2008. The spatial-temporal eutrophication characteristic analy- sis will be helpful to watershed management.
Figure 2. Distribution of sampling sites in research area.
2.3. Evaluation Method
2.3.1. Fuzzy Evaluation Method
The fuzzy evaluation includes the following steps [15]. 1) Set the collection of the factors U = {U1,U2,U3, , Un}, where U is the measured values of the evaluation factors;
2) Set the collection of the evaluation standard V= {V1, V2, V3, , Vn}, where V is corresponded to the pollution of the water quality standard classification;
3) Determine index weight A; 4) Determine fuzzy matrix R;
5) Calculate evaluation matrix B and get a result.
2.3.2. Evaluation Standard
Select the major pollution factors total phosphorus (TP), total nitrogen (TN), CODMn as an evaluation to determine
the collection of the factors U = {UTP, UTN, UCOD}, and in
accordance with the water quality data of the year 1996
to 2008.
Based on the accepted method and actual feature, eva- luation standard was classified into eight levels and listed in Table 1. Determine the evaluation standard V={V1, V2,
V3, , V8}.
2.3.3. Index Weight A Determination
At present, there are many methods to calculate the weight of pollution factors, such as entropy value method, equal weight method and pure threshold value method. In this work, standard assignment method was chosen. It is calculated by the following method.
Ai =
i i
i i
X S X S
where Ai is the weight of the pollution factors i; Si is the
arithmetic mean of the i kinds of all the standard; and Xi
Level Eutrophic
classification TP (mg/L) TN (mg/L)
CODMn
(mg/L) 1 Oligotrophic 0 - 0.0046 0 - 0.30 0 - 0.48
2 Mesotrophic 0.0046 - 0.010 0.30 - 0.60 0.48 - 0.96 3 Lower-eutrophic 0.010 - 0.023 0.60 - 1.00 0.96 - 1.80
4 Eutrophic 0.023 - 0.050 1.00 - 1.50 1.80 - 3.60 5 Upper-eutrophic 0.050 - 0.11 1.50 - 2.00 3.60 - 7.10
6 Seriously
eutrophic 0.11 - 0.25 2.00 - 3.00 7.10 - 14.0 7 Hyper1eutrophic 0.25 - 0.55 3.00 - 4.60 14.0 - 27.0
8 Seriously
hyper-eutrophic 0.55 - 1.20 4.60 - 10.0 27.0 - 54.0
Then A = {ATP, ATN, ACOD}.
2.3.4. Comprehensive Relative Membership Degree Determination
Comprehensive relative membership degree was gotten as follows. 1 1 1 1 0
When 1,
1 i
i i j
i j i
ij ij i i j
i j ij
i ij
X S
S X
j r S X S
S S X S
1 , 1
1 1 1 1 1 1
When 2, 3 1
0 i i j i i j
i i j
ij i j i ij
ij i j
i j i
ij i i j
i j ij
j n
X S X S
X S
r S
S S
S X
S X S
S S , X S 1 1 1 1 0
When ,
1
i j
i i j
ij i j i ij
ij i j
i ij
Xi S
X S
j n r S X S
S S X S
where j is the level of pollution; Xi is the first i in the
environment of pollutants measured values; Sij is the
kinds of pollutants that the first i-level for the first j standards values.
2.3.5. Fuzzy Matrix R Determination
Input the data of every year into above membership de-gree determined, then their membership and the fuzzy evaluation matrix R were established.
21 22 23 24
31 32 33 34 Mn
R r r r r TN
r r r r COD
2.3.6. Evaluation Matrix B Determination and Get the Result
After establishment of the A and R, the fuzzy compre-hensive evaluation can calculate the matrix B, namely B = AR. According to the principle of the largest degree of membership, if in the matrix B = {b1, b2, , bn} in the
presence bj = max{ b1, b2, , bn}, then the level should
be evaluated for the j-level. The computation use of “∧ and ∨” that is, multiplication getting a lest value then adds getting biggest value.
3. Results and Discussion
3.1. Dominant Pollutants in Lake Baiyangdian
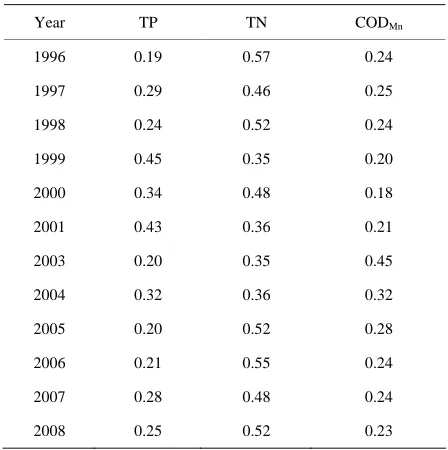
The annual index weights of pollution factors in 1996 to 2008 were determined and listed in Table 2. The index weight results in Table 2 indicated that TN had largest impact in most of year, so TN was the dominant pol- lutants throughout the year for the eutrophication in Bai-yangdian.
3.2. Spatial Change of Water Eutrophication in Lake Baiyangdian
The eutrophic level of all sites in Lake Baiyangdian in 1996 and 2008 was calculated by fuzzy evaluation method separately. Evaluation results were shown in Table 3.
[image:4.595.68.273.386.624.2]Baiyangdian presented significantly regional patterns.
Table 2. Weight of pollution factors.
Year TP TN CODMn
1996 0.19 0.57 0.24
1997 0.29 0.46 0.25
1998 0.24 0.52 0.24
1999 0.45 0.35 0.20
2000 0.34 0.48 0.18
2001 0.43 0.36 0.21
2003 0.20 0.35 0.45
2004 0.32 0.36 0.32
2005 0.20 0.52 0.28
2006 0.21 0.55 0.24
2007 0.28 0.48 0.24
[image:4.595.311.535.512.737.2]Table 3 Evaluation results in different monitoring sites.
Calculation results of matrix B Level Year Site
1 2 3 4 5 6 7 8
1 0 0 0 0 0 0.10 0.24 0.66 8 2 0 0.05 0.15 0.63 0.10 0 0 0 4
3 0 0 0.26 0.44 0.51 0 0 0 5 4 0 0.03 0.42 0.02 0.51 0 0 0 5
5 0.02 0.30 0.10 0.44 0.56 0 0 0 5 6 0 0.36 0.18 0.52 0.26 0 0 0 4
7 0 0 0.45 0.48 0.42 0 0 0 4 1996
8 0 0.35 0.34 0.53 0.47 0 0 0 4
1 0 0 0 0 0.06 0.06 0 0.61 8 2 0 0 0 0.38 0.48 0.42 0 0 5
3 0 0 0.12 0.36 0.5 0.32 0 0 5 4 0 0 0.36 0.36 0.51 0.23 0 0 5
5 0 0 0.30 0.18 0.58 0.40 0 0 5 6 0 0 0 0.42 0.45 0.06 0 0 5
7 0 0 0.09 0.46 0.47 0.09 0 0 5 2008
8 0 0 0.37 0.30 0.51 0.04 0 0 5
Site 1 was the most hypereutrophic site among Baiyang- dian obviously. It was the catchment basin of Fuhe River from Baoding City. Baoding located in the upper reaches of Lake Baiyangdian, discharged 20 t of sewage water by two sewage treatment plants and citizens each day.
Other sites were in eutrophic or upper-eutrophic levels. Ultimately, these sites were in upper-eutrophic according the results of 2008. Water eutrophication in Baiyangdian trended to intensify. Seemingly, this conclusion was not corresponding to the enormous effort to Baiyangdian by government and researchers. The release mechanism of nutrimental salts in shallow lake was more complex. This essential feature of shallow lake determined the hyste- resis of water quality, so sustaining and extending protec- tion steps were essential to Baiyangdian.
Table 4. Evaluation results different water periods of Lake Baiyangdian.
1994 1995 1996 1997 1998 1999 Flat-water
period 6 4 6 6 7 7
Dry-water
period 6 5 6 6 7 6
Wet-water
period 4 4 4 6 6 7
3.3. Temporal Change Chatacter of Water Eutrophication in Lake Baiyangdian
The eutrophic level of Lake Baiyangdian from 1996 to 2008 years was evaluated by above method. The calcula- tion results indicated the eutrophic levels were between level 5 to 7. Baiyangdian was in a state of seriously eu- trophic level during the last decade to now. Actually, many protection and restoration measures have been taken to control the eutrophication. The eutrophic level showed the vulnerability and liability of eutrophication in shallow lakes environment.
3.4. Comparison of Temporal Variation
May, August and October were corresponded to dry- water period, wet-water period and flat-water period re- spectively. The eutrophication status of different water periods from 1996 to 1999 were calculated and the re- sults were shown in Table 4.
The results in Table 4 exhibited the significantly tem- poral variation in Baiyangdian. Eutrophic degrees were changed between Level 4 to Level 7. From Table 4, the lake eutrophication was more serious in the dry period and alleviative in the wet period.
4. Conclusions
It is feasible to evaluate the degree of water eutrophica- tion by this method. We can get a better understanding of the situation of Baiyangdian by calculating the eutrophi- cation of the lake and later provide the basis for the ma- nagement of Baiyangdian.
The degree of eutrophication of Baiyangdian is closely relevant to the factor TN and CODMn, so TN and CODMn
should be studied to improve the situation of Baiyang- dian.
5. Acknowledgements
This work was supported by the National 11th Five-Year Major Science and Technology Projects on Control and Prevention of Water Pollution (2008ZX07209-007).
REFERENCES
[1] W. Wang, X. Q. Tang, S. L. Huang, et al., “Ecological Restoration of Polluted Plain Rivers within the Haihe River Basin in China,” Water Air Soil Pollution, Vol. 211, No. 1-4, 2010, pp. 341-357.
doi:10.1007/s11270-009-0304-5
[2] C. Q. Yin and Z. W. Lan, “The Nutrient Retention by Ecotone Wetlands and Their Modification for Baiyang- dian Lake Restoration,” Water Science and Technology, Vol. 32, No. 3, 1995, pp. 159-167.
[image:5.595.59.284.649.736.2]Study of Behrimaz Stream, Turkey,” Environmental Mo- nitoring and Assessment, Vol. 159, No. 1-4, 2009, pp. 543-553. doi:10.1007/s10661-008-0650-6
[4] K. X. Xing, H. C. Guo, Y. Y. Sun, et al., “Assessment of the Spatial-Temporal Eutrophic Character in the Lake Dianchi,” Journal of Geographical Sciences, Vol. 15, No. 1, 2005, pp. 37-43.
[5] J. J. Berzas Nevado, R. C. Rodríguez Martín-Doimeadios, F. J. Guzmán Bernardo, et al., “Integrated Pollution Eva- luation of the Tagus River in Central Spain,” Environ- mental Monitoring and Assessment, Vol. 156, No. 1-4, 2009, pp. 461-477. doi:10.1007/s10661-008-0498-9 [6] Z. Z. Li, “The Multiple Objective Fuzzy-Grey Method for
Regional Water Quality Assessment,” International Jour- nal of Hydroelectric Energy, Vol. 15, No. 4, 1997, pp. 35- 40.
[7] M. Karydis, “Quantitative Assessment of Eutrophication: A Scoring System for Characterizing Water Quality in Coastal Marine Ecosystems,” Environmental Monitoring and Assessment, Vol. 41, No. 3, 1996, pp. 233-246. doi:10.1007/BF00419744
[8] A. Morihiro, A. Outoski, T. Kawai, et al., “Application of Modified Carlson’s Trophic State Index to Japanese Lakes and Its Relationship to Other Parameters Related to Trophic State,” Research Report on National Institute of Environmental Studies, Vol. 23, No. 1, 1981, pp. 12-30.
[9] A. Islam, S. Mozafar and M. G. Kelly, “Evaluation of the
2007, pp. 165-173. doi:10.1007/s10750-007-0736-0 [10] R. S. Lu, S. L. Lo and J. Y. Hu, “Analysis of Reservoir
Water Quality Using Fuzzy Synthetic Evaluation,” Sto-chastic Environmental Research and Risk Assessment, Vol. 13, No. 5, 1999, pp. 327-336.
doi:10.1007/s004770050054
[11] H. Kung, L. Ying and Y. C. Liu, “A Complementary Tool to Water Quality Index: Fuzzy Clustering Analysis,” Wa-ter Resources Bulletin, Vol. 28, No. 3, 1992, pp. 525-533. doi:10.1111/j.1752-1688.1992.tb03174.x
[12] W. J. Xu, W. G. Chen and X. P. Zhang, “Fuzzy Variable Model for Eutrophication Evaluation and Sustainable Development Countermeasure,” Journal of American Sci- ence, Vol. 4, No. 3, 2008, pp. 11-17.
[13] Q. W. Chen, M. C. Yenory, H. Li, et al., “Hydroinfor- matics Techniques in Eco-Environmental Modelling and Management,” Journal of Hydroinformatics, Vol. 8, No. 4, 2006, pp. 297-316. doi:10.2166/hydro.2006.011 [14] C. L. Liu, G. D. Xie and Y. Xiao, “Impact of Climatic
Change on Baiyangdian Wetland,” Resource and environ- ment in the Yangtze basin, Vol. 16, No. 2, 2007, pp. 245- 250.