Reflection-mode scanning near-field optical microscopy: Influence
of sample type, tip shape, and polarization of light
C. Durkana) and I. V. Shvets
Department of Physics, Trinity College, Dublin 2, Ireland
~Received 3 February 1997; accepted for publication 28 October 1997!
A reflection-mode aperture-type scanning near-field optical microscope ~R-SNOM! based on the
external collection of the reflected light is presented. The light detection is based on an elliptical mirror setup, with the tip and sample at one focus, and a photomultiplier tube at the other. Results are presented on the general imaging properties of this microscope. The results presented concentrate on an analysis of the gap-width dependence of the optical signal, on resolution and on the contrast mechanisms which may be used in R-SNOM imaging, including reflectivity,
polarization/magneto-optics, and topographic effects. © 1998 American Institute of Physics.
@S0021-8979~98!09503-6#
I. INTRODUCTION
Many advances have been made in the area of scanning
near-field optical microscopy ~SNOM! over the past
decade.1–3The principle of this technique is to scan a sub-wavelength sized light source above a sample at a height of a few nm. By collecting the light transmitted through the sample or reflected from it, an optical image of the sample may be obtained where the resolution is determined by the source size and the source-sample separation, rather than the wavelength, as is the case in conventional far-field micros-copy. Typically, this source consists of an aperture of dimen-sions less than 150 nm in a tapered and metal-coated optical fiber. The high divergence of light in the aperture region requires the use of an accurate method of controlling the
tip-sample separation ~gap width!. A technique called
shear-force4–6is often used for this purpose. Consequently, it is possible to record the sample surface topography simulta-neously with the optical information. The two may then be compared in order to elucidate any purely optical informa-tion about the sample. This is an important step, as there is usually a strong correlation between topography and optical images in SNOM. However, the shear-force mechanism is chemically sensitive,7,8hence there may be variations in the tip-sample separation when imaging samples consisting of a mixture of materials. This may result in an artificial contrast in SNOM images due to the strong gap-width dependence of the optical signal, which is analyzed in Sec. II. In this paper, we present results of the study of the imaging mechanisms of R-SNOM, starting with an analysis of the gap-width depen-dence of the optical signal used for generating images. We then show some effects of the sample type, tip shape, and polarization of the emitted light. It is known that SNOM imaging with a distance regulation mechanism, of samples containing topographic variations leads to artefacts in imag-ing where the resolution is due mainly to couplimag-ing between
the optical signal and topography.9,10 For this reason, we
present results on several different contrast mechanisms. We will return to this point in Sec. III.
II. EXPERIMENT
A. Setup
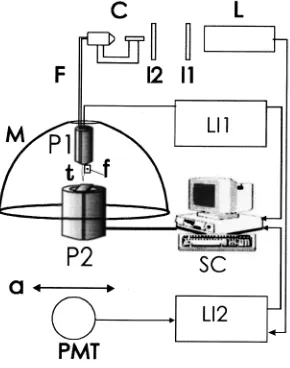
The experimental setup is shown in Fig. 1. The fiber tips which are produced with an in-house developed
computer-controlled pulling machine11are coated with 50–150 nm of
aluminum in such a way as to leave an aperture at the tip apex. It should be mentioned at this point that the thickness,
t, on a fiber tip is related to the thickness, d, as detected on
a thickness monitor by t5(d/p)cosa, whereais the angle between the normal to the tip axis and the evaporation source.
Distance regulation for maintaining a constant tip-sample separation is based on shear force, and the scheme is described elsewhere.7The sensitivity of the detection scheme is typically a few angstroms both laterally and vertically.
Light from a 10 mW diode laser operating at 635 nm and electronically modulated at 5 kHz is coupled into the cleaved end of the fiber. The optical signal for R-SNOM is collected with an elliptical mirror which is coaxial with the fiber tip. The tip and sample are located at one focus of the mirror. This enables the collection of the reflected light from a com-plete solid angle of 2p/3. The collection symmetry helps to reduce shadowing effects, which are of paramount impor-tance in R-SNOM. This arrangement has been found to be superior to the situation where a single objective collects the reflected light.12 The collected light is then detected with a
photomultiplier tube ~PMT! located at the second focus of
the mirror. Lock-in detection is then used to enhance the signal-to-noise ratio~SNR!of the detected signal. With this scheme, a SNR of a few hundred is readily achieved.
B. Gap-width dependence of the optical signal
As ~R-!SNOM images are generated by measuring the
detected optical signal at each image point, it is essential to have an understanding of the signal characteristics, particu-larly with respect to tip-sample distance, which we refer to as the gap width. For R-SNOM, the typical detected optical signal level is 0.1–1 nW, for 1–10 mW of power coupled into the fiber. This corresponds to a transmission through the tips and subsequent detection efficiency of the order 1026. On monitoring the signal due to the light transmitted through
the tip and subsequently reflected from the sample while the tip is being approached to the sample, interference oscilla-tions are clearly seen, as shown in Fig. 2~a!. Here, the period is aboutl/2 with the first maximum at a gap width of about
l/4. The slight change in spacing between maxima shown
here is primarily due to nonlinearity of the PZT piezotube. These oscillations are due to interference between light emit-ted from the tip and light reflecemit-ted from the sample. Two points are most important for the analysis of such a curve: the position of the first maximum and the period of the os-cillations.
These two characteristics depend primarily on the fol-lowing factors:~1!the distance of the optical aperture from
the sample at shear-force contact ~typically 5–10 nm from
actual contact!. This depends on the length of protrusions, generally grains in the metal coating at the tip apex which act as shear-force sensors, as these protrusions come into the point of shear-force contact when the optical aperture is still
some distance away from the surface and ~2! the angular
dependence of the light emitted from the tip. It has already been demonstrated that the far-field emission pattern of a
SNOM tip depends on the aperture size.13 A large aperture
will have a narrower angular emission pattern than a small one. This can be readily understood from Fourier optics.14A small aperture contains higher spatial frequencies, and hence a broader angular spectrum than a large one. Hence, the an-gular range of emission will be different for different tips, and a consequence of this is that different tips will exhibit different characteristics in the gap-width dependence of op-tical approach curves. A detector oriented at a given angle,u to the tip axis will observe a maxima spacing of (l/2 cosu) for the case of one reflection from the sample. We have observed the position of the first maximum in the range of
gap width from l/4 to 3l/4, and the spacing between
maxima in the range l/1.6 –l/2.
The detected signal is a superposition between light emitted at all angles to the tip axis. By considering this sig-nal as the integral of the intensity due to the interference between coherent point sources of light, i.e., two orthogonal dipoles in the aperture plane13and their image in the sample
@Fig. 2~c!#, as a function of the detection solid angle for different gap widths, then the overall detected signal still shows interference behavior. This is illustrated in Fig. 2~c!, which shows the sum of the calculated signal, summed over u530° – 90°~90° corresponding to the plane of the sample!, and for all azimuths corresponding approximately to the measurable angle in our setup, and for the gap width varying from 0 to 3.3mm. Also shown is the calculated signal at 30°. This is assuming that all points in the calculation are equi-distant from the tip-sample junction. Figure 2~b! shows a typical reflection approach curve measured with an objective of NA50.2 at 30° to the tip-sample axis. There is reasonable qualitative agreement with the measured curve. One result of this simple model is that as the aperture size decreases and its angular spread increases, the period of the observed maxima should decrease. This fits well with our observa-tions.
The optical signal at shear-force contact is generally 20%–30% of the value at a gap width of a few microns.
Between gap widths from contact to about l/4 there is a
[image:2.612.106.251.35.219.2]steep increase in the optical signal which is only partially explained by the model presented earlier. Shadowing of the reflected light by the tip itself necessarily plays a major role. Simultaneous observation of the transmitted light shows no such decrease, and the signal consists of a simple interfer-ence pattern, of periodl/2. From the analysis of such optical approach curves as shown here, it can be deduced that at shear-force contact, if the tip-sample separation varies by as little as 1 nm, then the detected optical signal~intensity!can vary by up to a few percent. The exact value depends on the tip shape and the aperture size. For many samples of practi-cal interest this is of at least the same order as the optipracti-cal contrast in the sample. Hence, it is essential to be able to FIG. 1. Schematic of the experimental setup. P1: shear-force dither piezo,
P2: sample scanner piezo, t: fiber tip, f: shear-force detector, F: optical fiber, C: laser coupler, L: laser, L11, L12: lock-in amplifiers, M: elliptical mirror, a: polarization analyzer, l/2 andl/4: wave plates, PMT: photomultiplier tube, SC: scan control unit and data acquisition.
[image:2.612.54.294.507.685.2]maintain the tip-sample separation constant to greater than a few angstroms. We shall return to this point in Sec. III B. It should be noted at this point that the corresponding change in the transmitted optical signal due to gap-width variations is almost an order of magnitude less than for reflection.
From considering the aperture as a combination of radi-ating dipoles, and the detected optical signal as a superposi-tion between this and image dipoles in the sample, it may be seen that the majority of light is reflected in a lobe along the tip axis once the gap width decreases below l/2. The pres-ence of the tip blocks this light from reaching the detector, and hence the detected optical signal for this arrangement is at least an order of magnitude less than for transmission-mode SNOM.
III. IMAGING WITH R-SNOM
In this section, we deal with the results of imaging dif-ferent types of samples with the microscope. We initially show that R-SNOM is highly sensitive to the sample topog-raphy. We then proceed to demonstrate reflectivity and po-larization contrast. We finally demonstrate that it is possible to obtain high-resolution images of samples containing opti-cal contrast without any associated topography.
A. Topographic samples
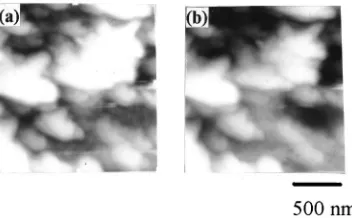
Figure 3 shows shear force and R-SNOM images of an aluminum film, sputtered onto a glass substrate, and of mean roughness 60–100 nm. Here, there is a 1:1 correspondence between the optical and shear-force images. Features as small as 40 nm are clearly resolved in the R-SNOM image. The origin of this ‘‘optical contrast’’ has three sources: ~1! the shear-force sensor and the optical aperture are generally not at exactly the same location on the tip: the shear-force sensor is typically a protrusion in the metal coating forming the rim surrounding the aperture. Hence, as the tip scans across a nonflat sample, while the shear-force control main-tains a constant separation between the tip and sample, the distance from the aperture to the sample will not be constant. Also, while scanning across samples containing significant topography, the point on the tip acting as a shear-force sen-sor will shift. With a 3%/nm variation in optical intensity, it is possible to get a large contrast, and ~2!the tip shadows a large portion of the reflected light. As the tip scans across the sample, protrusions will help scatter light away from the tip, and hence appear bright, whereas depressions ‘‘focus’’ light
onto the end of the tip, increasing the shadowing and hence depressions appear dark. This is illustrated in Fig. 4. This is a gross simplification as ray optics do not hold on to such a small scale, but this is nonetheless an intuitive way of ex-plaining the results and is consistent with our observations on numerous samples, ~3!there will be variations in reflec-tivity across the sample, due to the different angles of inci-dence. This is a pure optical contrast and will also contribute to the image. However, on that basis, it should be expected that the brightest parts of the image should correspond to the sides of topographic hills and valleys, rather than the top as is observed here. The primary origin of the imaging mecha-nism therefore is point 1, as illustrated in Fig. 5. Light is not completely confined in the vicinity of the SNOM aperture. There are propagating waves transmitted through the aper-ture which are not confined belowl/2. The overall confine-ment of energy in the aperture vicinity is due to a sum of propagating and nonpropagating waves. As a protrusion on the tip follows the surface topography faithfully, even though the aperture to sample separation may remain constant
~which is not very likely! the mean distance between the
diffraction-limited propagating waves and the sample varies. Hence, the SNOM is acting as an interferometer and the resolution is determined more by the topography than the aperture size. An obvious way to overcome this problem is to
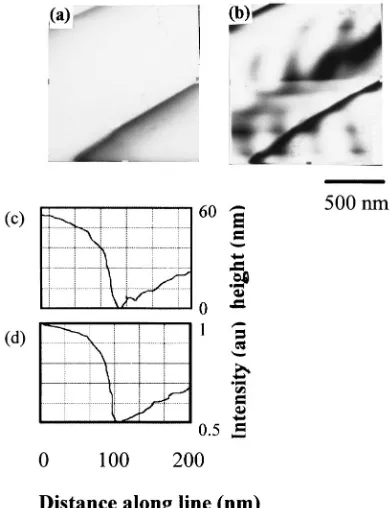
scan at constant height.9,10 Figure 6 shows two SNOM
[image:3.612.381.495.30.103.2]im-ages of a carbon test grating of a period of 460 nm, groove width 80–100 nm, and groove depth of 40–80 nm. Figure 6~a!was obtained using shear-force feedback, and Fig. 6~b! without any feedback, at a gap width close to actual contact. These images were taken using two different tips, hence the difference in contrast. It can be seen that the resolution of Fig. 6~b!is below 100 nm. The rest of the results presented here were obtained using shear-force distance regulation. FIG. 3.~a!and~b!shear force and R-SNOM images of aluminum film. Scan
[image:3.612.86.262.33.142.2]size51.6mm31.6mm.
FIG. 4. Illustration of effect of topography on light emitted from aperture.
[image:3.612.337.543.627.684.2]B. Samples containing topography and optical contrast
[image:4.612.338.533.35.289.2]1. Reflectivity contrast
Figure 7 shows shear force and R-SNOM images of an
e-beam etched chromium test pattern of height 80 nm
fabri-cated on a glass substrate.15For both images, the minimum edge sharpness is of the order 15 nm. This would imply an
aperture diameter of approximately 5–10 nm ~given a skin
depth of approximately 6 nm for aluminum!. It is highly
improbable to obtain such a small aperture size, and it is interesting to note that the resolution apparent in both Figs. 7~a! and 7~b!is identical, which would mean that the force sensor is exactly the same size as the optical aperture. The observed SNOM resolution is mainly due to a topographic coupling with the optical signal and is related to the distance regulation mechanism. As the probe tip scans across the grat-ing, when it is above the glass between two Cr lines, the backreflected light is partially prevented from reaching the detector due to shadowing by the tip itself and the Cr side-walls. This is not the case when the tip is above a Cr line, as the shadowing is purely due to the tip. Essentially, the sample and tip combination prevent light from reaching the detector when the sample contains significant topography variations which the tip follows. Thus, effectively, the reso-lution is enhanced by the strong dependence of the optical signal upon the surface topography through shadowing. It is therefore difficult to know how much contrast to expect for the structure.
The tip shape plays a major role in image formation. This is already indicated by Fig. 7, as both edges of each Cr line are clearly different for both images. For one edge of each line, the measured edge sharpness is about 15 nm, whereas the other edge has a sharpness of about 70 nm. This effect is further illustrated in Fig. 8. This shows shear force and SNOM images of a similar area of the sample as shown in Fig. 7, but with a different tip. The scanning parameters were identical to those for Fig. 7. The tip in this case is so asymmetric that it can now only image one edge of each grating line. At the same time, light leaking from the tip shaft gives rise to the interference pattern along the lines.
2. Polarization contrast
The results of the previous sections show that topo-graphic effects often override true optical contrast, introduc-ing imagintroduc-ing artefacts. For this reason, we now present results of a study of polarization-dependent imaging where we show that for this case, optical effects can be stronger than topo-graphic artefacts.
We have shown elsewhere16that it is possible to distin-guish between light emitted from a SNOM aperture and light leaked from the tip shaft, when imaging metal samples due to the change in polarization of light emitted from the aper-ture on reflection from a metal surface. This change can be rather large ~up to 90°! once the tip-sample separation de-creases to a few nm. In this section we demonstrate polariza-tion dependent imaging of a test grating.
[image:4.612.78.271.35.153.2]It has been shown theoretically that the emission pattern of light from a SNOM aperture depends on its proximity to structures, the effect being much larger for metals than di-electrics; and on the polarization state of the light emitted from the tip.17–19 The origin of these effects is first the matching of electromagnetic boundary conditions at the FIG. 6. SNOM images of gratings ~a! with and ~b! without shear-force
[image:4.612.79.268.588.708.2]feedback, almost at actual contact. Scan sizes are for~a!2mm32mm and ~b!1mm30.6mm.
FIG. 7.~a!and~b!shear force and R-SNOM images of Cr grating on glass. Scan size54mm34mm.
metal/dielectric-air interface and second, the modification of the angular spectrum of the aperture due to the varying op-tical properties of the sample surface.
The sample used for these experiments was a similar region of the e-beam etched sample as shown in Fig. 7. Here,
the width of the metal lines is 1 mm and the gap between
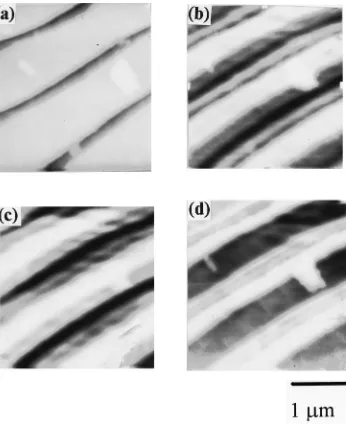
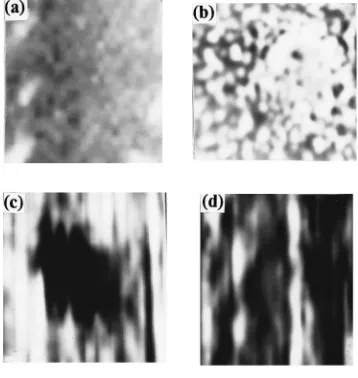
lines is 250 nm. Figure 9 shows shear force and R-SNOM images of this sample. In Figs. 9~b!, 9~c!, and 9~d!, the light emitted from the tip was polarized at 45°, 10°, and 70° to the lines, respectively. No analyzer was used for these experi-ments. There is excellent qualitative agreement between the results here and simulations of similar systems.17 For the case of light polarized parallel to the metal lines, the contrast is high, the resolution is low, and the optical image bears a relatively close resemblance to the object. For the case of the light polarized perpendicular to the lines, the contrast is lower, the resolution is higher, and there is no longer an obvious resemblance of the optical image to the object. Here, the glass between the metal lines is even brighter than the metal lines themselves. These results may be understood by remembering that the far-field emission characteristics of an aperture may be modeled as being due to two dipoles in the plane of the aperture. One electric dipole is along the plane of polarization, and the other, a magnetic dipole of half the strength is along the orthogonal direction. As the tip scans above the glass, between two metal lines, each source dipole in the tip induces image dipoles in the metal strips on either side, as well as weaker ones in the glass below. Any source dipole oriented along the metal lines will induce image di-poles of opposite orientation in the metal, whereas a source dipole perpendicular to the metal induces a dipole of the same orientation. Hence, with the polarization along the lines, the source dipoles are essentially canceled by the effect of their induced dipoles on either side. With the polarization perpendicular to the lines, the source and it’s images
con-structively interfere. The magnitude of the change in signal expected when the polarization switches from one direction to the other depends on the size of the induced dipoles, i.e., on the polarizability of the metal. The experimentally mea-sured intensity increased by almost 50% when the tip was maintained between the lines and the polarization was ro-tated from parallel to perpendicular to the lines. A negligible change was observed for the case of the tip maintained above the center of one of the metal lines while the polarization was rotated. Even dust particles on the glass are now visible, while they were not for the previous case. The bright rims along the metal edges are simply due to the fact that the shadowing by the tip is less efficient when the tip is above a metal line than between two of them. They prove that the emission characteristics of SNOM tips are affected over a long range~here of the order 500 nm!. The asymmetry in the rim dimensions is again due to an asymmetric tip shape.
It is interesting to note that the ‘‘resolution’’ of these images depends on the polarization state of light. This means that the polarization effects are larger than, or at least com-parable to topographic effects, and that the resolution can be ‘‘tuned’’ by varying the polarization state of the emitted light. This may be ruled out as being due to the different degrees of confinement of light along and perpendicular to the polarization direction in the vicinity of the aperture, as the energy is less strongly confined in the direction of polar-ization. Hence, the concept of resolution in SNOM is rather complicated, as it depends on the aperture size, the tip ge-ometry, the surface topography, the polarization state of light, whether or not distance regulation is used, the tip-sample separation, and the tip-tip-sample tilt. Therefore, in order to make any meaningful claims about resolution, samples without any topography should be investigated.
C. Sample containing purely optical contrast
As was explained in previous sections, surface topogra-phy without associated strong optical contrast complicates the issue of resolution in R-SNOM. Several systems contain optical contrast without any associated topography. One of these is single-molecule detection, which has previously
been demonstrated with SNOM;21another is magneto-optics.
Faraday effect SNOM imaging has already been
demonstrated,22but little work has been done to date on Kerr
effect SNOM23,24which is potentially more useful as most
conventional magneto-optic materials are relatively opaque. Here we show that Kerr effect SNOM imaging is indeed possible on flat samples, and with a resolution of 60 nm or more. The sample used for these experiments was a magnetic Co/Pt multilayer25with a series of tracks of prewritten bits of dimension and spacing in the range 400–800 nm, depending on the particular area of the sample. This sample is magne-tized out of plane, and the polar Kerr rotation for normally
incident light at 635 nm is;0.25°. It is known that SNOM
[image:5.612.90.263.35.247.2]fiber tips may reach temperatures of over 500 K26due to the light within the tip being absorbed by the metal coating. As the Curie point of our sample was 650 K, there was the possibility of unintentionally erasing the bit pattern while trying to image it. To avoid this, we coupled the minimum comfortable amount of light into the tip, resulting in a de-tected signal of 1.5 nW. The aperture diameter was of the FIG. 9. ~a!Shear force and~b!,~c!and~d!R-SNOM images of Cr grating
order 50–60 nm. For this signal level, with lock-in detection at a time constant of 10 mS, we had an optical signal-to-noise ratio of 200. This means that a rotation of the polar-ization axis of 0.25° results in a change in the detected opti-cal signal which is of the same value as the noise level, therefore, this is just on the limit of detection. For many magneto-optic recording media, this is just enough to detect a rotation in the polarization state of the reflected light.
The thickness of the metal coating at the tip apex was of the order 60–80 nm, the minimum amount possible for suit-able light confinement, while also minimizing the
depolar-ization of the reflected light. Figure 10 shows MFM ~
mag-netic force microscope!, shear force and R-SNOM images of
a bit on this sample. With shear force, the gap width was regulated at approximately 5 nm. The MFM image is of a bit
of diameter;600 nm, and the R-SNOM images are of a bit
of ;400 nm diameter. The MFM image shows the intrinsic
domain structure of the multilayer, where the characteristic
dimension of the domains is;60 nm. The shear-force image
shows that there is no topography associated with the bit, and the R-SNOM images are taken for two orthogonal states of the analyzer, to demonstrate that this is indeed a magnetic bit. Larger scan areas enabled imaging of the track pattern, and the spacing between bits, their dimension and the orien-tation of the tracks was consistent with that observed with conventional Kerr microscopy. In the R-SNOM image Fig. 10~c!, the domain structure can also be inferred from the roughness of the bit ~the pixel size is 10 nm!. From the optical edge sharpness of the bit, the resolution can be esti-mated at greater than 60 nm. This is a significant step, as to date the only methods for imaging bits/domains on a sub-250 nm scale are electron microscopy either with polarization analysis or the Bitter technique, and MFM. R-SNOM offers a complementary technique for the imaging of magnetic do-mains. This has important consequences for the future, as read heads are approaching the single-domain size, and being
magnetically soft, characterization by MFM is not yet rou-tinely feasible.
IV. CONCLUSIONS
We have presented results on the general imaging prop-erties of reflection-mode SNOM with external collection of the reflected light. We have shown that an understanding of the optical signal used for generating images is important for interpreting images of topographic samples. We have dem-onstrated that several of the contrast mechanisms used in conventional optical microscopy are possible in R-SNOM. There is a strong coupling between topography and the op-tical signal. We have also shown that R-SNOM images de-pend on the tip shape and the polarization state of light. Finally, we demonstrated that it is possible to obtain high resolution images of magnetic bits on a topographically flat magneto-optic sample.
ACKNOWLEDGMENTS
Financial support from DGXII of the Commission of the European Union, Contract ERBCHRX CT 93-0375 is grate-fully acknowledged. The authors also wish to thank B. Hecht for many useful and stimulating discussions on the nature of this work.
1
D. W. Pohl, W. Denk, and U. Du¨rig, Proc. SPIE 565, 56~1985!. 2A. Lewis et al., Biophys. J. 41, 405a~1983!.
3E. Betzig and J. K. Trautman, Science 257, 189~1992!.
4E. Betzig, P. L. Finn, and J. S. Weiner, Appl. Phys. Lett. 60, 2484~1992!. 5
R. Toledo-Crow, P. C. Yang, Y. Chen, and M. Vaez-Iravani, Appl. Phys. Lett. 60, 2957~1992!.
6C. Durkan and I. V. Shvets, J. Appl. Phys. 79, 1219~1996!. 7C. Durkan and I. V. Shvets, J. Appl. Phys. 80, 5659~1996!.
8A. Jalocha, M. H. P. Moers, A. G. T. Ruiter, and N. F. van Hulst, Ultra-microscopy 61, 221~1996!.
9B. Hecht, D. W. Pohl, H. Bielefeldt, L. Novotny, and Y. Inuoye, J. Appl. Phys. 81, 2492~1997!.
10V. Sandoghdar, S. Wegscheider, G. Krausch, and J. Mlynek, J. Appl. Phys. 81, 2499~1997!.
11
I. V. Shvets and S. Madsen, Irish Patent No. S63296~1995!.
12C. Durkan and I. V. Shvets, in Photons and Local Probes, edited by O. Marti and R. Mo¨ller NATO ASI Ser. E: Appl. Sci.~Kluwer, Dordrecht, 1995!, Vol. 300, pp. 145–150.
13
C. Obermuller and K. Karrai, Appl. Phys. Lett. 67, 3408~1995!. 14J. W. Goodman, Introduction to Fourier Optics~McGraw–Hill, London,
1968!.
15Test pattern kindly supplied by I. V. Rangelow and P. Hudek, University of Kassel, Germany.
16
C. Durkan and I. V. Shvets, J. Appl. Phys.~in press!.
17L. Novotny, D. W. Pohl, and P. Regli, J. Opt. Soc. Am. A 11, 1768 ~1994!.
18C. Girard, A. Dereux, and O. J. F. Martin, in Photons and Local Probes, edited by O. Marti and R. Mo¨ller~Kluwer, Dordrecht, 1995!, Vol. 300, p. 1.
19D. Barchiesi and D. van Labeke, in Near-Field Optics, edited by D. W. Pohl and D. Courjon~Kluwer, Dordrecht, 1993!, Vol. 242, p. 179. 20See, for instance, P. Lorrain, D. P. Corson, and F. Lorrain,
Electromag-netic Fields and Waves~Freeman, San Francisco, 1988!. 21E. Betzig and J. Chichester, Science 262, 1422~1993!.
22E. Betzig, J. K. Trautman, J. S. Weiner, T. D. Harris, and R. Wolfe, Appl. Opt. 31, 4563~1992!.
23
T. J. Silva, S. Schultz, and D. Weller, Appl. Phys. Lett. 65, 658~1994!. 24
C. Durkan and I. V. Shvets, Appl. Phys. Lett. 70, 1323~1997!. 25Sample kindly provided by C. Lodder, MESA Research Institute,
Univer-sity of Twente, the Netherlands.
26D. I. Kavaldjiev, R. Toledo-Crow, and M. Vaez-Iravani, Appl. Phys. Lett.
[image:6.612.83.262.36.225.2]67, 2771~1995!. FIG. 10. ~a!Shear force,~b!MFM,~c!and~d!R-SNOM images of