model for a self-humidifying PEM fuel cell
SALEH, Ibrahim, ALI, Rashid and ZHANG, Hongwei
<http://orcid.org/0000-0002-7718-021X>
Available from Sheffield Hallam University Research Archive (SHURA) at:
http://shura.shu.ac.uk/21758/
This document is the author deposited version. You are advised to consult the
publisher's version if you wish to cite from it.
Published version
SALEH, Ibrahim, ALI, Rashid and ZHANG, Hongwei (2018). Experimental testing
and validation of the mathematical model for a self-humidifying PEM fuel cell.
Journal of Materials Science and Chemical Engineering, 6 (4), 202-218.
Copyright and re-use policy
See http://shura.shu.ac.uk/information.html
ISSN Online: 2327-6053 ISSN Print: 2327-6045
DOI: 10.4236/msce.2018.64019 Apr. 30, 2018 202 Journal of Materials Science and Chemical Engineering
Experimental Testing and Validation of the
Mathematical Model for a Self-Humidifying
PEM Fuel Cell
Ibrahim M. Saleh
1*, Rashid Ali
2, Hongwei Zhang
11Materials and Engineering Research Institute, Sheffield Hallam University, Sheffield, UK 2Faculty of Engineering, Environment and Computing, Coventry University, Coventry, UK
Abstract
This paper presents an experimental testing and validation results for a zero-dimensional self-humidifying PEM (Proton Exchange Membrane) fuel cell stack. The model incorporates major electric and thermodynamic vari-ables and parameters involved in the operation of the PEM fuel cell under different operational conditions. The mathematical equations are modelled by using Matlab-Simulink tools in order to simulate the operation of the devel-oped model with a commercially available 1 kW Horizon (H-1000) PEM fuel cell stack, which is used for the purposes of model validation and tuning of the developed model. The model is mathematically modelled and presented in the recent published work of authors. The observations from model simula-tions provide sufficient evidence and support to the results and observasimula-tions obtained from testing 1 kW Horizon (H-1000) PEM fuel cell stack used in this research. The developed model can be used as a generic model and simulation platform for a self-humidifying PEM fuel cell with an output power varying from 50 W to 1 kW, with extrapolation to higher powers is also possible.
Keywords
PEM Fuel Cell, Self-Humidifying, Modelling, Simulation
1. Introduction
A fuel cell is a device which directly converts the energy in the reactants into electricity. The efficiency of energy conversion-production for the fuel cell is comparatively higher than internal combustion engines because there is no in-termediate thermal conversion process similar to the internal combustion en-How to cite this paper: Saleh, I.M. Ali, R.
and Zhang, H.W. (2018) Experimental Testing and Validation of the Mathematical Model for a Self-Humidifying PEM Fuel Cell. Journal of Materials Science and Chemical Engineering, 6, 202-218.
https://doi.org/10.4236/msce.2018.64019
Received: April 10, 2018 Accepted: April 27, 2018 Published: April 30, 2018
Copyright © 2018 by authors and Scientific Research Publishing Inc. This work is licensed under the Creative Commons Attribution International License (CC BY 4.0).
http://creativecommons.org/licenses/by/4.0/
DOI: 10.4236/msce.2018.64019 203 Journal of Materials Science and Chemical Engineering gines or gas turbines [1]. The increasing demand on the electrical energy has re-sulted in an increase in the production which in turn has increased harmful emissions, which is the core of the growing concern of the global warming [2]. The pollutants such as carbon dioxide, nitrous oxides, and sulphur dioxide which are produced from combusting hydrocarbon fuels are eliminated in the case of the fuel cells. Also the absence of intermediate mechanical conversion process makes a fuel cell a quiet device [3].
PEM fuel cells have several features comparing to other types of fuel cells, such as: low corrosion, low weight and compact size, which make them suitable for mobile and stationary applications. The operational temperatures of the PEM fuel cell range between 30˚C - 100˚C, with a dynamical response faster than solid oxide fuel cell which operates at temperatures over 700˚C [4] [5] [6].
A one dimensional isothermal steady-state model for a PEM fuel cell with Nafion117 membrane has been developed [7] to determine the impact of water transport mechanisms on the performance of the fuel cell. [8] Investigated the conductivity of Nafion117 membrane as a function of drawn current densities. While, [1] adopted the model developed by [9] in order to consider the impact of heat transfer between the fuel cell body, gas channels, and cooling water.
A non-linear dynamic model of the PEM fuel cells using electrochemi-cal-thermodynamic and zero-dimensional fluid mechanics principles has been developed [10]. While, [11] developed a non-isothermal one dimensional model of a PEM fuel cell is in order to investigate and examine the impact of the design and operating conditions on the performance of the PEM fuel cell.
A simple dynamic electrical model of a PEM fuel cell has been developed by [12] via extending the static current-voltage behavior of the model to implicit the impact of the temperature on the performance of the fuel cell. [13] Devel-oped a dynamic model of 1.2 kW PEM fuel cells that is used for optimal opera-tional strategies development and to control design of the fuel cell based power systems.
A new dynamic model of 20 cells stack has been proposed [14] to investigate starting up and transient behavior of the model under different conditions of load current, temperature, and coolant flow rate. The impact of temperature and the two phases of water (gas and liquid) in the gas diffusion layer need to be taken into consideration. While, [15] a lumped model of the PEM fuel cells is developed to determine the impact of various operating and design parameters such as: input temperature, pressure, stoichiometric ratio, thickness of mem-brane and gas diffusion layer on the performance of the fuel cell.
A three-dimensional multi-phase fuel cell model has been developed [16] to predict the impact of operating parameters such as operating pressure and tem-perature of the fuel cell, relative humidity of reactant gases, and air stoichiomet-ric ratio on the performance of the PEM fuel cells operates under steady-state conditions. While, [17] a mathematical model of a 750 W PEM fuel cell is de-veloped to predict the behavior of the fuel cells under steady and transient states.
DOI: 10.4236/msce.2018.64019 204 Journal of Materials Science and Chemical Engineering these models estimate the output voltage of the fuel cell for a particular set of operating conditions and some often for a limited dynamic variations. The pro-posed model in this paper presents a simplified zero-dimensional mathematical model for a self-humidifying 1 kW PEM fuel cell developed by modelling the major electric and thermodynamic variables and parameters involved in the op-eration of a PEM fuel cell.
2. Modelling of the PEM Fuel Cell
A simplified mathematical model of the self-humidifying PEM fuel cell is devel-oped by modelling the major electric and thermodynamic variables and pa-rameters, as it was mathematically modelled and presented in the recent pub-lished work of the authors in [18]. Consideration is given to the changes in the environmental conditions, changes in the dynamical properties of the fluids in the supply-return manifolds and inside the anodes and cathodes of the fuel cell stack, properties such as pressure, temperature, and flow rates. Hence, the pro-posed model can determine the impact of: load current, changes in the pressure and temperature of the surroundings, stack operating temperature, water vapour across the membrane, relative humidity in the cathodes and anodes and the wa-ter content in the electrolyte membrane, thickness of the membrane and the size of membrane active area, and the volume of the cathode and anode up on the performance and output power of the fuel cell stack, the usage of pure oxygen or fresh air is considered as well. Thus, this model can be used by the interested re-searchers as a generic model and simulation platform of a self-humidifying PEM fuel cell with an output power varying from 50 W to 1 kW. Moreover, extrapola-tion to higher powers is also possible.
Matlab-Simulink tools is used in order to simulate the operation of the devel-oped model with a commercially available 1 kW Horizon (H-1000) PEM fuel cell stack which is used as an experimental device in running the test physically in order to validate and tune the developed model. The electric and thermody-namic governing equations of the developed model were mathematically mod-elled and used to determine the output voltage of the PEM fuel cell stack as a function to the changes of: fuel cell temperature, water content in the mem-brane, dimensions and volumes of the fuel cell and memmem-brane, drawn current from the cell, and pressure and the flow rates of the hydrogen and oxygen inside the fuel cell, as presented in the previously published work of the authors in [18]. The output voltage of the PEM fuel cell Vfc is subject to various losses, and could be expressed by the following equations.
(
)
fc oc act ohm con
V = ∗n E +V +V +V (1)
(
)
(
)
(
(
2( )
)
)
1 2
3 5
2
1.228 0.85 10 298.15 4.3086 10
oc H O
E = − ∗ − ∗ T− + ∗ − ∗ ⋅T Ln P ⋅ P (2)
(
)
( )
2
1 2 3 6 4
5.08 10 exp 498
O act
P
V T T Ln T Ln I
T
ζ ζ ζ ζ
= + ⋅ + ⋅ ⋅ ∗ ∗ − + ⋅ ⋅
DOI: 10.4236/msce.2018.64019 205 Journal of Materials Science and Chemical Engineering
2.5 2
181.6 1 0.03 0.062 303
303 0.634 3 exp 4.18
fc fc
ohm
fc
fc
I T I
A A
l
V I
A I T
A T λ + + ⋅ = − ⋅ ⋅ − − − ⋅ (4) 3 1 1.5607 4 4 con m
RT i RT
V Ln
F i F
= − −
(5)
where, Eoc represents open circuit voltage of the PEM fuel cell as it has been de-rived previously for a liquid state of water produced by the fuel cell and given by [19]. Vact, Vohm, and Vcon, represent the activation overvoltage, ohmic overvolt-age, and concentration overvoltage of the PEM fuel cell, respectively. n is the number of cells connected in series in the stack. T is stack temperature in Kelvin which is nearly equal to cell temperature. I is the drawn current in Ampere, and
ζn represents the empirical parametric coefficient based on the experimental data, which may vary from one stack to another or cell to another depends on the geometrical design and the materials used in the construction of the PEM fuel cell. Afc is the membrane active area (cm2), and l is the thickness of mem-brane (cm). R is the universal gas constant, and F is Faraday’s constant.
The mass flow rate of air flows between the exit of supply manifold Wsm,out,ca and the cathode is determined as given in the equation below [18],
(
)
, , ,
sm,out ca sm,out ca sm,out ca ca,in
W =K ⋅ P −P (6)
where, Pca,in is the pressure of air enter the cathode, and Wsm,out,ca is assumed to be equal to Wsm,in,ca under condition of steady flow. ksm,out,ca is the nozzle constant of supply manifold outlet (kg/s·kPa) which represents the ratio of mass flow rate of air to the pressure. While, the pressure of air enter and exit the cathode can be determined as given in equation below [18],
, , 2,
, ,
2
w gen w mbr O rct
st ca out ca in
ca w O
m m m
R T
P P
V M M
−
⋅
= + −
(7)
where, mw,gen, mw,mbr, and mO2,rct represent mass (kg) of produced water as a result of electrochemical reaction, the mass of water vapour across the electrolyte membrane, and the mass of reacted oxygen in the cathode, respectively, Vca is the volume of cathode (m3), and T
st is the stack temperature. Mw and MO2 represents the molar mass of water and oxygen (kg/mol), respectively. The mass flow rate of hydrogen at the exit of the supply manifold of anode Wsm,out,an is de-termined by the equation below [18],
(
)
, , ,
sm,out an sm,out an sm,out an an,in
W =K ⋅ P −P (8)
DOI: 10.4236/msce.2018.64019 206 Journal of Materials Science and Chemical Engineering hydrogen enter and exit the anode can be determined as given in equation below [18].
, , 2,
2 st
an out an in H rct an H
R T
P P m
V M
⋅
= − ⋅
⋅ (9)
where, Van is the volume of anode (m3), mH2,rct represents mass of the reacted hydrogen (kg), and MH2 is the molar mass of pure hydrogen (kg/mol), and
WH2,rct is the mass flow rate of the reacted hydrogen as a result of electrochemical
reaction.
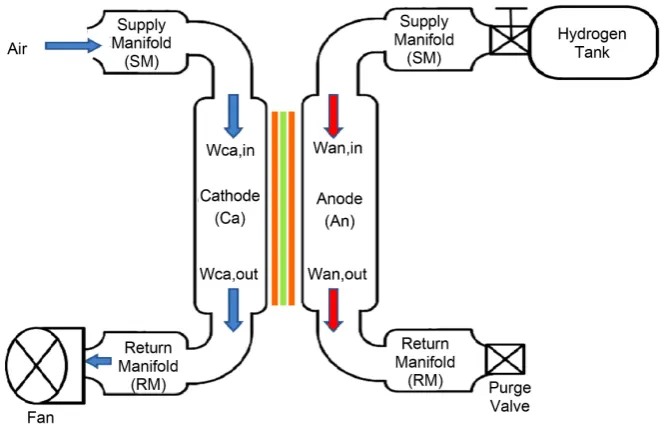
[image:6.595.208.540.481.693.2]In this research, Horizon (H-1000) fuel cell stack system is adopted as an ex-perimental prototype, which is designed by the manufacturer to be self-humidified fuel cell stack [20]. Figure 1 shows the mechanical components and flow vari-ables associated with the Horizon (H-1000) fuel cells stack system. It has been assumed that all the gases inside the stack of the fuel cells will behave as an ideal gas; also the properties of gases leaving the specific volume are the same as those inside that volume. The dimensions of the Horizon (H-1000) fuel cell stack are relatively small, hence the distances between the supply-return manifolds and anodes-cathodes of the fuel cell are small, therefore it is assumed the impact of heat radiation or conduction between anodes-cathodes and supply-return manifolds are very small and can be ignored. Hence, the temperature of gases in the anodes-cathodes and also along the supply-return manifolds will be uniform and equal to the stack temperature. Moreover, because of the small size of the stack, it is assumed that the flow of gases within any cross sections in the stack has approximately zero flow fractions. Also, it has been assumed that the average stack temperature and relative humidity inside the cathode and anode are well regulated and maintained for all the stages of modelling, analysis, and control design [18].
DOI: 10.4236/msce.2018.64019 207 Journal of Materials Science and Chemical Engineering
3. Validation of the Developed Model of a PEM Fuel Cell
Horizon (H-1000) 1 kW PEM fuel cell stack is used as an experimental device in running the test physically in order to validate and tune the developed mathe-matical model of PEM fuel cell. The developed model is simulated under oper-ating conditions of room temperature, stack temperature, and drawn current similar to the real operating condition of the tested Horizon stack in the labora-tory.Different values of tuning are adopted for the developed model, in order to find the best tuning value, which enables the developed model to perform and produce a steady state output voltages and currents close to the output voltages and currents of the tested stack. Moreover, in order to get the most accurate real data outputs, the test of the PEM fuel cell stack is repeated several times on dif-ferent occasions, in order to achieve a minimum deviation between the output voltages of the tested stack and output voltages of the developed model, also a closeness in the behaviour and steady state performance between the tested stack and the developed model.
Horizon fuel cell stack (H-1000) is designed to have four fans installed at the exit outlet of the return manifolds of cathodes. Hence, fans are configured as a ducted inlet-free outlet, working as suction devices at the outlet of the return manifolds of cathodes. The rotational speed of the four axial fans and the fre-quency of purging for the outlet hydrogen valve every 10 seconds are controlled by an inbuilt stack’s controller, in order to maintain enough operational pres-sure at the cathode and anode, and also to provide a sufficient flow of air and hydrogen leading to maintaining a certain level of stack temperature and retain-ing the continuity of the electrochemical reaction. The controller provides a protection shutdown for the stack at 30 A over current and 36 V low voltage op-eration [20].
An AttoPilot 50 V/90 A, DC voltage-current senor with 2 analog outputs is used to measure the output voltages and currents from the stack via stepping down the detected voltage and current at a ratio of (63.69 mV/1V), and (36.6 mV/1A). A USB interface data acquisition (NI USB-6008) with 8 analog inputs and 2 analog outputs ports is used to capture the real time currents and voltages, while LabVIEW v13.0 software is used for the purpose of data recording and analysis, with sampling frequency set on 1 Hz. SkyRC i-Meter operates for a maximum input voltage and current of 60 V and 100 A is used to manually measure the output voltages and currents from the fuel cell stack. DC-DC Con-vertor (Mean Well SD-1000L-24) with an input range of 19 V to 72 V and out-put of 24 V, with 40 A maximum current, is installed between the fuel cell stack and the BLDC motor in order to stabilise and maintain the output voltage.
DOI: 10.4236/msce.2018.64019 208 Journal of Materials Science and Chemical Engineering to the supply voltage is 360/V. Al’s Hobbies Professional analogue-digital servo tester is used to adjust the rotational speed of the BLDC motor and its propeller via generating a PWM signal to the electronic speed controller (ESC) in order to increase-decrease the current drawn from the fuel cell stack.
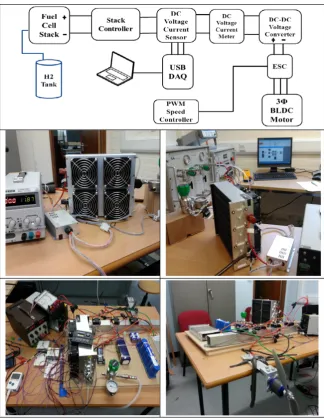
[image:8.595.212.537.274.695.2]A pressure reduce valve (Swagelok) is used to maintain the supply pressure of hydrogen to the stack at 55 kPa. A temperature and humidity data-logger (KTH-300 Kistock), integrated with thermo-hygrometry (TH) probe sensor, is used to measure the temperature of the exit air from the stack. TH sensor is mounted at each fan outlet in an attempt to obtain an accurate estimate of tem-perature. The stack temperature is determined by taking the average of the sums of temperature readings for these four TH sensors. Figure 2 shows the block diagram configuration and bench layout of the Horizon (H-1000) fuel cell stack configured with measuring and controlling devices and the BLDC motor load
DOI: 10.4236/msce.2018.64019 209 Journal of Materials Science and Chemical Engineering during the testing process carried out in the laboratory. The defined values of variables and constants for the operational parameters involved in the simula-tion of the developed mathematical model of PEM fuel cell stack are presented in Table A1 in the Appendix.
3.1. First Test
Horizon (H-1000) PEM fuel cell stack is tested under atmospheric pressure and 23˚C room temperature. The stack is operated for about 25 minutes under dif-ferent levels of load current varied from 1 to 17 A in step of 1 A, with approxi-mate holding time of one and a half minute. One TH sensor is installed at the exit outlet of the fan in order to measure the temperature of the stack.
Different values of stack efficiency (83%, 84%, 85%, and 86%) are adopted for the developed model of PEM fuel cell stack in order to find the best tuning value between the tested stack and the developed model. It has been found that the best value of efficiency for the developed model that enables the model to per-form and produce output voltages close to the stack output voltages was at 84% with 0.78 V average of deviation between the real test output voltages and output voltages of the developed model.
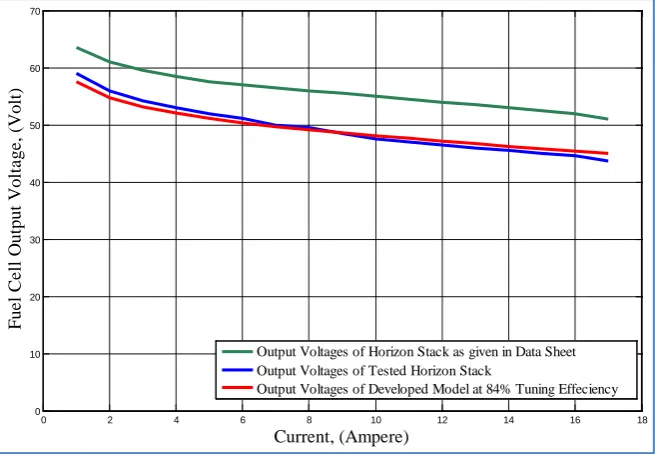
[image:9.595.209.537.462.689.2]The output voltages for the tested Horizon (H-1000) fuel cell stack and the developed model are shown in Figure 3. The green line represents the output voltages as given in the data sheet of 1 kW Horizon (H-1000) PEM fuel cell stack, for operating condition defined at sea level and 25˚C ambient tempera-ture. The blue line represents output voltages of the tested stack for about 25 minutes continuous operation at 23˚C room temperature under different levels of load current varied from 1 to 17 A in step of 1 A, with approximate holding
Figure 3. Output voltages for Horizon (H-1000) fuel cell stack and mathematical devel-oped model of PEM fuel cell under various drawn load currents.
0 2 4 6 8 10 12 14 16 18
0 10 20 30 40 50 60 70
Current, (Ampere)
F
ue
l Ce
ll
O
ut
put
V
ol
ta
ge
, (V
ol
t)
Output Voltages of Horizon Stack as given in Data Sheet Output Voltages of Tested Horizon Stack
DOI: 10.4236/msce.2018.64019 210 Journal of Materials Science and Chemical Engineering time of one and a half minute. The red line represents output voltages of mathematical developed model based on 84% model tuning efficiency.
It is clear that the performance and output voltages of the mathematical model developed for a PEM fuel cell is fairly close to the performance and out-put voltages of the tested Horizon stack operated under varied levels of load current and stack temperature, which provides initial satisfaction about the va-lidity of the developed model.
3.2. Second Test
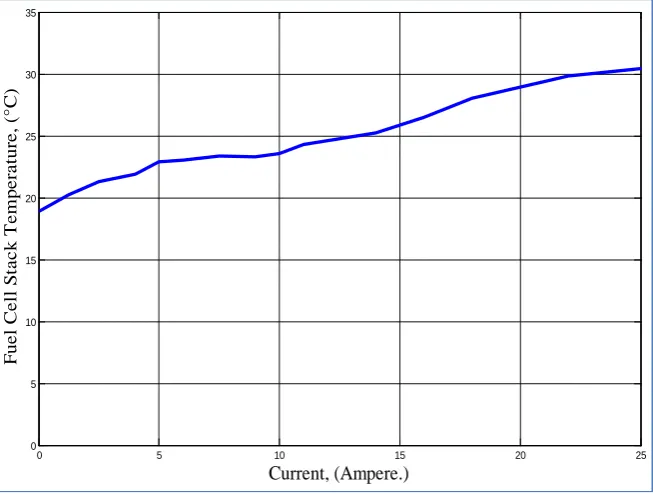
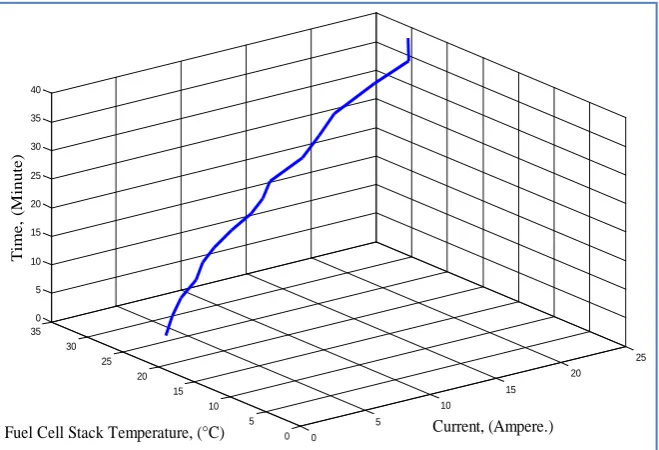
Horizon (H-1000) PEM fuel cell stack is tested under atmospheric pressure and 18˚C room temperature. The stack is operated for about 38 minutes under dif-ferent levels of current load varied from 0 to 25 A, with approximate holding time of two minutes. Four TH sensors are installed at the exit outlets of the four fans in order to have more accurate temperature measurements. The impact of drawn load current and the time of operation upon the temperature of Horizon (H-1000) fuel cell stack are measured and presented in Figures 4-6, respectively.
3.3. Third Test
[image:10.595.209.536.448.695.2]Horizon (H-1000) PEM fuel cell stack is tested under atmospheric pressure and 20˚C room temperature. The stack is operated for about 43 minutes under different levels of current load varied from 1 to 20 A, with approximate holding time of three minutes. Data acquisition is set to capture and record the output voltages and currents from the stack at every 30 seconds. Four TH sensors are installed at the exit outlets of the four fans in order to have more accurate
Figure 4. Impact of drawn current on the temperature of Horizon (H-1000) fuel cell stack.
0 5 10 15 20 25
0 5 10 15 20 25 30 35
Current, (Ampere.)
F
ue
l Ce
ll
S
ta
c
k T
e
m
pe
ra
ture
, (°
DOI: 10.4236/msce.2018.64019 211 Journal of Materials Science and Chemical Engineering
Figure 5. Impact time of operation at varied load current on the temperature of Hori-zon (H-1000) fuel cell stack.
Figure 6. Impact of drawn current and time of operation on the temperature of Hori-zon (H-1000) fuel cell stack.
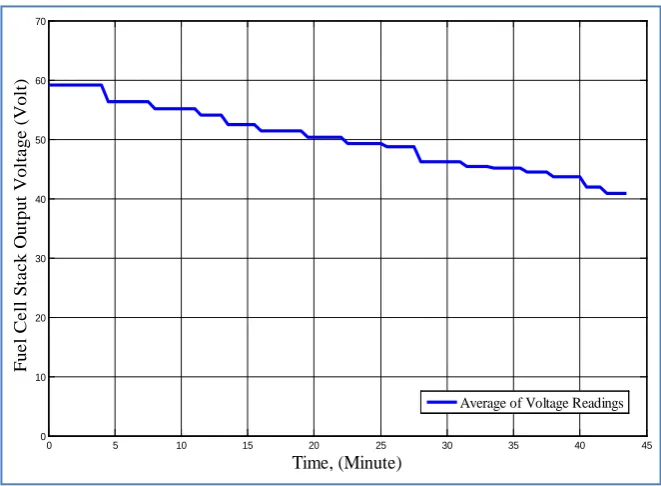
temperature measurements. Figure 7 shows the output voltages and drawn cur-rents for the tested Horizon (H-1000) fuel cell stack, while Figure 8 shows the average of voltages for each level of current.
Different values of efficiency (83%, 84%, 85%, and 86%) for developed PEM fuel cell are adopted in order to find the best tuning value between the tested fuel cell stack and the developed model. It is noticed that the best value of efficiency for the developed model that enables the model to perform and produce output
5 10 15 20 25 30 35 40
0 5 10 15 20 25 30 35
F
ue
l Ce
ll
S
ta
c
k T
e
m
pe
ra
ture
, (°
C)
Time, (Minute)
0 5
10 15
20 25
0 5 10 15 20 25 30 35
0 5 10 15 20 25 30 35 40
Current, (Ampere.) Fuel Cell Stack Temperature, (°C)
T
ime
, (
M
in
u
te
[image:11.595.209.539.343.568.2]DOI: 10.4236/msce.2018.64019 212 Journal of Materials Science and Chemical Engineering
Figure 7. Output voltages and drawn currents for Horizon (H-1000) fuel cell stack.
Figure 8. Average of output voltages for each level of drawn current for Horizon (H-1000) fuel cell stack.
voltages close to the real outputs of tested stack was at 85% with 1.44 V aver-age of deviation between the stack test output voltaver-ages and output voltaver-ages of the developed model. Output voltages for the tested Horizon stack and for the de-veloped model under varied stack temperatures and load currents, and the out-put voltages of the developed model at particularly 85% tuning efficiency and constant average stack Temperature (27.73˚C) are presented in Figure 9. The
0 5 10 15 20 25 30 35 40 45
0 10 20 30 40 50 60 70 F ue l C e ll S ta c k O ut put V ol ta ge ( V ol t) , a nd C ur re nt ( A m p. ) Time, (Minute)
Stack output voltage readings taken every half minute. Stack output current readings taken every half minute.
0 5 10 15 20 25 30 35 40 45
0 10 20 30 40 50 60 70 F ue l Ce ll S ta c k O ut put V ol ta ge (V ol t) Time, (Minute)
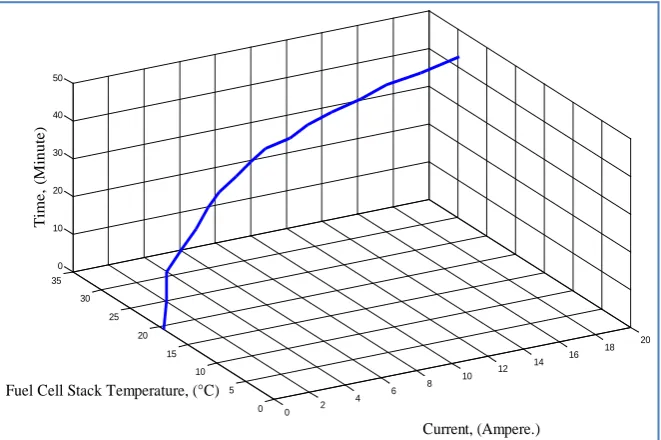
[image:12.595.207.538.341.584.2]DOI: 10.4236/msce.2018.64019 213 Journal of Materials Science and Chemical Engineering impact of drawn currents and time of operation upon the temperature of Hori-zon fuel cell stack are shown in Figures 10-12, respectively.
[image:13.595.208.539.187.416.2]It can be noticed from Figure 9, that for the developed PEM fuel cell model at 85% tuning efficiency, there is very small variations between the output voltages of the model at varied stack’s temperature (represented by red line) and the output voltages of the model at constant average stack’s temperature of 27.73˚C (represented by green line). Thus, 85% tuning efficiency and 27.73˚C average
Figure 9. Output voltages of Horizon fuel cell stack test, and developed model of PEM fuel cell at varied stack temperature and load currents, and 85% tuning efficiency.
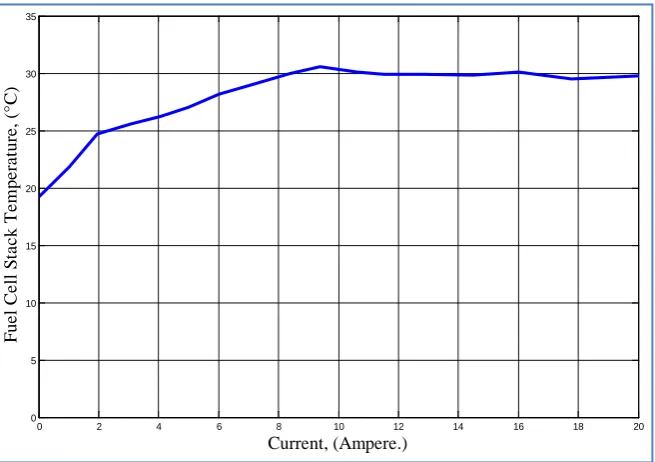
Figure 10. Impact of drawn current on the temperature of Horizon (H-1000) fuel cell stack.
0 2 4 6 8 10 12 14 16 18 20 22
30 35 40 45 50 55 60
Current, (Ampere)
F
ue
l Ce
ll
O
ut
put
V
ol
ta
ge
, (V
ol
t)
Output Voltages of Tested Horizon Stack.
Output Voltages of Developed Model at 85% Tuning Efficiency and Varied Stack Temp. Output Voltages of Developed Model at 85% Tuning Efficiency and Stack Temp (27.73 °C).
0 2 4 6 8 10 12 14 16 18 20
0 5 10 15 20 25 30 35
Current, (Ampere.)
F
ue
l Ce
ll
S
ta
c
k T
e
m
pe
ra
ture
, (°
[image:13.595.210.538.461.692.2]DOI: 10.4236/msce.2018.64019 214 Journal of Materials Science and Chemical Engineering
Figure 11. Impact of time of operation at varied current on the temperature of Horizon (H-1000) fuel cell stack.
Figure 12. Impact of drawn current and time of operation on the temperature of Horizon (H-1000) fuel cell stack.
stack’s temperature will be adopted for any further simulations for the developed mathematical model of PEM fuel cell in this research.
3.4. Fourth Test
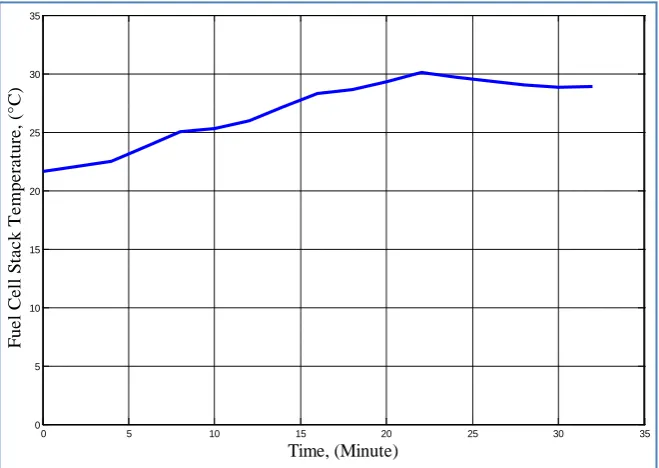
Horizon (H-1000) PEM fuel cell stack is tested under atmospheric pressure and 21.5˚C room temperature. Test is started after leaving the fuel cell stack for about one hour from the last running test in order to refresh and rest the stack.
0 5 10 15 20 25 30 35 40 45
0 5 10 15 20 25 30 35
F
ue
l Ce
ll
S
ta
c
k T
e
m
pe
ra
ture
, (°
C)
Time, (Minute)
0 2
4 6
8 10
12 14
16 18 20
0 5 10 15 20 25 30 35
0 10 20 30 40 50
Current, (Ampere.) Fuel Cell Stack Temperature, (°C)
T
ime
, (
M
in
u
te
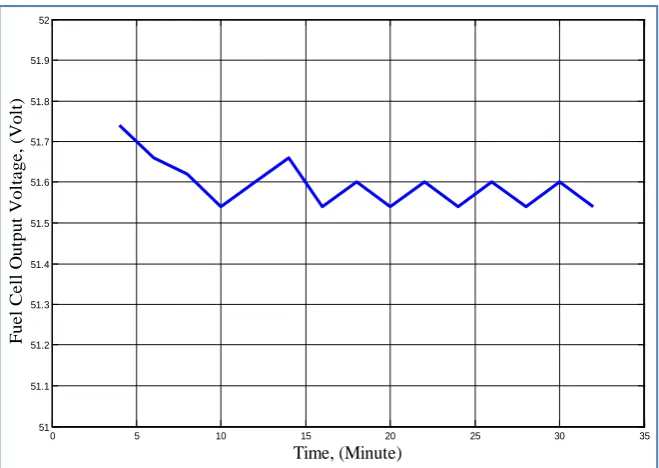
[image:14.595.209.540.351.571.2]DOI: 10.4236/msce.2018.64019 215 Journal of Materials Science and Chemical Engineering The stack is operated for about 32 minutes under constant load current (9.08 A). Four TH sensors are installed at the exit outlets of the four fans in order to have more accurate temperature measurements, and TH sensors readings are cap-tured every two minutes. The impact of constant drawn load current and time of operation upon the temperature of Horizon fuel cell stack are measured and drawn in Figure 13. Output voltage of Horizon fuel cell stack under the impact of constant drawn current is almost stable around 51.6 V as shown in Figure 14. Where, the fluctuations in the output voltages as a result of the drop in the pressure of hydrogen in the anode chambers of Horizon PEM fuel cell stack due to frequent breathing process triggered by hydrogen purging valve are elimi-nated from the captured results.
It is clear from the results presented for the tested Horizon (H-1000) fuel cell stack that the stack’s temperature has intendancy to increase with operating time and drawn current. The temperature of the stack is maintained around the level of (30˚C) even under further extend in operating time or further increase in the drawn current. This is returned to the potential role of stack’s controller which works to suppress any further increase in the stack’s temperature above (30˚C) by pumping more air to the cathode in order to maintain the operating tem-perature of the stack around certain level of operating temtem-perature.
[image:15.595.208.538.460.694.2][21] Adopted a 100 W Horizon PEM fuel cell stack as prime source of power for small unmanned aircraft. The test results and the performance evaluation obtained from continuously operating the stack for about 5 hours under 50 W of constant load have shown that the temperature of the stack is increased from 22˚C to 35˚C for the first 30 minutes of stack’s operation, while the stack’s tem-perature is maintained below 35˚C for the rest hours of the test.
Figure 13. Impact of constant drawn current and time on the temperature of Horizon (H-1000) fuel cell stack.
0 5 10 15 20 25 30 35
0 5 10 15 20 25 30 35
Time, (Minute)
F
ue
l Ce
ll
S
ta
c
k T
e
m
pe
ra
ture
, (°
DOI: 10.4236/msce.2018.64019 216 Journal of Materials Science and Chemical Engineering
Figure 14. Output voltages of Horizon (H-1000) fuel cell stack under the impact of con-stant drawn current.
Furthermore, the observations from model simulations provide sufficient evi-dence and support to the results and observations obtained from testing 1 kW Horizon (H-1000) PEM fuel cell stack used in this research. The developed model can be used as a generic model and simulation platform for a self-humidifying PEM fuel cell with an output power varying from 50 W to 1 kW, with extrapolation to higher powers is also possible.
4. Conclusions
This paper presents a validation of the zero dimensional mathematical model for a self-humidifying PEM fuel cell stack. The major electric and thermodynamic variables and parameters involved in the operation of the PEM fuel cell with the association of the influence of the environment and conditions of fuel cell opera-tion are considered. A 1 kW Horizon (H-1000) PEM fuel cell stack is used as a prototype device in order to validate and tune the developed mathematical model with the output results of the test.
The results of testing 1 kW Horizon stack and the simulations of the devel-oped mathematical model are presented for different changes in the operational variables in order to improve the accuracy of the model. The observations from model simulations provide sufficient evidence and support to the results and observations obtained from testing 1 kW Horizon PEM fuel cell stack used in this research. Moreover, the developed model can be used as a generic model and simulation platform for a self-humidifying PEM fuel cell with an output power varying from 50 W to 1 kW, with extrapolation to higher powers is also possible.
Further works need to be carried out in the future to extend the developed
0 5 10 15 20 25 30 35
51 51.1 51.2 51.3 51.4 51.5 51.6 51.7 51.8 51.9 52
Time, (Minute)
F
ue
l Ce
ll
O
ut
put
V
ol
ta
ge
, (V
ol
DOI: 10.4236/msce.2018.64019 217 Journal of Materials Science and Chemical Engineering model to implicit the impact of produced heat as a result of electrochemical re-action and the impact of the friction of the flowing reactants inside the fuel cell on the performance and power output of PEM fuel cell stack.
Acknowledgements
The authors would like to thank Dr. George Pissanidis and Leonine Kunzwa from School of Engineering & Technology at the University of Hertfordshire for their assistance and technical support during the field of experiments.
References
[1] Golbert, J. and Lewin, D.R. (2004) Model-Based Control of Fuel Cells: (1) Regula-tory Control. Journal of Power Sources, 135, 135-151.
https://doi.org/10.1016/j.jpowsour.2004.04.008
[2] Jing, Q.I.U., Dong, Z.Y., Zhao, J.H., Meng, K., Luo, F.J., Wong, K.P. and Lu, C. (2015) A Low-Carbon Oriented Probabilistic Approach for Transmission Expan-sion Planning. Journal of Modern Power Systems and Clean Energy, 3, 14-23.
https://doi.org/10.1007/s40565-015-0105-3
[3] El-Sharkh, M.Y., Rahman, A., Alam, M.S., Byrne, P.C., Sakla, A.A. and Thomas, T. (2004) A Dynamic Model for a Stand-Alone PEM Fuel Cell Power Plant for Resi-dential Applications. Journal of Power Sources, 138, 199-204.
https://doi.org/10.1016/j.jpowsour.2004.06.037
[4] Rodatz, P., Paganelli, G., Sciarretta, A. and Guzzella, L. (2005) Optimal Power Management of an Experimental Fuel Cell/Supercapacitor-Powered Hybrid Ve-hicle. Journal of Control Engineering Practice, 13, 41-53.
https://doi.org/10.1016/j.conengprac.2003.12.016
[5] Bordons, C., Arce, A. and Real, A.J.D. (2006) Constrained Predictive Control Strat-egies for PEM Fuel Cells. American Control Conference, Minneapolis, 14-16 June 2006, 2486-2491.
[6] Chen, S.-L., Bocarsly. A.B. and Benziger, J. (2005) Nafion-Layered Sulfonated Poly-sulfone Fuel Cell Membranes. Journal of Power Sources, 152, 27-33.
https://doi.org/10.1016/j.jpowsour.2005.03.214
[7] Springer, T.E., Zawodzinski, T.A. and Gottesfeld, S. (1991) Polymer Electrolyte Fuel Cell Model. Journal of the Electrochemical Society, 138, 2334-2342.
https://doi.org/10.1149/1.2085971
[8] Büchi, F.N. and Scherer, G.G., (1996) In-Situ Resistance Measurements of Nafion® 117 Membranes in Polymer Electrolyte Fuel Cells. Journal of Electroanalytical Chemistry, 404, 37-43. https://doi.org/10.1016/0022-0728(95)04321-7
[9] Yi, J.S. and Nguyen, T.V. (1998) An Along-the-Channel Model for Proton Exchange Membrane Fuel Cells. Journal of the Electrochemical Society, 145, 1149-1159.
https://doi.org/10.1149/1.1838431
[10] Pukrushpan, J.T., Stefanopoulou, A.G. and Peng, H. (2002) Modeling and Control for PEM Fuel Cell Stack System. Proceedings of American Control Conference, Anchorage,8-10 May 2002, 3117-3122.
[11] Rowe, A. and Li, X. (2001) Mathematical Modeling of Proton Exchange Membrane Fuel Cells. Journal of Power Sources, 102, 82-96.
https://doi.org/10.1016/S0378-7753(01)00798-4
Transac-DOI: 10.4236/msce.2018.64019 218 Journal of Materials Science and Chemical Engineering tions on Energy Conversion, 21, 484-490. https://doi.org/10.1109/TEC.2005.860402
[13] del Real, A.J., Arce, A. and Bordons, C. (2007) Development and Experimental Va-lidation of a PEM Fuel Cell Dynamic Model. Journal of Power Sources, 173, 310-324. https://doi.org/10.1016/j.jpowsour.2007.04.066
[14] Park, S.-K. and Choe, S.-Y. (2008) Dynamic Modeling and Analysis of a 20-Cell PEM Fuel Cell Stack Considering Temperature and Two-Phase Effects. Journal of Power Sources, 179, 660-672. https://doi.org/10.1016/j.jpowsour.2008.01.029
[15] Youssef, M.E., AL-Nadi, K.E. and Khalil, M.H. (2010) Lumped Model for Proton Exchange Membrane Fuel Cell (PEMFC). International Journal of Electrochemical Science, 5, 267-277.
[16] Yuan, W., Tang, Y., Pan, M., Li, Z. and Tang, B. (2010) Model Prediction of Effects of Operating Parameters on Proton Exchange Membrane Fuel Cell Performance. Renewable Energy, 35, 656-666. https://doi.org/10.1016/j.renene.2009.08.017
[17] Seyezhai, R. and Mathur, B.L. (2011) Mathematical Modeling of Proton Exchange Membrane Fuel Cell. International Journal of Computer Applications, 20, 1-6.
https://doi.org/10.5120/2433-3272
[18] Saleh, I.M.M., Ali, R. and Zhang, H. (2016) Simplified Mathematical Model of Pro-ton Exchange Membrane Fuel Cell Based on Horizon Fuel Cell Stack. Journal of Modern Power Systems and Clean Energy, 4, 668-679.
https://doi.org/10.1007/s40565-016-0196-5
[19] Saleh, I.M.M., Calay, R.K. and Rashid, A. (2013) Modelling and Examining Open Circuit Voltage for PEM Fuel Cell. Journal of Electrical Engineering, 13, 140-146. [20] Horizon Fuel Cell Technology (2011) H-1000 Fuel Cell Stack-User Manual. [21] Kim, T. and Kwon, S. (2012) Design and Development of a Fuel Cell-Powered Small
Unmanned Aircraft. International Journal of Hydrogen Energy, 37, 615-622.
https://doi.org/10.1016/j.ijhydene.2011.09.051
[image:18.595.208.537.501.705.2]Appendix A
Table A1. Variables and constants of the operational parameters involved in the devel-oped model of PEM fuel cell stack.
Variables and Constants Defined Values
Number of cells in the stack 72
Active area of electrolyte membrane 80 cm2
Water content in electrolyte membrane (λ) 7
Membrane thickness (L) 25 × 10−4 cm
Maximum current density (im) 500 mA/cm2
Maximum output voltage 43.2 V at 24 A
Maximum stack operating temperature 65˚C
Temperature of supply air and hydrogen Room temperature
Ambient pressure 101.325 kPa
Ambient air density 1.225 kg/m3
Pressure of supply Hydrogen 55 kPa