The extension of a set of needs-led mental health clusters
to accommodate people accessing UK intellectual
disability health services
PAINTER, Jon <http://orcid.org/0000-0003-1589-4054>, TREVITHICK, Liam,
HASTINGS, Richard, INGHAM, Barry and ROY, Ashok
Available from Sheffield Hallam University Research Archive (SHURA) at:
http://shura.shu.ac.uk/15378/
This document is the author deposited version. You are advised to consult the
publisher's version if you wish to cite from it.
Published version
PAINTER, Jon, TREVITHICK, Liam, HASTINGS, Richard, INGHAM, Barry and ROY,
Ashok (2018). The extension of a set of needs-led mental health clusters to
accommodate people accessing UK intellectual disability health services. Journal of
Mental Health, 27 (2), 103-111.
Copyright and re-use policy
See
http://shura.shu.ac.uk/information.html
The extension of a set of needs-led mental health
clusters to accommodate people accessing UK
intellectual disability health services.
Abstract
Background: A development of a needs-led classification system based on the Health of the
National Outcome Scales (HoNOS) has previously been developed (Self, Rigby, Leggett, &
Paxton, 2008).
Aims: To extend the needs-based mental health clusters to accommodate the additional needs
of people accessing UK intellectual disabilities health services.
Method: Hierarchical cluster analysis was performed on assessment data from 18 NHS
provider organisations. The statistical results were clinically shaped through multi-disciplinary
workshops. The resulting clusters were combined with six independently-rated measures for a
second data collection exercise. Based on these data, refinements were made before
performing internal and external validity checks.
Results: Eight additional clusters for people with health needs associated with their intellectual
disabilities were produced. Three described primarily physical health needs, four described
needs arising from behaviours which challenged (with/without autism) whilst one described
people with generally low needs. Together, these covered 83.4% of cases with only a 10%
overlap. The clusters were replicable and had clinical utility and validity.
Conclusions: It was possible to extend the needs-led mental health classification system to
capture the additional needs of people accessing UK intellectual disability services.
Declarations of Interest: This study received NHS England funding.
Key words: Mental retardation, cluster analysis, Health of the Nation Outcome Scales, HoNOS,
Background
A consortium of NHS trusts in the North of England worked in collaboration with Monitor,
Department of Health and NHS England for over ten years on a novel needs-led classification
system for use in mental health services. Fundamental to the work was the rating of individual
patient needs using an extended version of the Health of the Nation Outcome Scales (HoNOS)
(Wing et al., 1998) which was subsequently named the Mental Health Clustering Tool (MHCT)
(Department of Health, 2014).
Initially, data were gathered by using the MHCT to assess a broad range of patients accessing
specialist mental health services. Statistical cluster analysis was then undertaken to identify
groups of patients with similar scoring profiles across the 18 scales in the tool. Finally, these
clusters were refined through multi-disciplinary focus groups and case reviews to ensure clinical
as well as statistical homogeneity (see Self, Rigby, Leggett, & Paxton, 2008). Over time these
needs-led clusters have been refined and the current mental health set consists of 21 clusters
divided into 3 super-classes (psychosis, non-psychosis and organic conditions). Each cluster
consists of a brief vignette, salient clinical information and most importantly a scoring profile for
the 18 items in the MHCT (each of which are rated on a 0-4 scale). See Painter et al,
(submitted) for details.
Since 2010, this needs-led clusters model has been incrementally adopted through national
policy as the basis of a move away from block contracts to a national payment system through
which complexity of clinical need and associated treatment can be more appropriately
recompensed (Appleby, Harrieson, Hawkins, & Dixon, 2013). Locally, the mapping of patient
need by cluster has also allowed provider organisations to consider whether their service
configurations are optimally matched to the type and level of demand they experience (Brown et
al., 2015).
Variability and somewhat arbitrary organisational and commissioning boundaries between
mental health and intellectual disability services prompted the view that all patients should be
facilitated to access the service which best met their needs (rather than choices being limited by
spurious and often detrimental labels/criteria (Chaplin, 2004)). In consultation with
multi-disciplinary groups of intellectual disability staff it was agreed that a similar needs-led clustering
approach would also be beneficial for patients with an intellectual disability. Importantly, in
intellectual disability, it was decided to create a seamless extension to the mental health
clusters rather than creating a completely separate classification system (Ingham et al., 2013).
In this paper, we report the extension of the mental health clusters to create a comprehensive,
empirically-generated, needs-based taxonomy that describes the groups of patients typically
Method
This study of retrospective clinical data from 18 healthcare providers across England was
approved for the purposes of NHS service evaluation. The iterative process of data collection,
analysis, re-testing and validation took place between 2011 and 2016. Initially, the MHCT was
reviewed by a multi-disciplinary group of clinicians working in the field of intellectual disabilities.
Their feedback led to the creation of additional scales to ensure all relevant clinical issues could
be rated. The resulting learning disability needs assessment tool (LDNAT; Painter et al,
submitted) was then felt to cover the six domains of patient need that clinicians deemed
necessary to formulate care/treatment plans. These domains were: general ability/disability
severity; risk; mental health, challenging behaviour; Autism (ASD), and physical health.
The use of the LDNAT in a broad range of specialist health care intellectual disability settings
generated the data analysed for this study as well as the validation of the needs assessment
tool itself (described in more detail in Painter et al, submitted). Briefly, the tool was found to
have good internal consistency and principal component analysis identified three components
describing developmental needs, challenging behavior, and mental health and wellbeing.
Stage 1:
Staff from a range of disciplines working across 18 trusts received training in the use of the
LDNAT and cluster allocation. They, in turn trained staff in their own organisations. These
trained staff then used the model to rate and allocate a number of their patients over a 9-month
period. In addition to the LDNAT ratings, a standardised pseudonymous dataset was developed
which also contained a range of basic demographics and other relevant clinical information now
routinely submitted as part of the Mental Health and Learning Disability Data Set (HSCIC,
2014). Each trust then sourced the required data from their patients’ records before submitting
it for analysis using SPSS version22(IBM, 2015).
Allocations made to any of the original mental health clusters were excluded from the remainder
of this stage of the project as these clusters had been developed in the previous work on the
MHCT. Following the production of a range of basic descriptive statistics for the patients
deemed by staff to have a primary need related to their intellectual disability, two-stages of
cluster-analysis (Ward’s method and K-means) were undertaken as per Self, Rigby, Leggett, &
Paxton's (2008) original mental health developments. Similarly, over a number of
sub-divided to ensure the clusters had clinical face validity. Profiles for each cluster were then
produced which mirrored the original mental health descriptions and these were integrated into
the original taxonomy (fig 3). Expert by experience and carer feedback was also gathered at this
stage through four workshops that were facilitated by an independent advocacy service to
inform developments.
To gauge the success of the clinical refinements described above, 11 of the original trusts
reassessed a number of their patients and allocated them to one of the nine new
empirically-derived intellectual disability clusters. Again, pseudonomised data were submitted for central
analysis but this time the dataset included clinician ratings of how well the resulting cluster
described the person they had assessed as well as allowing for free text comments regarding
any patient needs they were unable to capture.
Stage 2:
To test the refined model, a second data collection exercise was undertaken by staff in 6 of the
trusts between 01/07/2014 and 31/08/2015. The resulting patient assessments were again
submitted electronically for analysis via a standardised dataset. On this occasion, 4 of the trusts
also included a convenience sample of concurrent, but independent ratings from 6 routine
clinical assessment tools. These tools each addressed a specific treatment domain and were
used to validate the clusters against independent measures as well as the LDNAT ratings.
Candidate measures were identified from a brief literature review with final selection based on
brevity, simplicity, validity, and cost. The final choice of measures was:
The Waisman Activities of Daily Living Scale (W-ADL) (Maenner et al., 2013) was used to
assess general ability/disability. Raters record whether an individual can complete various
activities of daily living independently (score 2), with help (score 1), or not at all (score 0). The
tool consists of 17 activities ranging from basic skills (e.g. drinking from a cup) to more
advanced tasks (e.g. simple home repairs and budgeting). The tool has been validated on
people with a broad range of intellectual disabilities.
The Threshold Assessment Grid (TAG) (Slade, Powell, Rosen, & Strathdee, 2000) was selected
to provide an overall risk rating. It was originally developed and validated through a series of
health services. Seven items are each rated on 4 or 5 point scales to give an overall rating of
illness severity. However, a number of the tool's subscales were deemed by clinicians to
adequately capture risks to/from people with intellectual disabilities.
The Psychiatric Assessment Schedules for Adults with Developmental Disabilities Checklist
(PAS-ADD checklist) (Moss et al., 1998) was used to rate the severity of mental health
problems. The tool consists of 24 items written using lay-terms to allow non-professionals to
identify mental health problems in people with intellectual disabilities. Originally developed as a
screening tool, the PAS-ADD checklist includes three different scoring triggers for a fuller mental
health assessment. Items include irritability, loss of appetite and strange unshakeable beliefs.
Items rated on a 4-point scale which combines intensity and frequency, and is based on the
previous 4 weeks but specifically excludes long-standing issues.
The Behaviour Problems Inventory for Individuals with Intellectual Disabilities-Short Form (
BPI-S) (Mascitelli et al., 2015; Rojahn et al., 2012a, 2012b) was selected to rate challenging
behaviours. This shortened version captures self-injurious behaviours (e.g. head-hitting),
aggressive/destructive behaviours (e.g. verbal aggression) and stereotyped behaviours (e.g.
rocking/repetitive body movements) and is based on a longer (52-item) original version. The
frequency rating for each of the 30 items was used to provide an overall challenging behaviour
total score.
The Social Communication Questionnaire (SCQ), (Rutter, Bailey, & Lord, 2003) was selected to
provide a rating of the severity of ASD symptoms. Valid for both children and adults (Brooks &
Benson, 2013), it consists of 40 ‘yes/no’ questions intended to capture the key features of ASD for example: “Does he/she have interests that pre-occupy him/her and might seem odd to other people (e.g. traffic lights, drainpipes or timetables)?”.
No single suitable physical health measure could be identified and so a bespoke questionnaire
was created by the authors (available on request). It consisted of 12 yes/no questions (e.g. Is
the person blind/visually impaired?”), three rating scale questions (e.g. “How good is the person’s health in general? Very good/ good/ fair/ bad/ very bad/ don’t know”) and two which
ask for height and weight. The yes/no questions were used to create a total score representing
the overall level of physical health and disability. Although yet to be fully validated, it was based
on the POMONA study (Haverman et al., 2011) and a brief investigation of its internal
In stage 1 the mental health cluster allocations had been separated from the remainder of cases
prior to cluster analysis. To confirm this was appropriate, independent t-tests were performed
on each scale for these two groups. Next, cluster stability was investigated by repeating the
original cluster analysis procedure on the second data set. Goodness of fit was assessed with
the aid of scoring matrices for each cluster showing the percentage of patients fitting within the
anticipated ranges. This information was used to make final adjustments to the cluster profiles
before cases were re-allocated to the cluster that best-matched their LDNAT scoring. At this
point, a check of cluster coverage and overlap was repeated before exploring clinical face and
utility validity. Finally, the clusters were validated by examining their demographic information
and using the six additional, independently-rated clinical assessment tools to explore
Results
Stage 1
In total, staff from the 18 trusts submitted 2825 patient assessments for analysis. 53.6% were
male and 3.8% were inpatients. Assessments were undertaken by nurses, occupational
therapists, psychiatrists, psychologists as well as other allied health professionals. These staff
allocated 28% of the cases (n=779) to an existing cluster (indicating they felt mental health to be
the primary issue) and 65% (n=1849) to an intellectual disability descriptor. 5% (n=127) were
allocated to the variance cluster 0 (indicating they required a service but were not adequately
described by any of the existing clusters/descriptors) and the remaining 2% (n=70) were
unallocated.
Statistical cluster analysis
After removing records for patients under 18yrs, repeat assessments and those with incomplete
data, 1256 complete and unique patient records were available for the statistical cluster analysis
of LDNAT ratings for the patients deemed by clinicians to have a primary need arising from their
intellectual disability (i.e., also excluding those allocated to existing mental health clusters).
Hierarchical agglomerative cluster analysis using Ward’s method produced a dendrogram which
suggested a 5 or 6 cluster solution (figure 1).
With reference to the squared Euclidean distances used in Self et al's original work (Self et al.,
2008) and a clinical review of the LDNAT scoring profiles for the 5 and 6 cluster K-means
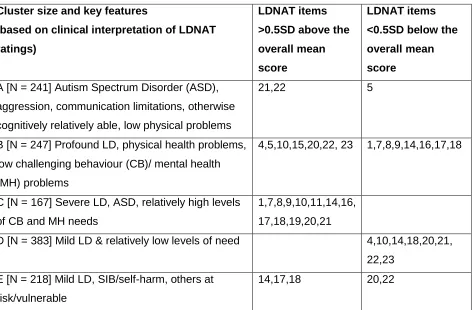
[image:10.612.75.548.164.474.2]solutions, the 5 cluster solution was favoured (table 1).
Table 1: Summary details of stage 1’s 5 statistical cluster solution.
Cluster size and key features
(based on clinical interpretation of LDNAT
ratings)
LDNAT items
>0.5SD above the
overall mean
score
LDNAT items
<0.5SD below the
overall mean
score
A [N = 241] Autism Spectrum Disorder (ASD),
aggression, communication limitations, otherwise
cognitively relatively able, low physical problems
21,22 5
B [N = 247] Profound LD, physical health problems,
low challenging behaviour (CB)/ mental health
(MH) problems
4,5,10,15,20,22, 23 1,7,8,9,14,16,17,18
C [N = 167] Severe LD, ASD, relatively high levels
of CB and MH needs
1,7,8,9,10,11,14,16,
17,18,19,20,21
D [N = 383] Mild LD & relatively low levels of need 4,10,14,18,20,21,
22,23
E [N = 218] Mild LD, SIB/self-harm, others at
risk/vulnerable
14,17,18 20,22
*NB. Items have been re-numbered to facilitate comparison with stage 2 results. Also, item 22
was originally 2 separate communication items
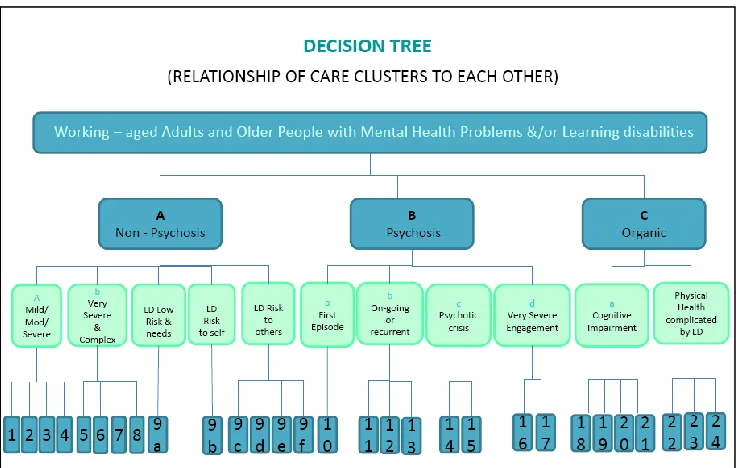
Clinical refinements
With the aid of a range of descriptive statistics and concurrent data, a series of regional and
national clinical workshops were held to investigate these results to better understand the
nature of each statistical cluster’s membership. As with Self et al's (2008) original work, through
a number of iterations, the 5 statistical groupings were ultimately subdivided to improve their
clinical utility. The resulting 6 ‘risky behaviour’ and 3 ‘physical health’ clusters balanced
complexity and severity of need were named and numbered to integrate with the original mental
health model (see Self, Rigby, Leggett, & Paxton, 2008):
9A Maintenance, engagement & minor support needs, complicated by LD
9B Risk to self, complicated by LD
9C Risk to others, complicated by LD
9D Risk to others, complicated by mild LD & ASD
9E Risk to others, complicated by moderate - profound LD & ASD
9F Risk to others & self, complicated by moderate - profound LD & ASD
22 Physical health complicated by mild LD
23 Physical health complicated by moderate - profound LD
[image:11.612.72.442.332.566.2] 24 Physical health with dysphagia complicated by moderate - profound LD
Figure 2: Decision tree with new clusters integrated into the original mental health model.
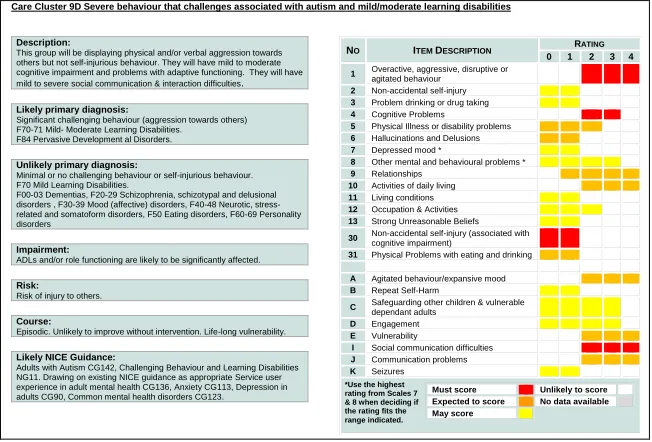
Also, based on the LDNAT scoring patterns and multi-disciplinary feedback regarding the most
important clinical features of each cluster, a fuller profile page (including a pen picture
Fig 3: Example of a cluster profile
Care Cluster 9D Severe behaviour that challenges associated with autism and mild/moderate learning disabilities
Description:
This group will be displaying physical and/or verbal aggression towards others but not self-injurious behaviour. They will have mild to moderate cognitive impairment and problems with adaptive functioning. They will have mild to severe social communication & interaction difficulties.
Likely primary diagnosis:
Significant challenging behaviour (aggression towards others) F70-71 Mild- Moderate Learning Disabilities. F84 Pervasive Development al Disorders.
Unlikely primary diagnosis:
Minimal or no challenging behaviour or self-injurious behaviour. F70 Mild Learning Disabilities.
F00-03 Dementias, F20-29 Schizophrenia, schizotypal and delusional disorders , F30-39 Mood (affective) disorders, F40-48 Neurotic, stress-related and somatoform disorders, F50 Eating disorders, F60-69 Personality disorders
Impairment:
ADLs and/or role functioning are likely to be significantly affected.
Risk:
Risk of injury to others.
Course:
Episodic. Unlikely to improve without intervention. Life-long vulnerability.
Likely NICE Guidance:
Adults with Autism CG142, Challenging Behaviour and Learning Disabilities NG11. Drawing on existing NICE guidance as appropriate Service user experience in adult mental health CG136, Anxiety CG113, Depression in adults CG90, Common mental health disorders CG123.
NO ITEM DESCRIPTION RATING
0 1 2 3 4
1 Overactive, aggressive, disruptive or
agitated behaviour
2 Non-accidental self-injury
3 Problem drinking or drug taking
4 Cognitive Problems
5 Physical Illness or disability problems
6 Hallucinations and Delusions
7 Depressed mood *
8 Other mental and behavioural problems *
9 Relationships
10 Activities of daily living
11 Living conditions
12 Occupation & Activities
13 Strong Unreasonable Beliefs
30 Non-accidental self-injury (associated with cognitive impairment) 31 Physical Problems with eating and drinking
A Agitated behaviour/expansive mood
B Repeat Self-Harm
C Safeguarding other children & vulnerable
dependant adults
D Engagement
E Vulnerability
I Social communication difficulties
J Communication problems
K Seizures
Must score Unlikely to score
Expected to score No data available May score
*Use the highest rating from Scales 7 & 8 when deciding if the rating fits the range indicated.
Overlap and coverage checks
Unlike strictly categorical psychiatric diagnoses (Vieta & Phillips, 2007) the mental health
clusters were based on the fuzzy clustering and proportional membership (Nascimento, 2006)
which effectively creates a degree of overlap between clusters. A second important balance
struck during the creation of the extended taxonomy was the degree of this overlap versus
coverage of all cases. As cluster membership was tightened (and overlap completely
eliminated) more cases fell outside any profile and vice versa. The final membership was
85.5% (almost identical to Self’s original work) with a low (2%) degree of overlap. Based on
their scoring profiles, the unallocated cases appeared to be outliers from the new clusters,
Figure 4: Venn diagram depicting membership, overlap and coverage of newly developed
clusters.
After the empirically generated clusters with fuller profiles were generated, 829 of the patients
from 11 of the trusts were re-assessed and allocated to the best-fitting cluster by clinicians. In
comparison with the initial data, fewer cases (12.6%) were allocated to a mental health cluster
and slightly more (7.7%) were allocated to the variance cluster 0 (i.e. where no other cluster
adequately describes the patient's needs). The remaining 79.7% were more evenly distributed
across the intellectual disability taxonomy and the modal staff rating of goodness of fit was 4 (on
a 5-point Likert scale).
Qualitative rater feedback was collated thematically and combined with the outputs from 4 user
and carer workshops (attended by 32 users and carers together with 20 support staff). These
results generated relatively minor refinements (e.g. to the pen picture descriptions) rather than
any fundamental changes to the model’s structure.
Stage 2
The final data collection exercise across a 12 month period yielded 2,063 unique patient records
from 6 trusts for patients 18years and older. 55% were male, mean age was 41.7yrs and 6%
were inpatient. 148 cases also had ratings for 6 additional assessment tools and this subset did
not differ significantly from the full submission other than having a higher prevalence of
The data were divided into two: the cases allocated by clinicians to a mental health cluster and
those cases deemed to have a need primarily associated with their intellectual disability.
Independent t-tests for each LDNAT component as well as the overall LDNAT score were
performed on these two groups. The LDNAT total score and two of the three components were
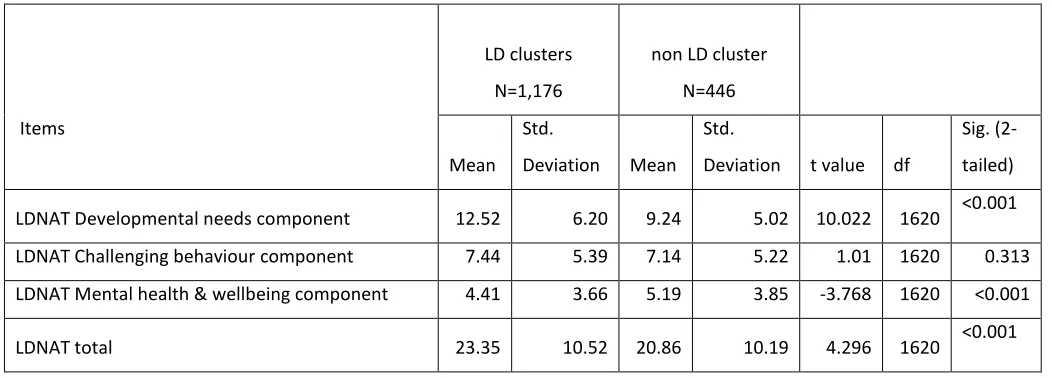
[image:14.612.68.594.204.393.2]found to have statistically significant differences (see table 2).
Table 2. Means, standard deviation and t-test for LD and MH clusters. N=1,622.
Items
LD clusters
N=1,176
non LD cluster
N=446
Mean Std.
Deviation Mean Std.
Deviation t value df
Sig.
(2-tailed)
LDNAT Developmental needs component 12.52 6.20 9.24 5.02 10.022 1620 <0.001
LDNAT Challenging behaviour component 7.44 5.39 7.14 5.22 1.01 1620 0.313
LDNAT Mental health & wellbeing component 4.41 3.66 5.19 3.85 -3.768 1620 <0.001
LDNAT total 23.35 10.52 20.86 10.19 4.296 1620 <0.001
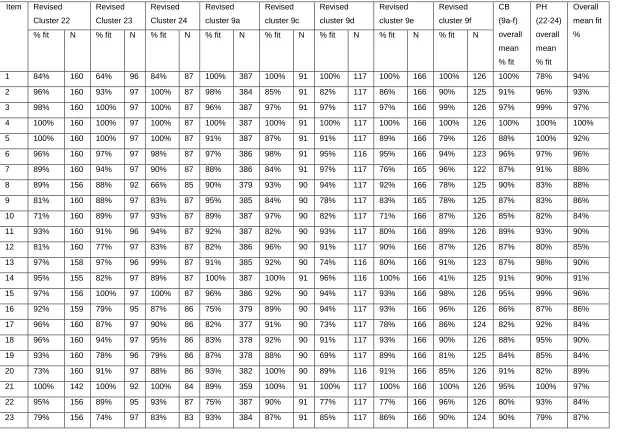
Goodness of fit
As with stage 1, goodness of fit was examined with the aid of a simple scoring matrix that
showed how many of the cases allocated to each cluster by clinicians met the required range for
each LDNAT item. Cluster 9b stood out as problematic due to very low fit. After carefully
revisiting the full stage 1 report regarding its development (available at
http://www.cppconsortium.nhs.uk/ld.php ) it was agreed that cluster 9b should be discarded and
the other challenging behaviour clusters adjusted slightly to accommodate this.
Due to the relatively small number of cases allocated to cluster 9b, the refinements made were
modest and once cases were reallocated on the basis of these updated scoring profiles there
Table 3: Goodness of fit (i.e. percentage of cases fitting each cluster's LDNAT scale ranges) Item Revised Cluster 22 Revised Cluster 23 Revised Cluster 24 Revised cluster 9a Revised cluster 9c Revised cluster 9d Revised cluster 9e Revised cluster 9f CB (9a-f) overall mean % fit PH (22-24) overall mean % fit Overall mean fit % % fit N % fit N % fit N % fit N % fit N % fit N % fit N % fit N
1 84% 160 64% 96 84% 87 100% 387 100% 91 100% 117 100% 166 100% 126 100% 78% 94%
2 96% 160 93% 97 100% 87 98% 384 85% 91 82% 117 86% 166 90% 125 91% 96% 93%
3 98% 160 100% 97 100% 87 96% 387 97% 91 97% 117 97% 166 99% 126 97% 99% 97%
4 100% 160 100% 97 100% 87 100% 387 100% 91 100% 117 100% 166 100% 126 100% 100% 100%
5 100% 160 100% 97 100% 87 91% 387 87% 91 91% 117 89% 166 79% 126 88% 100% 92%
6 96% 160 97% 97 98% 87 97% 386 98% 91 95% 116 95% 166 94% 123 96% 97% 96%
7 89% 160 94% 97 90% 87 88% 386 84% 91 97% 117 76% 165 96% 122 87% 91% 88%
8 89% 156 88% 92 66% 85 90% 379 93% 90 94% 117 92% 166 78% 125 90% 83% 88%
9 81% 160 88% 97 83% 87 95% 385 84% 90 78% 117 83% 165 78% 125 87% 83% 86%
10 71% 160 89% 97 93% 87 89% 387 97% 90 82% 117 71% 166 87% 126 85% 82% 84%
11 93% 160 91% 96 94% 87 92% 387 82% 90 93% 117 80% 166 89% 126 89% 93% 90%
12 81% 160 77% 97 83% 87 82% 386 96% 90 91% 117 90% 166 87% 126 87% 80% 85%
13 97% 158 97% 96 99% 87 91% 385 92% 90 74% 116 80% 166 91% 123 87% 98% 90%
14 95% 155 82% 97 89% 87 100% 387 100% 91 96% 116 100% 166 41% 125 91% 90% 91%
15 97% 156 100% 97 100% 87 96% 386 92% 90 94% 117 93% 166 98% 126 95% 99% 96%
16 92% 159 79% 95 87% 86 75% 379 89% 90 94% 117 93% 166 96% 126 86% 87% 86%
17 96% 160 87% 97 90% 86 82% 377 91% 90 73% 117 78% 166 86% 124 82% 92% 84%
18 96% 160 94% 97 95% 86 83% 378 92% 90 91% 117 93% 166 90% 126 88% 95% 90%
19 93% 160 78% 96 79% 86 87% 378 88% 90 69% 117 89% 166 81% 125 84% 85% 84%
20 73% 160 91% 97 88% 86 93% 382 100% 90 89% 116 91% 166 85% 126 91% 82% 89%
21 100% 142 100% 92 100% 84 89% 359 100% 91 100% 117 100% 166 100% 126 95% 100% 97%
22 95% 156 89% 95 93% 87 75% 387 90% 91 77% 117 77% 166 96% 126 80% 93% 84%
23 79% 156 74% 97 83% 83 93% 384 87% 91 85% 117 86% 166 90% 124 90% 79% 87%
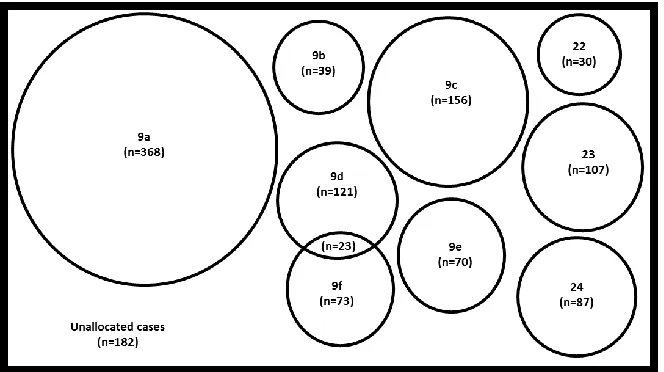
Overlap and coverage checks
Having confirmed the fit for each cluster, the 1,317 cases with all required data items were
re-allocated on the basis of their scoring profiles to confirm coverage and overlap (figure 5).
Figure 5: Venn diagram depicting membership, overlap and coverage of newly developed
clusters.
From this it was apparent that, overall level of coverage had remained relatively stable (83.4%)
whilst the adjustments made to accommodate the removal of cluster 9b had increased the
degree of overlap from 2% to 10%. No further improvements could be made without
compromising either fit, overlap or coverage and thus it was deemed the optimal balance
Internal validity
Replicability
To confirm the stability of the statistical clusters (which underpinned the clinical refinements) the
stage 1 cluster analysis procedure was repeated on the newly gathered data. The resulting
dendrogram confirmed a 5 cluster solution remained appropriate and k-means analysis
produced a similar LDNAT scoring profile for 4 of the 5 original clusters. This can be seen in
[image:17.612.75.553.293.623.2]figure 6.
Figure 6: LDNAT mean scores for stage 1 and stage 2 statistical clusters
The only statistical cluster from stage 1 for which there was a relatively poor fit was cluster 1e.
Overall, however, the congruence between the two sets of statistical clusters was deemed
sufficient to assume that, if a similar process of clinical refinements (from phase 1) had been
indicated an encouraging level of replicability (Speece, 1994) for both the statistically generated
and, by inference, the clinically refined clusters.
External validity
Clinical face validity
Statistical cluster analysis will, by its very nature always yield results (Speece, 1994) these
groups will, however, only be of use if they have meaning and utility in the field (Clatworthy,
Buick, Hankins, Weinman, & Horne, 2005). To some extent the process of clinical review and
refinement had addressed this. However, following the final set of adjustments; descriptive
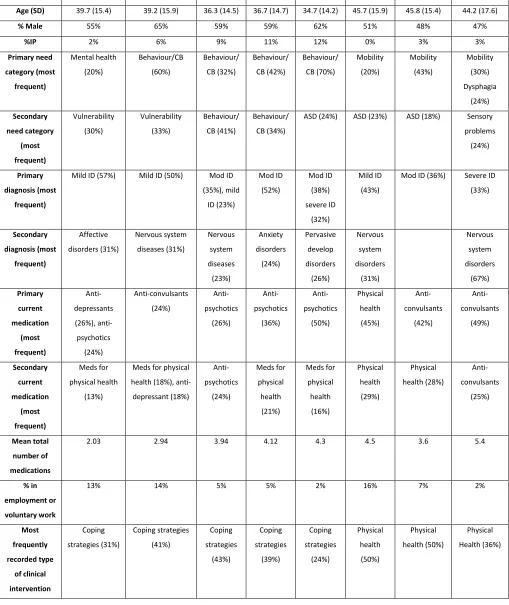
Table 4: Summary of clinical variables by cluster
Variable 9a 9C 9D 9e 9f 22 23 24
Age (SD) 39.7 (15.4) 39.2 (15.9) 36.3 (14.5) 36.7 (14.7) 34.7 (14.2) 45.7 (15.9) 45.8 (15.4) 44.2 (17.6)
% Male 55% 65% 59% 59% 62% 51% 48% 47%
%IP 2% 6% 9% 11% 12% 0% 3% 3%
Primary need category (most frequent) Mental health (20%) Behaviour/CB (60%) Behaviour/ CB (32%) Behaviour/ CB (42%) Behaviour/ CB (70%) Mobility (20%) Mobility (43%) Mobility (30%) Dysphagia (24%) Secondary need category (most frequent) Vulnerability (30%) Vulnerability (33%) Behaviour/ CB (41%) Behaviour/ CB (34%)
ASD (24%) ASD (23%) ASD (18%) Sensory
problems
(24%)
Primary diagnosis (most
frequent)
Mild ID (57%) Mild ID (50%) Mod ID
(35%), mild ID (23%) Mod ID (52%) Mod ID (38%) severe ID (32%) Mild ID (43%)
Mod ID (36%) Severe ID
(33%) Secondary diagnosis (most frequent) Affective disorders (31%) Nervous system diseases (31%) Nervous system diseases (23%) Anxiety disorders (24%) Pervasive develop disorders (26%) Nervous system disorders (31%) Nervous system disorders (67%) Primary current medication (most frequent) Anti-depressants (26%), anti-psychotics (24%) Anti-convulsants (24%) Anti-psychotics (26%) Anti-psychotics (36%) Anti-psychotics (50%) Physical health (45%) Anti-convulsants (42%) Anti-convulsants (49%) Secondary current medication (most frequent) Meds for physical health (13%)
Meds for physical
health (18%),
anti-depressant (18%) Anti-psychotics (24%) Meds for physical health (21%) Meds for physical health (16%) Physical health (29%) Physical health (28%) Anti-convulsants (25%) Mean total number of medications
2.03 2.94 3.94 4.12 4.3 4.5 3.6 5.4
% in employment or voluntary work
13% 14% 5% 5% 2% 16% 7% 2%
Whilst it must be acknowledged that the level of missing data varied significantly by variable
(26-81%), the results remained supportive.
Clinical utility
The mean LDNAT scores for both sets of cluster analyses, together with the resulting clinically
refined clusters were scrutinised to gain a better understanding of their relationship. This is
[image:20.612.67.483.280.549.2]depicted in table 5.
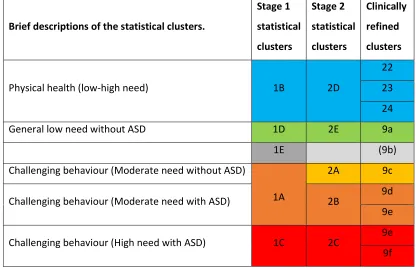
Table 5: A mapping of the stage 1 & 2 statistical clusters with the clinically shaped clusters.
Brief descriptions of the statistical clusters.
Stage 1
statistical
clusters
Stage 2
statistical
clusters
Clinically
refined
clusters
Physical health (low-high need) 1B 2D
22 23 24
General low need without ASD 1D 2E 9a
1E (9b)
Challenging behaviour (Moderate need without ASD)
1A
2A 9c
Challenging behaviour (Moderate need with ASD) 2B 9d 9e
Challenging behaviour (High need with ASD) 1C 2C 9e 9f
Having established the crude relationship of the clusters to each other (figure 5 and table 5) it
was possible to construct a number of hypotheses as to how these clusters might perform
against the 6 independently rated measures. When integrated into the decision tree (figure 2)
the clusters had been divided into two groups: challenging behaviours (9a-f) and physical health
(22-24). In general, it was anticipated that levels of need should increase incrementally across
both of these groups of clusters. N.B. Clusters 23 and 24 were combined due to the relatively
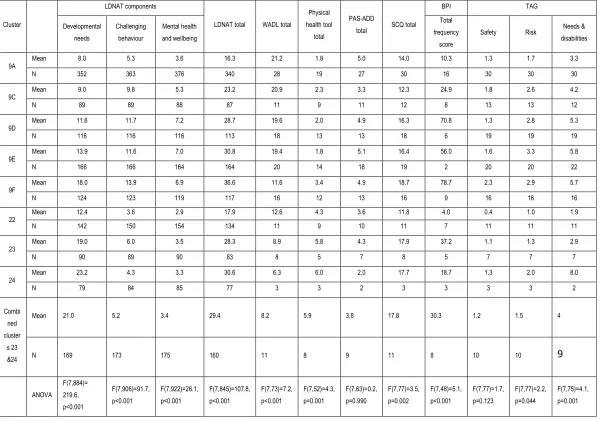
The W-ADL mean scores decreased through both the challenging behaviour (CB) and physical
health (PH) sets of clusters. This confirmed the anticipated increases in general impairment
(also indicated by the LDNAT developmental needs component mean scores). The mean
scores for the bespoke physical health tool showed a logical increase across clusters 22-24
which was again reflected in the LDNAT’s developmental needs component. In terms of mental
health, whilst the PAS-ADD mean scores showed less of a clear trend, in general the CB
clusters scored more highly than the PH clusters (a finding that was mirrored with the LDNAT
mental health and wellbeing component). The SCQ means were obviously lower in clusters 9a
and 9c in comparison to 9d-f (where social communication difficulties were a pre-requisite). The
increasing levels of challenging behaviour anticipated across the CB clusters (and apparent in
the LDNAT challenging behaviour component scores) was matched by the aggression subscale
of the BPI. Finally, the safety and risk subscales of the TAG were notably higher in the CB
clusters than the PH set. Overall therefore the clusters performed largely as anticipated across
Table 6: Performance of the final clusters across 6 treatment domains.
Cluster
LDNAT components
LDNAT total WADL total
Physical health tool
total
PAS-ADD
total SCQ total
BPI TAG
Developmental needs Challenging behaviour Mental health and wellbeing Total frequency score
Safety Risk Needs &
disabilities
9A Mean 8.0 5.3 3.6 16.3 21.2 1.8 5.0 14.0 10.3 1.3 1.7 3.3
N 352 363 376 340 28 19 27 30 16 30 30 30
9C Mean 9.0 9.8 5.3 23.2 20.9 2.3 3.3 12.3 24.9 1.8 2.6 4.2
N 89 89 88 87 11 9 11 12 8 13 13 12
9D Mean 11.6 11.7 7.2 28.7 19.6 2.0 4.9 16.3 70.8 1.3 2.8 5.3
N 116 116 116 113 18 13 13 18 6 19 19 19
9E Mean 13.9 11.6 7.0 30.8 19.4 1.8 5.1 16.4 56.0 1.6 3.3 5.8
N 166 166 164 164 20 14 18 19 2 20 20 22
9F Mean 18.0 13.9 6.9 36.6 11.6 3.4 4.9 18.7 78.7 2.3 2.9 5.7
N 124 123 119 117 16 12 13 16 9 16 16 16
22 Mean 12.4 3.6 2.9 17.9 12.6 4.3 3.6 11.8 4.0 0.4 1.0 1.9
N 142 150 154 134 11 9 10 11 7 11 11 11
23 Mean 19.0 6.0 3.5 28.3 8.9 5.8 4.3 17.9 37.2 1.1 1.3 2.9
N 90 89 90 83 8 5 7 8 5 7 7 7
24 Mean 23.2 4.3 3.3 30.6 6.3 6.0 2.0 17.7 18.7 1.3 2.0 8.0
N 79 84 85 77 3 3 2 3 3 3 3 2
Combi ned cluster s 23 &24
Mean 21.0 5.2 3.4 29.4 8.2 5.9 3.8 17.8 30.3 1.2 1.5 4
N 169 173 175 160 11 8 9 11 8 10 10 9
Discussion
This paper describes the development of eight clusters of need for people with an intellectual
disability. The five ‘challenging behaviour’ and three ‘physical health’ clusters each represent
group of people with similar needs in a way which extends the pre-existing mental health
clusters. These have been developed through an iterative process of participatory action
research that has involved service users, carers, statisticians, academics and multi-disciplinary
groups of clinicians from 18 NHS provider organisations. Over two main stages more than 5000
individuals have been assessed and their data utilized in a variety of ways.
The final version of the clusters, complete with pen pictures, scoring profiles and associated
clinical information is available on request. Having reached the final stage of this study these
have been re-numbered and re-named as follows:
9a Engagement & minor support needs associated with mild learning disabilities (no autism)
9b Behaviour that challenges associated with learning disabilities (no autism)
9c Behaviour that challenges associated with autism and mild learning disabilities
9d Severe behaviour that challenges associated with autism and mild-moderate learning disabilities
9e Severe behaviour that challenges associated with autism and moderate-profound learning disabilities
22 Physical health problems associated with mild learning disabilities
23 Physical health problems associated with moderate - profound learning disabilities
24 Physical health problems associated with moderate - profound learning disabilities & dysphagia
Cluster 9a has generally low levels need whilst clusters 9b-9e describe increasing levels of
challenging behavior (with or without ASD). The physical health-related clusters (22-24) are
split into two levels of severity with the higher level (clusters 23 and 24) distinguished by the
presence / absence of dysphagia.
Cluster analysis has much to offer the field of intellectual disability (Speece, 1994) but, with no
absolute rules as to which methods to select and exactly how to apply them the approach has
understandable and legitimate concerns as to how the resulting classification system could be
used as part of a move away from funding specialist intellectual disability health care through
block contracts where there is a lack of assurance about how resources are allocated to need
(Monitor, 2013). This paper demonstrates a considered approach has been maintained
throughout with judgements made and decisions taken cautiously and transparently.
The dimensional and fuzzy properties of the clusters may have clear advantages over a strictly
categorical diagnostic approach (Vieta & Phillips, 2007). The validity of both approaches can be
challenged but it is also important to avoid conflating issues of validity with utility (Kendell &
Jablensky, 2003). In this way, the two systems should be viewed as complimentary (Trevithick,
Painter, & Keown, 2015).
Overall, with a lack of absolute standards for the validity of classification systems researchers
References:
Appleby, J., Harrieson, T., Hawkins, L., & Dixon, A. (2013). How can payment systems help to
deliver better care ? Authors Payment by Results.
Brooks, W. T., & Benson, B. A. (2013). The validity of the social communication questionnaire in
adults with intellectual disability. Research in Autism Spectrum Disorders, 7(2), 247–255.
http://doi.org/10.1016/j.rasd.2012.10.002
Brown, C., Craig, B., Duncan, J., Green, C., Hunter, R., Ingham, B., … Whitelock, T. (2015).
CPPP - The Legacy. Care Pathways and Packages Project: Developing Currencies for
Mental Health - The Legacy. Wakefield. Retrieved from
http://www.cppconsortium.nhs.uk/admin/files/1427122592CPPP The legacy - March
2015.pdf
Chaplin, R. (2004). General psychiatric services for adults with intellectual disability and mental
illness. Journal of Intellectual Disability Research : JIDR, 48(1), 1–10.
http://doi.org/10.1111/j.1365-2788.2004.00580.x
Clatworthy, J., Buick, D., Hankins, M., Weinman, J., & Horne, R. (2005). The use and reporting
of cluster analysis in health psychology: a review. British Journal of Health Psychology,
10(Pt 3), 329–358. http://doi.org/10.1348/135910705X25697
Department of Health. (2014). 2014 / 15 National Tariff Payment System Annex 7C : Mental
health clustering tool booklet. London: Department of Health. Retrieved from
https://www.gov.uk/government/uploads/system/uploads/attachment_data/file/300663/Ann
ex7C_consultation.pdf
Haverman, M., Perry, J., Salvador–Carulla, L., Noonan Walsh, P., Kerr, M., Van Schrojenstein Lantman-de Valk, H., … Weber, G. (2011). Ageing and health status in adults with
intellectual disabilities: Results of the European POMONA II study. Journal of Intellectual
Disability, 3(1), 49–60.
IBM. (2015). SPSS Software. Retrieved December 11, 2015, from
http://www-01.ibm.com/software/analytics/spss/
Ingham, B., Painter, J., Roy, A., Hastings, R., Robinson, S., & Green, C. (2013). Development
of a needs based payment system for specialist Learning Disability health services Results
http://www.cppconsortium.nhs.uk/admin/files/1372952288LD payment system final report
28june13.pdf
Kendell, R., & Jablensky, A. (2003). Distinguishing between the validity and utility of psychiatric
diagnoses. American Journal of Psychiatry, 160(January), 4–12.
Maenner, M. J., Smith, L. E., Hong, J., Makuch, R., Greenberg, J. S., & Mailick, M. R. (2013).
Evaluation of an activities of daily living scale for adolescents and adults with
developmental disabilities. Disability and Health Journal, 6(1), 8–17.
http://doi.org/10.1016/j.dhjo.2012.08.005
Mascitelli, A. N., Rojahn, J., Nicolaides, V. C., Moore, L., Hastings, R. P., & Christian-Jones, C.
(2015). The Behaviour Problems Inventory-Short Form: Reliability and Factorial Validity in
Adults with Intellectual Disabilities. Journal of Applied Research in Intellectual Disabilities :
JARID, 28(6), 561–71. http://doi.org/10.1111/jar.12152
Monitor. (2013). Closing the NHS funding gap : how to get better value health care for patients.
Moss, S., Prosser, H., Costello, H., Simpson, N., Patel, P., Rowe, S., … Hatton, C. (1998).
Reliability and validity of the PAS-ADD Checklist for detecting psychiatric disorders in
adults with intellectual disability. Journal of Intellectual Disability Research, 42(2), 173–183.
Nascimento, S. (2006). Fuzzy Clustering via proportional membership model. London: IOS
Press.
Rojahn, J., Rowe, E. W., Sharber, A. C., Hastings, R., Matson, J. L., Didden, R., … Dumont, E.
L. M. (2012a). The Behavior Problems Inventory-Short Form for individuals with intellectual
disabilities: Part I: Development and provisional clinical reference data. Journal of
Intellectual Disability Research, 56(5), 527–545.
http://doi.org/10.1111/j.1365-2788.2011.01507.x
Rojahn, J., Rowe, E. W., Sharber, A. C., Hastings, R., Matson, J. L., Didden, R., … Dumont, E.
L. M. (2012b). The Behavior Problems Inventory-Short Form for individuals with intellectual
disabilities: Part II: Reliability and validity. Journal of Intellectual Disability Research, 56(5),
546–565. http://doi.org/10.1111/j.1365-2788.2011.01506.x
Rutter, M., Bailey, A., & Lord, C. (2003). The Social Communication Questionnaire: Manual.
Western Psychological Services.
needs-based approach to making clinical decisions. Journal of Mental Health, 17(1), 33–
48.
Slade, M., Powell, R., Rosen, a, & Strathdee, G. (2000). Threshold Assessment Grid (TAG):
the development of a valid and brief scale to assess the severity of mental illness. Social
Psychiatry and Psychiatric Epidemiology, 35(2), 78–85.
http://doi.org/10.1007/s001270050011
Speece, D. (1994). Cluster analysis in perspective. Exceptionality, 5(1), 19–30.
http://doi.org/10.1207/s15327035ex0501
Trevithick, L., Painter, J., & Keown, P. (2015). Mental health clustering and diagnosis in
psychiatric in-patients. BJPsych Bulletin, 39(3), 119–23.
http://doi.org/10.1192/pb.bp.114.047043
Vieta, E., & Phillips, M. L. (2007). Deconstructing bipolar disorder: a critical review of its
diagnostic validity and a proposal for DSM-V and ICD-11. Schizophrenia Bulletin, 33(4),
886–92. http://doi.org/10.1093/schbul/sbm057
Zachar, P., & Kendler, K. S. (2007). Psychiatric Disorders : A Conceptual Taxonomy. American