of-Things: A Comparative Review
IKPEHAI, Augustine, ADEBISI, B., RABIE, K.M., ANOH, K., ANDE, R.E.,
HAMMOUDEH, M., GACANIN, H. and MBANASO, U.M.
Available from Sheffield Hallam University Research Archive (SHURA) at:
http://shura.shu.ac.uk/23929/
This document is the author deposited version. You are advised to consult the
publisher's version if you wish to cite from it.
Published version
IKPEHAI, Augustine, ADEBISI, B., RABIE, K.M., ANOH, K., ANDE, R.E.,
HAMMOUDEH, M., GACANIN, H. and MBANASO, U.M. (2018). Low-Power Wide
Area Network Technologies for Internet-of-Things: A Comparative Review. IEEE
Internet of Things Journal, p. 1.
Copyright and re-use policy
See
http://shura.shu.ac.uk/information.html
Sheffield Hallam University Research Archive
Internet-of-Things: A Comparative Review
Augustine Ikpehai,
Member, IEEE,
Bamidele Adebisi,
Senior Member
, Khaled M. Rabie,
Member, IEEE
,
Kelvin Anoh,
Member, IEEE,
Ruth E. Ande,
Graduate Student Member, IEEE,
Mohammad Hammoudeh,
Member, IEEE
, Haris Gacanin
, Senior Member, IEEE
and Uche M. Mbanaso,
Member, IEEE
Abstract—The rapid growth of Internet-of-Things (IoT) in the current decade has led to the development of a multitude of new access technologies targeted at low-power, wide area networks (LP-WANs). However, this has also created another challenge pertaining to technology selection. This paper reviews the performance of LP-WAN technologies for IoT, including design choices and their implications. We consider Sigfox, LoRaWAN, WavIoT, random phase multiple access (RPMA), narrow band IoT (NB-IoT) as well as LTE-M and assess their performance in terms of signal propagation, coverage and energy conservation. The comparative analyses presented in this paper are based on available data sheets and simulation results. A sensitivity analysis is also conducted to evaluate network performance in response to variations in system design parameters. Results show that each of RPMA, NB-IoT and LTE-M incurs at least 9 dB additional path loss relative to Sigfox and LoRaWAN. This study further reveals that with a 10% improvement in receiver sensitivity, NB-IoT 882 MHz and LoRaWAN can increase coverage by up to 398% and 142% respectively, without adverse effects on the energy requirements. Finally, extreme weather conditions can significantly reduce the active network life of LP-WANs. In particular, the results indicate that operating an IoT device in a temperature of -20◦C can shorten its life by about half; 53% (WavIoT, LoRaWAN, Sigfox, NB-IoT, RPMA) and 48% in LTE-M compared with environmental temperature of 40◦C.
Index Terms—Access technologies, low-power wide area net-work (LP-WAN), Internet-of-things (IoT), LoRaWAN, Sigfox, sensitivity analysis, energy conservation, link budget, WavIoT, random phase multiple access (RPMA), LTE-M, narrow band IoT (NB-IoT).
I. INTRODUCTION
B
y 2025, up to 75 billion devices would be connectedin Internet-of-things (IoT), with potential economic impact of around $11.1 trillion a year [1], [2]. The key underpinning of IoT is the large number of interconnected devices that exchange information and enable services.
A. Ikpehai, B. Adebisi, K.M Rabie, K. Anoh, R. E. Ande
and M. Hammoudeh are with the Faculty of Science &
Engineering, Manchester Metropolitan University, Manchester, M1 5GD, UK. (e-mails: [email protected]; [email protected]; [email protected]; [email protected]; [email protected]; [email protected]).
Haris Gacanin is a research director with Nokia, Copernicuslaan 50, 2018 Antwerp, Belgium. (e-mail: [email protected])
Uche M. Mbanaso is with Centre for Cyberspace Studies,
Nasarawa University, Keffi, Nasarawa State, Nigeria. (e-mail: [email protected])
This work was supported in part by “CityVerve: IoTs and Smart Cities Demonstrator” project funded by Innovate UK under Grant 102561 and in part by “Triangulum” (part of H2020 Smart Cities and Communities programme) funded by the European Commission under Grant 646578-Triangulum-H2020-2014-2015/H2020-SCC-2014.
Although IoT connectivity will be dominated by short-range technologies for many years, the work [3] predicts that by 2025, 25% of wireless industrial IoT connections will be provided with LP-WAN technologies including
LoRa1, Sigfox, LTE-M as well as NB-IoT. This signifies
the continued importance of LP-WAN as the IoT landscape evolves.
Machine-to-machine (M2M) communication in IoT rep-resents a very large market, growing rapidly at compound annual growth rate of over 20% [5]. Nevertheless, the mar-ket is fragmented and awash with many access technologies and vertical solutions that sometimes do not interoperate. The result is that despite the potentials of IoT, organisations and end users are faced with overwhelming choices of access technologies. Therefore, it becomes challenging to decide where or how to begin their IoT road map as part of their wider digital transformation journey. Insufficient comparative studies of LPWAN technologies has been identified as one of the major barriers to potential IoT users [6]. This study does not involve detailed physical or media access control (MAC) layer specifications, the results nevertheless provide indicative performance of the LP-WAN technologies set-up under the same operating conditions.
Until now, most of the studies independently evaluated LP-WAN technologies in different operating environments. The main reason is that many of the leading technologies are based on proprietary protocols whose detailed specifications are not freely available in the public domain. For example, LoRaWAN and Sigfox are the top two LP-WAN technolo-gies in terms of installed base. The underlying chirp spread spectrum (CSS) modulation technique in the physical layer of LoRa is proprietary and owned by Semtech Corporation. On the other hand, Sigfox deploys and operates the net-work but freely provides the protocol specification to chips manufacturers. Thus, LoRa is a closed chipset but open network; (even private networks are possible) and Sigfox is a closed network but open chipset. The implication is that in the former, Semtech controls the production, support and price of LoRa chipsets, while in the latter, Sigfox controls the provision, access and price of the network resources. Other technologies are different variants of either proprietary physical or MAC layer. Hence, no mainstream LP-WAN protocol stack is currently fully open.
However, given the scope of IoT, it is important for solution providers, system designers and users to have a wide perspective of LP-WAN options without being
locked-1In this paper, LoRa denotes the physical layer modulation only, while
in. Motivated by that gap, the objective of this paper is to assess the performance of the widely available LP-WAN technology specifications. The system parameters used are mostly drawn from the datasheets of the respective device manufacturers.
The contribution of this work is two-fold. First, we identify an approach to optimise the LP-WAN by exploiting the link budget and design parameters without increasing the energy requirements of the system. The second contribu-tion resides in identifying the multi-variate dependence of energy consumption on field, application and technology-specific characteristics, each of which can be exploited to different extents. These results provide useful insights which are extremely valuable when deciding the trade-off between network performance, design complexity and cost.
II. RELATEDWORK
LP-WAN technologies are increasingly being deployed as last mile connectivity to compliment traditional technolo-gies and replace them in many use-cases. However, majority of existing studies that compare the LP-WAN technologies are either literature reviews [7]–[11] or brief experiments with two or three technologies and are often focused on a single aspect of the systems. The studies neither include rigorous analysis of multiple performance metrics nor inves-tigate how the technologies perform relative to each other in different environments, using identical system parameters. In some evaluation cases, the technologies were tested in one environment and are therefore limited in scope.
In many of the studies where practical systems were designed, comparisons were not made with competing LP-WAN solutions. In fact, in some of the experiments, single technology was deployed for particular use-case which also limits the assessment outcomes to type-specific scenarios [12], [13]. In some other works, the comparisons were restricted to physical and associated MAC layers only while some evaluation studies focused on either cellular-only or non-cellular LP-WAN technologies [5], [14], [15]. However, as some of the LP-WAN technologies are still at their infancy, many practical issues are being resolved. Thus, a cross-cutting comparison will not only identify suitability for specific applications but also ascertain among the LP-WAN specifications, the extent of design diversity in relation to the network performance.
LoRaWAN is currently one of the most deployed LP-WAN access networks for IoT [16] and also one of the widely reported LP-WAN technologies in literature. Signal propagation is crucial in IoT [17] as it affects network performance in terms of coverage, reliability and data rate. Path loss and coverage have been reported in many LP-WAN studies including LoRa [18] and NB-IoT [19] while [20] proposed an indoor channel attenuation model for LoRa, following a series of measurement campaigns. A few other empirical studies such as [21] compared the perfor-mance of LoRa’s CSS modulation scheme with frequency-shift keying (FSK). The paper found that coverage and network reliability are both affected by the payload size. However, the experiments were limited to the university environment and the results did not provide insights into po-tential behaviours in other environments. More challenging terrains such as dense urban areas and other metropolitan
environments with higher levels of interference may exhibit different performance due to difference in the interference sources and patterns. This will not only provide additional insights but also help to analyse the results in the context of individual field environment.
For cellular LP-WANs, [22] investigated the capacity and coverage of LTE-M and NB-IoT in a rural area in Denmark. The paper reported that cellular technologies such as LTE-M support maximum coupling loss of about 156 dB, however, in deep indoor applications can experience up to additional 30 dB penetration loss. An interesting aspect would be a comparison with non-cellular technologies.
Apart from the various analytical models that have been reported [23]–[25], other experimental studies have been conducted to individually evaluate different aspects of LP-WAN including coverage [26], [27], energy consumption [28], capacity [22], [29], [30] and scalability [23], [24], [30]. The main commonality in these and many other existing studies is that they mostly focused on one or two technologies. Comparing results from different studies may not provide a balanced view as each experiment or simulation model is conducted with a set of assumptions or conditions which varies across studies and authors.
According to [31], until recently, there were very few studies involving more than three technologies. Although, [31] compared the performance of GPRS and NB-IoT with Sigfox and LoRa, the dearth of publications in this area suggests that a considerable amount of follow-on work still needs to be carried out. The objective of this paper is therefore to contribute in that regard.
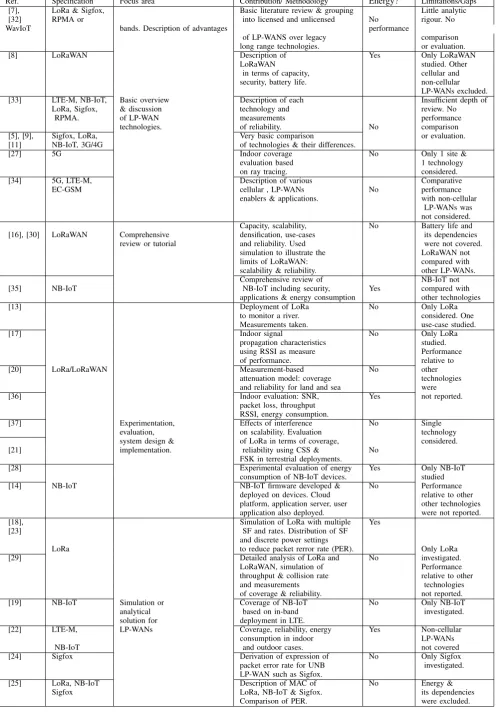
Recent reviews of LP-WANS are summarised in Table I according to their areas of focus. Many of them de-scribe single technologies while energy consumption was not considered in most. However, given its importance in IoT generally and LP-WANs in particular, it is necessary to consider the energy performance of existing LP-WAN technologies as part of a complete system review.
III. LINKBUDGET ANDIMPLICATIONS INLP-WANS
LP-WANs in IoT access networks share similar imple-mentation methodologies with traditional wireless networks but with some differences in system design. According to Shannon-Hartley theorem, the signal-to-noise ratio (SNR) of each bit can be written as [38]
Eb
N =
ε C
2Cε −1
= 2
η−1
η (1)
whereC is the capacity (in bits/s),ε is the bandwidth and
η is the spectral efficiency (in bits/s/Hz). For a bit duration
of (1/C) seconds, if S denotes the average signal power
of each bit and N the noise power in Watts, the average
energy per bit is Eb= CS (in J) and the total noise power
is N ·ε Watts. The implication of (1) is that, Eb
N varies
withηand the modulation scheme in LP-WAN technologies
must ensure that η is maximised. For a wireless signal to
be correctly decoded at the receiver, it must meet energy
detection threshold. The receiver sensitivity (σ) can be
expressed as [39]
σ= Eb
Table I:Summary of Related Work
Ref. Specification Focus area Contribution/ Methodology Energy? Limitations/Gaps
[7], LoRa & Sigfox, Basic literature review & grouping Little analytic
[32] RPMA or into licensed and unlicensed No rigour. No
WavIoT bands. Description of advantages performance
of LP-WANS over legacy comparison
long range technologies. or evaluation.
[8] LoRaWAN Description of Yes Only LoRaWAN
LoRaWAN studied. Other
in terms of capacity, cellular and
security, battery life. non-cellular
LP-WANs excluded.
[33] LTE-M, NB-IoT, Basic overview Description of each Insufficient depth of
LoRa, Sigfox, & discussion technology and review. No
RPMA. of LP-WAN measurements performance
technologies. of reliability. No comparison
[5], [9], Sigfox, LoRa, Very basic comparison or evaluation.
[11] NB-IoT, 3G/4G of technologies & their differences.
[27] 5G Indoor coverage No Only 1 site &
evaluation based 1 technology
on ray tracing. considered.
[34] 5G, LTE-M, Description of various Comparative
EC-GSM cellular , LP-WANs No performance
enablers & applications. with non-cellular
LP-WANs was not considered.
Capacity, scalability, No Battery life and
[16], [30] LoRaWAN Comprehensive densification, use-cases its dependencies
review or tutorial and reliability. Used were not covered.
simulation to illustrate the LoRaWAN not
limits of LoRaWAN: compared with
scalability & reliability. other LP-WANs.
Comprehensive review of NB-IoT not
[35] NB-IoT NB-IoT including security, Yes compared with
applications & energy consumption other technologies
[13] Deployment of LoRa No Only LoRa
to monitor a river. considered. One
Measurements taken. use-case studied.
[17] Indoor signal No Only LoRa
propagation characteristics studied.
using RSSI as measure Performance
of performance. relative to
[20] LoRa/LoRaWAN Measurement-based No other
attenuation model: coverage technologies
and reliability for land and sea were
[36] Indoor evaluation: SNR, Yes not reported.
packet loss, throughput RSSI, energy consumption.
[37] Experimentation, Effects of interference No Single
evaluation, on scalability. Evaluation technology
system design & of LoRa in terms of coverage, considered.
[21] implementation. reliability using CSS & No
FSK in terrestrial deployments.
[28] Experimental evaluation of energy Yes Only NB-IoT
consumption of NB-IoT devices. studied
[14] NB-IoT NB-IoT firmware developed & No Performance
deployed on devices. Cloud relative to other
platform, application server, user other technologies
application also deployed. were not reported.
[18], Simulation of LoRa with multiple Yes
[23] SF and rates. Distribution of SF
and discrete power settings
LoRa to reduce packet rerror rate (PER). Only LoRa
[29] Detailed analysis of LoRa and No investigated.
LoRaWAN, simulation of Performance
throughput & collision rate relative to other
and measurements technologies
of coverage & reliability. not reported.
[19] NB-IoT Simulation or Coverage of NB-IoT No Only NB-IoT
analytical based on in-band investigated.
solution for deployment in LTE.
[22] LTE-M, LP-WANs Coverage, reliability, energy Yes Non-cellular
consumption in indoor LP-WANs
NB-IoT and outdoor cases. not covered
[24] Sigfox Derivation of expression of No Only Sigfox
packet error rate for UNB investigated.
LP-WAN such as Sigfox.
[25] LoRa, NB-IoT Description of MAC of No Energy &
Sigfox LoRa, NB-IoT & Sigfox. its dependencies
Table II: Link Budget of LP-WAN Technologies used in the simulation [4], [31], [47]–[52]
Technology NB-Fi (WavIoT) LoRaWAN U-NB(Sigfox) RPMA (Ingenu) LTE-M NB-IoT
868MHz 868MHz 868MHz 2.4GHz 1.8-2.7GHz 700-2100 MHz
Downlink DL DL DL DL DL(2.6GHz) DL(882MHz,1840MHz)
Tx Power, dBm 30 21 24 21 40 35
Tx cable loss,dB -3 -3 -6 -3 -3 -3
Bandwidth (kHz) 0.1 125 0.1/0.6 1000 1400 180
Tx antenna gain, dBi 0 9 9 9 10 16
σ, dBm -147 -137 -129 -133 -129 -141
Rx env. noise 0 0 0 0 0 0
Rx antenna gain 0 0 0 8 0 0
Total (link budget) 174 164 156 168 176 189
Obstacle loss (fixed), dB 20 20 20 30 30 30
Obstacle loss (variable), dB 35.8 28.1 30.7 29.8 27.1 29.4
The noise figure (φ) is typically around 2 to 6 dB for
LP-WAN radio front-end [39], [40].
In many access networks such as Sigfox and LoRaWAN, each message sent by the end node can be received by multiple gateways. According to [41]–[43], the potential throughput available per coverage unit can be expressed as
R(λ, θ) =λ·log2(1+θ)Pr(SNR≥θ), (3)
where λ is the gateway density, Pr(.) is the probability
operator, θ is the threshold SNR and R is the potential
throughput in bps/Hz/km2. However, (3) assumes fixed
data rate and does not provide rate adaptation such that the bit rate of a gateway is adjusted upward or downward according to the SNR instead of outage when the receiver
SNR < θ. On the other hand, the average area spectral
efficiency (ASE) also in bps/Hz/km2 considers SNR of
individual gateway and avoids outage at low SNR by reducing the data rate instead, this is more amenable to IoT scenarios. The ASE can be expressed as [44]
E(λ)=λ·E[log2(1+SNR)], SN R≥θ. (4)
Equation (4) supports bit rate adaptation according to the SNR instead of outage. According to [41]–[44], ASE
de-pends on the number of gateway perkm2and path loss. The
value ofσ can also be reduced to extend the transmission
range, however, the performance penalty is reduced bit rate which is acceptable in many IoT deployment scenarios. This systematic trade-off underpins the long range operation
of LP-WAN technologies. The value ofσ in LP-WANs is
typically lower than -128 dBm (-129 dBm to -155 dBm) and ranges from -90 dBm to -110 dBm [45] in traditional wireless systems such as Wi-Fi [46]. The implication is that in terms of absolute signal power in Watts, LP-WAN receivers can detect wireless signals that are 1000 times weaker than Wi-Fi and other technologies with -100 dBm sensitivity. LP-WAN technologies exploits this capability in the various specifications.
[image:5.595.52.547.70.195.2]Table II presents the technical specifications of widely-available LP-WAN technologies from datasheets [4], [47], [48], measured obstacle losses in European urban envi-ronments [48] as well as other parameters reported in literature [31], [49]–[52]. It is generally desirable that the main lobe of the transmitted radiation pattern reaches the receiver to ensure that maximum signal strength and coverage are delivered. The field condition can be worsened by obstruction losses which will further reduce the link budget. The fixed obstacle losses in Table II are the reported
Table III: Additional Simulation Parameters
Parameter Value
Number of gateways 1
Baseline payload 12 bytes
Radio electronics energy,Eelec 50 nJ/bit
On-Air time Sigfox-EU:6.24s
LoRa (varies with SF)
Background noise, dBm -130 dBm
Battery model E91-AA alkaline battery
average values obtained from measurements in urban areas in Europe through 20 cm concrete walls [48].
The parameters in Tables II and III are used to simulate the transmission from gateway to end device based on the scenario described in the next section. Sigfox and LoRa are two leading LP-WAN technologies. However, Sigfox supports a maximum payload of 12 bytes while LoRa can support up to 242 bytes [36], [53], [54]. In order to compare the technologies, we adopt Sigfox payload as the baseline in Table III. Energy consumed by the radio electronic circuit in low-power devices such as wireless sensors has been reported to be about 50 nJ/bit [55], [56]. The choice of Alkaline battery is informed by the fact that they are low-cost, widely available and are commonly used in low-power applications such as wireless sensor networks. In Europe, at 100 kbps, it takes about 2.08 s [57] to send a 12-byte Sigfox frame and since the endpoints do not synchronise with Sigfox base station, each message is sent three times to improve chances of detection [5], [58].
IV. NETWORKMODEL ANDMETHODOLOGY
[image:5.595.51.540.70.197.2]the simulation using MATLAB. The 3GPP recommends in-band deployment for LTE-M using existing LTE installed base. In this paper, we adopt the 2.6 GHz for LTE-M as it is widely used in Europe and beyond in existing LTE systems.
Although NB-IoT supports three modes of deployment, namely; standalone, in-band LTE and guard band in LTE, it can also coexists with GSM, LTE and UMTS [60]. We adopt 882 MHz and 1840 MHz for NB-IoT which are equivalent to bands 5 and 3 downlink frequencies respectively, in 3GPP NB-IoT (release 13) [49]. These choices are informed by the fact that many mobile operators already own blocks of frequency in 1800 MHz band and 800 MHz-900 MHz used for various services such as GSM and LTE. This clearly provides an upgrade path to NB-IoT for such operators through frequency re-farming.
In IoT access network design and implementation, the three most critical questions are:
i) what is the maximum distance the link can cover
without compromising quality-of-service (QoS) or SNR,
ii) what field parameters can be explored to reduce
cost of implementation and
iii) what endogenous variables can be tweaked to
conserve energy [61] and optimise network per-formance.
To address these questions, the methodology adopted is summarised as follows.
1) Use of system-specific attributes of WavIoT, Sigfox, LoRaWAN, RPMA and LTE-M to generate propa-gation characteristics including Fresnel clearance and path loss.
2) Application of equal transmit power across the tech-nologies, followed by estimation of the corresponding coverage at each power level in rural and urban environments.
3) For each technology, the path loss information previ-ously calculated is extracted and used to generate the received signal strength indicator (RSSI) as well as SNR at different distances in the field. SNR is bench-marked against 20 dB widely used in conventional wireless systems.
4) As coverage is more challenging in urban areas, a sensitivity analysis is conducted for urban deployment scenario with a view to exploiting system parameters for network performance optimisation.
5) Investigation of the key factors affecting energy con-sumption in end devices.
6) For specific LP-WAN system configurations, estimate the battery life of the radio transceiver based on 1% maximum duty cycle allowed in Europe.
While there are no simple or direct answers to the questions posed, the following sections illustrate these issues and provides insights to different aspects of the questions with some rationales.
V. SIGNALPROPAGATION
A. Fresnel Clearance
Ideally, radio waves should travel in a straight line from the source to destination. An obstruction that is close to
or infringing the LoS causes attenuation. For the given scenario, the Fresnel clearance is illustrated in Fig. 1.
The Fresnel zone radius at a point P along the LoS is generally defined as [62]
Fzr = s
n·cd1d2
f ·D =17.32
s d1d2
f ·D (5)
wheren= 1denotes the first Fresnel zone,cis the speed of
light,f is the frequency in GHz andD=d1+d2is the total
distance in km. In reality, at least 60% Fresnel clearance is required.
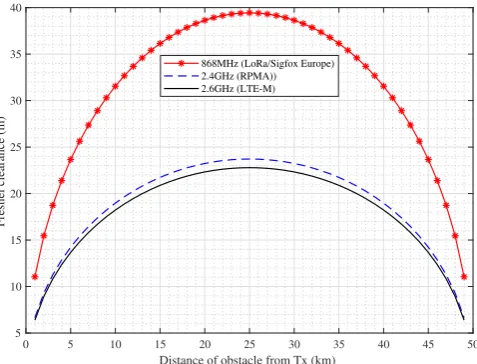
By applying (5), Fig. 2 presents the minimum clearance requirements for 868 MHz, 2.4 GHz and 2.6 GHz LP-WAN technologies as the obstacle is moved to different points along the transmission path in a 50 km network. It can be seen that the required Fresnel clearance increases as the obstacle moves towards the midpoint such that the largest clearance is required if the obstacle is positioned at the middle. Fig. 2 further shows that when the obstacle is moved from 1km to 5 km then 25 km, with LTE-M, the minimum clearance increases from 6.38 m to 13.67 m then 22.79 m, respectively. In the Sigfox/LoRaWAN networks with the obstacles at the same positions, the minimum Fresnel clearance are respectively 11.04 m, 23.66 m and 39.44 m. The key observation here is that the closer the obstruction to the gateway transmitter, the more impact it has on the access network.
B. Path Loss
Path loss estimation is a crucial part of planning and design of the access networks. In wireless communication, every time the distance is doubled, only one-fourth of the signal power is received and this has some far-reaching implications for connectivity in IoT as it degrades the SNR at the end receiver. The path loss discussed in this paper relates only to outdoor applications. The Free Space Path Loss (FSPL) model is based on clear LoS and does not take into account terrestrial objects such as hills, trees, buildings, etc. In ideal case, the path loss experienced by signals can be expressed as
FSPL(dB) =20 ·log10l+20 ·log10f −32.44 (6)
where l is the distance (in km) and f is the frequency (in
Hz). However, the assumption of free space between the transmitter and receiver in FSPL is invalid in many real life deployments, as RF paths are typically laden with additional factors which further degrade the path loss. Such factors include [63] cable losses, antenna gain, LoS condition, receiver sensitivity, etc. Particularly in IoT, a wireless signal will typically encounter different obstacles on its path and each has an additive effect on the total path loss. Common examples of obstacles and their attenuation factors are summarised in Table IV.
Fresnel zone
Rx Tx
ht hg
d1 d2
Fresnel radius
obstacle
P
Figure 1: LoS condition and Fresnel clearance
0 5 10 15 20 25 30 35 40 45 50
Distance of obstacle from Tx (km) 5
10 15 20 25 30 35 40
Fresnel clearance (m)
[image:7.595.142.456.60.228.2]868MHz (LoRa/Sigfox Europe) 2.4GHz (RPMA)) 2.6GHz (LTE-M)
Figure 2: Effects of obstacle position on Fresnel clearance
Table IV: Examples of materials and signal attenuation at 2.4 GHz [63], [64]
Material/object Attenuation Frequency
Dry wall 3dB 2.4GHz
Glass wall with metal frame 6dB 2.4GHz
Office window 3dB 2.4GHz
Metal door (non-solid) 6dB 2.4GHz
Wood 3dB 2.4GHz
Solid concrete (e.g. wall, bridge) 8-15dB 2.4GHz/1.3GHz
Aluminum siding 20.4dB 815MHz
Concrete floor 10dB 1.3GHz
6-inch diameter metal pole 3dB 1.3GHz
from metallic surfaces, diffraction or even scattering off the lampposts and moving vehicles which contribute to the overall losses. If multiple copies of the signal arrive the receiver, they can destructively interfere and severely degrade reception. The path loss can be expressed as
σ=Pt+Gainnet−PL (7)
where σ is the receiver sensitivity, P L is total the path
loss in dB andGainnetis the net gain. The Gnet includes
all gains resulting from transmit and receive antenna as well as all losses related to the radio and antenna hardware including filters, cables, attenuators, antennas and obstacle
losses, etc. The σ in (7) is equivalent to the minimum
signal power that will be detected by the receiver. The
IoT implementation engineer must therefore ensure that the
received power is often greater than σ.
1) LP-WAN and Signal Propagation in Different Ter-rains: From (7), it is clear that adequate knowledge of the terrain is required in the network design. Some models de-rived from empirical studies have been reported to provide more realistic path loss. In particular, the Hata-Okumura model, which is based on various Okumura correction functions is widely used for predicting path loss in radio frequency (RF) planning in the wireless communication industry. The key strength of this model is that it caters for different field scenarios such as large cities, small suburban and rural environments [65]–[68] which has influenced its wide acceptance. In its general form, the model can be expressed as
PLHata =69.55 + 26.16·log10f−13.82·log10hg−
a(ht) + [44.9−6.55·log10hg]log10d−ct
(8)
where f is the frequency (in MHz), hg is the gateway
antenna height (in m) and d is the distance (in km) from
transmitting to receiving antenna. The terrain parameter a(ht)is a function of IoT terminal height, defined for urban
areas as
a(ht)(urban)=3.20[log10(11.75ht)]2 −4.97 (9) for suburban, open and rural areas, a(ht)is defined as
a(ht)(sub−rural)= [1.1·log10f−0.7)]ht−
[1.56·log10f−0.8]
(10)
wherehtis the height of the remote terminal (IoT endpoint)
antenna above the ground. Also, the parameter ct is the
correction factor defined as
ct =
4.78·[log10f]2−18.33·log10f+ 40.94 rural/open
2hlog10
f
28
i2
+ 5.4 suburban
0 urban
[image:7.595.55.294.268.450.2]0 5 10 15 20 25 30 35 40 45 50 80
100 120 140 160
rural
0 5 10 15 20 25 30 35 40 45 50
Distance (km) 100
120 140 160 180
Path Loss (dB)
suburban
[image:8.595.67.290.61.244.2]868MHz Europe (LoRa/Sigfox) 2.4GHz (RPMA) 2.6GHz (LTE-M)
Figure 3: Path loss of access technologies in rural and suburban environments
0 5 10 15 20 25 30 35 40 45 50
100 120 140 160 180
200 small city
0 5 10 15 20 25 30 35 40 45 50
Distance (km) 100
120 140 160 180 200
Path Loss (dB)
large city
[image:8.595.68.290.295.478.2]868 MHz (LoRa/Sigfox Europe) 2.4 GHz (RPMA)) 2.6 GHz (LTE-M)
Figure 4: Path loss of access technologies in urban environments
By applying (8)-(11) using the parameters in Tables II and III, Figs. 3 and 4 respectively, illustrates the path loss in urban and rural environments for the scenario presented in Fig. 1. These results generally agree with the literature, for instance Fig. 3a closely aligns with the coupling loss of 156 dB reported in [22] for LTE-M. It can be seen in Fig. 3 that at a distance of 3 km between the transmitter and receiver, RPMA and LTE-M each incurs additional path loss of about 9 dB and 11 dB in rural and large cities respectively, relative to Sigfox/LoRaWAN. At 10 km, the additional path loss experienced by RPMA and LTE-M are 8.2 dB and 9.2 dB in rural areas as well as 12 dB and 13 dB respectively in large cities (compared with Sigfox/LoRaWAN). These results are within the range of those in [6], [27] which reported that LP-WAN could achieve up to 20 dB improvement over cellular systems. It is also noted that RPMA and LTE-M are more susceptible to path loss than LoRaWAN and Sigfox. The amount of loss also depends on the nature of the obstacle (Table III), the results in this subsection however show that as the frequency increases, the ability to overcome obstacles drastically reduces. The 868 MHz technologies require significantly taller masts or towers.
If that is considered against the fact that attenuation is more pronounced in the > 2 GHz region and many ISM radio equipment (e.g. Wi-Fi, ZigBee) also share the 2.4 GHz band, then the system designers and implementation engineers need to consider the delicate balance between network reliability, cost and efficiency in the choice of radio technology. Although more bandwidth is available in 2.4 GHz and 2.6 GHz compared to 868 MHz, however Figs. 3 and 4 show that at every distance, the 2.x GHz technologies (RPMA, LTE-M) incur at least 9 dB additional path loss which suggests that they are less able to overcome the effects of obstacles.
2) Non LoS (NLOS) Propagation : For IoT applications in urban environments lined with high rise buildings and tall street furniture, NLOS links arise when the gateways and IoT end points are located on two parallel or intersecting streets. With a rectangular street grid, signals experience reflection off the walls as well as diffraction at the building corners [69] and other vertical structures such as lamp posts and bus stop signage, located near the street junction or parallel street. In such cases, the arriving signals undergo multiple reflections from the walls on the main and side streets as well as scattering around the vertical objects. The 1-turn path loss, relative to free space can be expressed as [70]
P L1−T urn=P LLOS.
cos2ϕ
S2 .
x1x2
x1+x2
(12)
where x1, x2 are the distances from the intersection to
gateway and end device respectively, S is the scattering
parameter andϕ is the viewing angle from the gateway to
end device which depends on the heights of the antennas.
The P LLOS term in (12) is the ITU-LOS path loss model
defined as
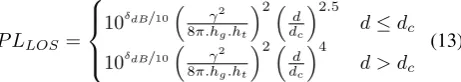
P LLOS=
10δdB/10 γ2
8π.hg.ht
2
d dc
2.5
d≤dc
10δdB/10 γ2
8π.hg.ht
2
d dc
4
d > dc
(13)
Where δ is the environmental parameter, d is the total
distancex1+x2anddcis the cross-over distance. In general,
P LLOS will vary across different environments, depending
on building heights, antenna height and the amount of waveguide provided by the street canyon. By employing a virtual source at the centre of the intersection and capturing local street variables such as main street width, side street width as well as distance from gateway antenna to the main street wall, it has been reported that the NLOS path loss can be written as [71], [72]
P LN LOS=
10.log10
1
δ
q
2π wt.xt.
4πx1x2
γ
2
d≤dc
10.log10
1
δ
q
2π wt.xt.
4πx1x22
γ.dc
2
d > dc
(14)
where wt, xt are the main street width and distance from
gateway to the wall respectively. While (13) includes the waveguide and 1-turn corner-turning effects of the path, (14) captures local street characteristics in addition. We
have chosen wtto cater for shared surface street (used by
[image:8.595.312.543.477.518.2]0 200 400 600 800 1000 1200 1400 1600 1800 2000 Distance from Rx to center of intersection (m)
60 80 100 120 140 160 180 200 220 240
Path loss (dB)
LoRa/Sigfox/WavIoT RPMA(Ingenu) LTE-M
(a) Gateway height 8m, end device height 0.5m
0 200 400 600 800 1000 1200 1400 1600 1800 2000
Distance from Rx to center of intersection (m) 60
80 100 120 140 160 180 200 220 240
Path loss (dB)
LoRa/Sigfox/WavIoT RPMA(Ingenu) LTE-M
[image:9.595.61.549.63.258.2](b) Gateway height 8m, end device height 2m
Figure 5: Non LOS path loss in urban environment withS=f−0.024[69],δ= 7, wt= 7, xt= 2
assume a regular shaped junction such that main and side streets are of equal widths.
Fig. 5 illustrates the effects of dc and street
char-acteristics on NLOS path loss in urban street canyons for low and medium altitude IoT applications. The path loss significantly increases when d > dc. In other words,
reflection dominates the path loss when the receiving end device is close to the street junction, up to the cross over
distancedc. This is because the rays from the main street
bend and arrive on the side street at an incidence angle
close to 90◦ which results in very little or no refraction.
Thereafter, the signals are reflected multiple times as they propagate further down the side street. Hence, for end devices located far from the junction, (beyonddc), the path
loss is dominated by diffraction. By increasing the height of the end device from 0.5 m to 2 m, Fig. 5 shows that the
path loss immediately after dc in LoRa (146 m), RPMA
(403 m) and LTE-M (436 m) can be reduced by 77.24 dB, 86.07 dB and 86.78 dB respectively.
VI. NETWORKPERFORMANCEANALYSIS
In this section, we compare performance of the various LP-WAN technologies using the system parameters in each specification according to its data sheet and the scenario in the previous section. A sensitivity analysis is also conducted for each specification in urban area. The outcomes provide useful insights for attaining the trade-off between network optimisation and design complexity on one hand and cost on the other. We also examine the energy consumption and its dependencies in different use-cases. The battery life and energy consumption discussed in this subsection are with respect to the radio transceiver and includes transmit and receive consumption only. Other device components such as micro-controller unit (MCU), wait windows, sleep currents, and other latent consumption in the system are not included.
A. Coverage
One of the key performance metrics in wireless systems is the communication range. Given the scale of IoT in terms of applications, one of the challenges is how to ensure
that the selected access technology is capable of providing adequate coverage for the area of interest. While coverage is relatively less constrained in rural and open areas, it is more challenging in large urban environments such as metropolitan areas with heavy presence of high-rise modern buildings, road side furniture such as street lights (lamp posts) and other man-made obstacles that reduce signal strength. By substituting (8)-(11) into (7), the maximum range can be expressed as
R= 10
(Pt+Gainnet−σ−y1 +y2 +kt)
bh (15)
wherey1= 69.55 + 26.16·log10f ,y2= 13.82·log10hg,
kt=a(ht) +ctandbh= 44.9−6.55·log10hg.
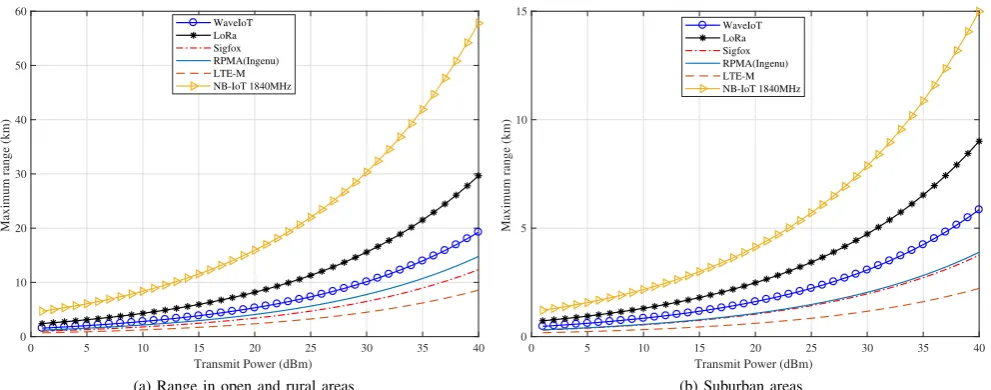
Fig. 6 illustrates the maximum range achievable in ru-ral and suburban areas using the main access technology specifications outlined in Table II. In particular, this figure shows that the coverage of each technology is dependent on the transmit power. In practice, coverage will vary among sites depending on the field characteristics. For example, the presence of multiple obstacles such as trees or walls along the propagation path will also add to the attenuation of signal power. It is seen in Fig. 6 that in rural areas, using equal transmit power in the specifications considered, NB-IoT offers a significantly wider coverage (57.79 km at 40 dBm) than LTE-M (8.57 km at 40 dBm) in the cellular domain while LoRaWAN offers the longest range (29.67 km) among the non-cellular LP-WAN technologies. Overall, NB-IoT provides the widest coverage out of the six specifications considered. Although, Table II indicates that LTE-M and RPMA provide higher link budget than LoRaWAN, the low obstacle loss in LoRaWAN means that given the same transmit power and operating condition, it is more resilient to obstructions which improves the signal power reaching the end device from the gateway. On the other hand, even with lower transmit power of NB-IoT than LTE-M, the former relies on its better sensitivity and higher antenna gain to significantly extend the network coverage.
0 5 10 15 20 25 30 35 40 Transmit Power (dBm)
0 10 20 30 40 50 60
Maximum range (km)
WaveIoT LoRa Sigfox RPMA(Ingenu) LTE-M NB-IoT 1840MHz
(a) Range in open and rural areas
0 5 10 15 20 25 30 35 40
Transmit Power (dBm) 0
5 10 15
Maximum range (km)
WaveIoT LoRa Sigfox RPMA(Ingenu) LTE-M NB-IoT 1840MHz
[image:10.595.56.552.62.257.2](b) Suburban areas
Figure 6: Maximum range in rural and suburban areas
0 5 10 15 20 25 30 35 40
Transmit Power (dBm) 0
1 2 3 4 5 6
Maximum range (km)
WaveIoT LoRa Sigfox RPMA(Ingenu) LTE-M NB-IoT 1840MHz
(a) Range in small cities
0 5 10 15 20 25 30 35 40
Transmit Power (dBm) 0
0.5 1 1.5 2 2.5 3
Maximum range (km)
WaveIoT LoRa Sigfox RPMA(Ingenu) LTE-M NB-IoT 1840MHz
[image:10.595.55.551.298.493.2](b) Range in large cities and metropolises
Figure 7: Maximum range of access technologies in urban environments
meaning that NB-IoT end device can receive signal farther away from the gateway than LTE-M while LoRa receives the farthest signal among the non-cellular technologies. Thus, the sub-GHz technologies are particularly beneficial in rural areas where masts are less likely to be spread out. They also have some advantages in cities, because the sub-GHz technologies have lower penetration losses across brick walls, vegetation, concrete, metals, etc, which is suitable for underground applications such as standpipe monitoring. As we move from small to large cities, the performance of RPMA further diverges from Sigfox. This is mainly due to their lower resilience to obstacle losses in large urban areas. Fig. 7 shows that RPMA and LTE-M are poor at travelling over long distances, which requires the towers to be closer together to deliver reliable coverage. Hence, 2.x GHz technologies may be less attractive in some rural deployments and deep indoor applications. Given the wide range of frequency and different modes of deployment sup-ported by NB-IoT, it can be used in > GHz band or sub-GHz to cater for IoT connectivity in different terrains. In [32], the field experiments using LoRa deployment to cover the
city of Padova in Italy reported a network coverage of about 1.2 km. This closely aligns with our result for small cities in Fig. 7a (1.4 km) based on LoRaWAN system specification with gateway transmit power of 21dBm employed in this work. Figs. 6 and 7 show that the 868MHz technologies for instance do not exhibit the same coverage performance even when operated at the same frequency and equal transmit power. This is mainly due to the differences in the systems design and configurations.
For each technology type, the equivalent isotropically radiated power (EIRP) and SNR are also calculated. The EIRP is the output power radiated from the tip of the gateway antenna. Using the PL results in Fig. 3, the EIRP and nominal SNR for suburban environment at different link distances are summarised in Table V (for the downlink only).
-10 -8 -6 -4 -2 0 2 4 6 8 10 Percentage change in parameter (%)
-60 -40 -20 0 20 40 60 80 100 120 140
Percentage change in range (%)
Antenna gains Transmit power Receiver sensitivity Tx antenna height
(a) LoRaWAN urban area
-10 -8 -6 -4 -2 0 2 4 6 8 10
Percentage change in parameter (%) -60
-40 -20 0 20 40 60 80 100 120 140
Percentage change in range (%)
Antenna gains Transmit power Receiver sensitivity Tx antenna height
[image:11.595.58.551.61.258.2](b) Sigfox urban area
Figure 8: Maximum range of LoRaWAN and Sigfox in urban environments
Table V: RSSI and SNR for suburban environments at different distances for various access technologies
Spec. WAVIoT LoRaWAN Sigfox RPMA LTE-M
EIRP 27 27 27 27 47
P L10 136.5 136.5 136.5 144.9 145.5
P L20 147.3 147.3 147.3 155.6 156.3
RSSI10 -109.5 -109.5 -109.5 -117.9 -98.5
RSSI20 -120.3 -120.3 -120.3 -120.6 -109.3
SN R10 20.5 20.5 20.5 12.1 31.5
SN R20 9.7 9.7 9.7 9.4 20.7
impaired with high frame error rate which will ultimately result in sub-optimal link performance. In order to provide remedies for this condition, the following options can be explored
• Improve receiver sensitivity
• Increase the transmit power
• Use higher gain antenna
• Where possible, remove obstacles or other sources of
losses
• Increase the antenna height
• Increase gateway density by deploying more base
stations which will reduce the distance from gateway to IoT end point.
Some of these factors are investigated as part of the sensi-tivity analysis in the next section.
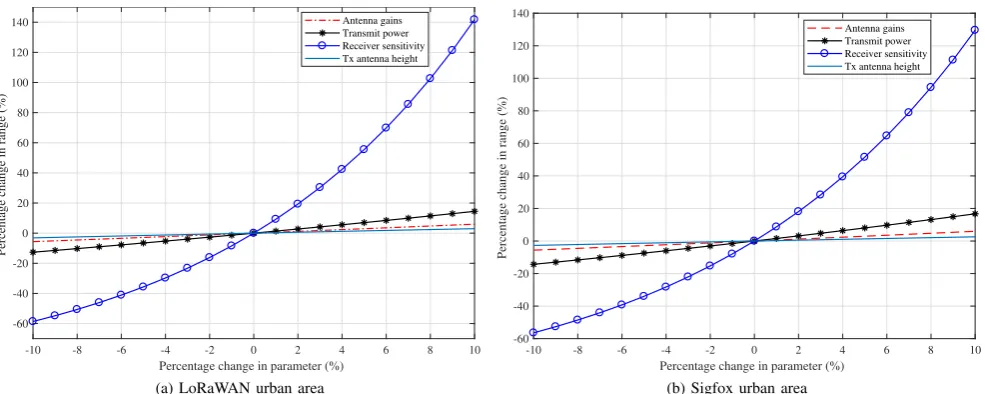
B. Sensitivity Analysis and Network Optimisation
We observed from Fig. 7 that coverage limitation is more imminent in urban areas, therefore the objective of this subsection is to investigate ways to optimise network performance by conducting a sensitivity analysis. Equations (11) and (15) as well as their dependence on field param-eters suggest that some variables can be tuned to optimise performance of the communication network. As the current LP-WAN specifications employ different values of system parameters, percentage changes are employed instead of ab-solute values. In each case, a variable is changed by a fixed percentage and the resultant improvement or degradation in the network coverage is estimated. Thus, the transmit power, antenna gain, receiver sensitivity, height of gateway antenna
are varied within±10% in succession.
-10 -8 -6 -4 -2 0 2 4 6 8 10 Percentage change in parameter (%)
-60 -40 -20 0 20 40 60 80 100 120 140
Percentage change in range (%)
Antenna gains Transmit power Receiver sensitivity Tx antenna height
(a) RPMA (2.4GHz ISM)
-10 -8 -6 -4 -2 0 2 4 6 8 10
Percentage change in parameter (%) -80
-70 -60 -50 -40 -30 -20 -10 0 10 20
Percentage change in range (%)
Antenna gains Transmit power Receiver sensitivity Tx antenna height
[image:12.595.56.550.63.259.2](b) LTE-M (2.6GHz)
Figure 9: Coverage optimisation with 2.4GHz and 2.6GHz LTE in urban environments
-10 -8 -6 -4 -2 0 2 4 6 8 10
Percentage change in parameter (%) -50
0 50 100 150 200 250 300 350 400
Percentage change in range (%)
Antenna gains Transmit power Receiver sensitivity Tx antenna height
(a) NB-IoT 882 MHz
-10 -8 -6 -4 -2 0 2 4 6 8 10
Percentage change in parameter (%) -100
-50 0 50 100 150 200
Percentage change in range (%)
Antenna gains Transmit power Receiver sensitivity Tx antenna height
(b) NB-IoT 1840 MHz
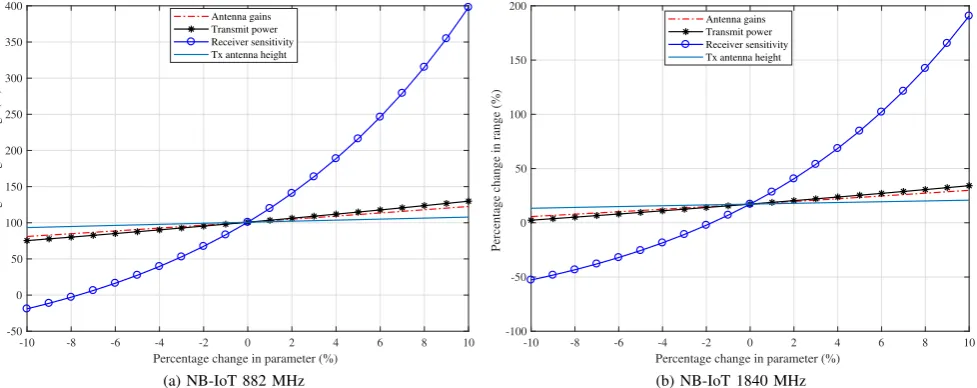
Figure 10: Range optimisation with NB-IoT at 882 MHz and 1840 MHz, bands 5 and 3 downlink frequency respectively, 3GPP NB-IoT (rel. 13) [49]
While increase in antenna gain, transmit power and antenna height can improve the received signal level, they also increase the chances of higher interference. Therefore the pros and cons of each optimisation approach needs to be carefully considered.
C. Transmission Delay
The transmission delay of a message of length |Ψ |bits
can be determined from Shanon-Hartley theorem as
τ(ε, σ,|Ψ |) =|Ψ | ε ·log2
1 +ε−1. βσ
φN0
(16)
whereσ(dBm) =Pt−α is the receiver sensitivity (Pt is
the transmit power,αis the coupling loss),βis a correction factor to account for difference between Shanon limit and
realistic systems andN0is the thermal noise power spectral
density (PSD) which is about -174 dBm/Hz. The minimum
time required to transmit messageAis achieved whenε−→
∞ . This is supported by the fact that larger bandwidth
causes messages to be transmitted faster such that [74]
τ(∞, σ,|Ψ |) =ln2.|Ψ |
βσ
φN0
−1
(17)
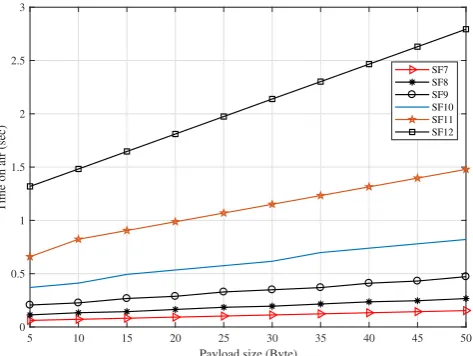
Equations (16) and (17) further imply that given a fixed receiver sensitivity in each LP-WAN specification, the trans-mission delay depends on the data rate and message length. Sending 50 byte payload in LoRaWAN in Europe in some cases can take approximately 2.8s using the minimum data rate (SF12) and 0.154 s using the maximum data rate (SF7). This means that the end devices have to wait 4 min 37 s after each transmission in the former and 15.25 s in the latter. However, Fig. 11 indicates that if the payload size is reduced by 20%, the time-on-air (ToA) can decrease by 328 ms and 61.44 ms for SF12 and SF7, respectively.
[image:12.595.61.550.299.493.2]5 10 15 20 25 30 35 40 45 50 Payload size (Byte)
0 0.5 1 1.5 2 2.5 3
Time on air (sec)
[image:13.595.55.292.54.232.2]SF7 SF8 SF9 SF10 SF11 SF12
Figure 11: Time on Air of LoRaWAN messages vs payload size with coding rate 4/5, preamble symbols 8, bandwidth 125kHz, duty cycle 0.1%
Transmitter
Electronics Amplifier
k-bit message
Receiver
Electronics d
k-bit message
ó=ILÛGÛ@á
'ØßØÖÛG 'ØßØÖÛG
[image:13.595.309.551.54.235.2]'Íë:Gá@; 'Ëë:G;
Figure 12: The first order radio energy dissipation model
all other parameters remain unchanged, the penalty for that is higher ToA which will also impact the end-to-end latency experienced by the software (application).
D. Energy Consumption
To investigate the energy consumption of the IoT end devices, this paper adopts the first order radio energy dissi-pation model introduced in [55] and subsequently applied in other studies such as [56], [75]. In estimating the battery life of the transceivers, we adopt the E91-AA alkaline battery model and apply its operational characteristics [76]. According to [55], the transmitter consumes energy to operate the radio electronics and the power amplifier while the receiver consumes energy to run the radio electronics as shown in Fig. 12.
The energy required to transmit a k-bit message from
the IoT end device to the gateway over a distancedcan be
defined as
ET x(k, d) =EelecT x (k) +EampT x (k, d) (18)
whereET x
elec is the electrical energy consumed by the
elec-tronic circuit of the transmitter radio and depends on signal processing techniques such as modulation, spreading and
coding, while ET x
amp is the communication-related energy
consumed by the amplifier which depends on the environ-mental factors including the distance from transmitter to receiver. At the receiver, since the radio only needs energy to operate the electronics to detect the signal, the energy consumed is
ERx(k) =EelecRx(k) =k·Eelec (19)
Both the free space and multipath-fading channels are considered in the energy model, depending on the distance
0 5 10 15 20 25 30 35 40 45 50
Transmission distance (km) 10
20 30 40 50 60 70 80
Transmit energy per message (
J)
WaveIoT LoRa Sigfox RPMA(Ingenu) NB-IoT 837MHz NB-IoT 1747MHz LTE-M
(a) Comparing transmit energy for WavIoT, LoRa, Sigfox, RPMA, LTE-M and NB-IoT
0 5 10 15 20 25 30 35 40 45 50
Transmission distance (km) 10
10.5 11 11.5 12 12.5 13 13.5 14
Transmit energy per message (
J)
WaveIoT LoRa Sigfox RPMA(Ingenu) NB-IoT 837MHz NB-IoT 1747MHz
[image:13.595.307.546.270.450.2](b) Enlarged Fig. 11a showing WavIoT, LoRa, Sigfox, RPMA and NB-IoT
Figure 13: Transmit energy consumed per message using gateway height of 12 m and end device height of 0.5 m, data rate 100 bps and payload of 12 bytes
between the gateway and end device. If the transmission dis-tance is less than a certain thresholddc, the free space model
(d2 power loss) is used, otherwise the multipath model (d4
power loss) applies [55]. Therefore, power control can be employed to invert this loss by setting the power amplifier
value of ET x
amp at the transmitter in a way that ensures
that adequate signal power arrive at the receiver. Thus, the transmitter energy consumption can be written as
ET x(k, d) =
( k(ET x
elec+F riisd2) d < dc
k(ET x
elec+T wo−rayd4) d≥dc
(20)
where the threshold distance is define asdc= 4π
√
Lhght
γ ,
L ≥ 1 is the system loss factor and γ is the wavelength
of the signal. Applying the parameters in Table II, if the gateway is 12 m high and the end device is 0.5 m (low altitude applications such as smart agriculture and
smart cities) withL=1 (assume no system loss), the dc for
0 5 10 15 20 25 30 35 40 45 50
Distance (km)
2 4 6 8 10 12 14 16
Estimated battery life (Years)
WaveIoT Sigfox LoRa RPMA(Ingenu) NB-IoT 1747MHz LTE-M
(a) Device battery operating at 40◦C
0 5 10 15 20 25 30 35 40 45 50
Distance (km)
2 4 6 8 10 12 14 16
Estimated battery life (Years)
WaveIoT Sigfox LoRa RPMA(Ingenu) NB-IoT 1747MHz LTE-M
(b) Device battery operating at 20◦C
0 5 10 15 20 25 30 35 40 45 50
Distance (km) 2
3 4 5 6 7 8 9 10 11 12
Estimated battery life (Years)
WaveIoT Sigfox LoRa RPMA(Ingenu) NB-IoT 1747MHz LTE-M
(c) Device battery operating at 0◦C
0 5 10 15 20 25 30 35 40 45 50
Distance (km)
1 2 3 4 5 6 7 8
Estimated battery life (Years)
WaveIoT Sigfox LoRa RPMA(Ingenu) NB-IoT 1747MHz LTE-M
[image:14.595.58.514.63.442.2](d) Device battery operating at -20◦C
Figure 14: Estimated battery life in LP-WAN transceiver operating at 1% duty cycle under different weather conditions, using gateway height of 12 m and end device height of 0.5 m, data rate 100 bps and payload of 12 bytes.
Fig. 13 compares the transmit energy consumed per message for the LP-WAN technologies considered in this study. It can be seen that overall, LTE-M consumes the highest amount of energy for every message sent by the IoT end device, followed by RPMA. For distances below 2 km, the technologies consume approximately equal amount of energy. However, beyond 2 km, the performance gap increases rapidly with distance.
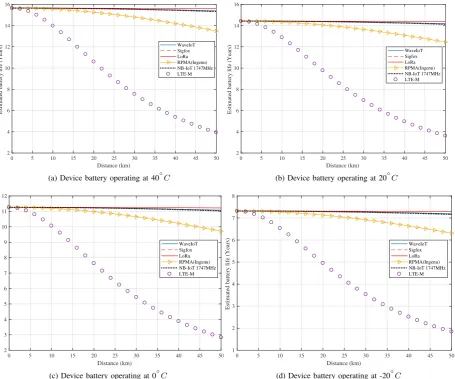
Here we apply a duty cycle of 1% (corresponding to 140 messages per day) to the devices to conform with the regulatory requirements in Europe and analyse the energy consumption of the devices. Fig. 14 presents the estimated battery life in the devices when deployed with the LP-WAN technologies and operated at different temperatures. This figure shows clearly that the operating temperature is a key determinant of battery life. In particular, extremely cold temperature can significantly shorten the active lifespan of the end device due to rapid degradation of its battery’s ca-pacity. Nevertheless, based on the configurations employed in this section, LoRa appears to be the most promising to support long battery life while LTE-M provides the shortest battery life across the temperatures investigated. For exam-ple, with a coverage requirement of 25 km, Fig. 14 shows
that at 40◦C, LoRaWAN, Sigfox, NB-IoT and WavIoT can
each support up to 15.65 years while RPMA and LTE-M
devices are active for 14.9 years and 8.8 years respectively.
However, when the temperature drops to -20◦C, the figure
indicates that the battery life reduces to about 7.32 years for LoRaWAN, Sigfox and WavIoT as well as 7 years and 4.2 years for RPMA and LTE-M respectively. These results generally suggest that even with the same system configurations and battery capacity when IoT devices are deployed, their active lifetimes will vary across regions according to the local temperature and seasonal variations. These results can potentially offer useful insights into the planning, designing and management of the IoT access networks, especially in use-cases such as haulage/logistics, smart agriculture and many smart city scenarios in which the sensors may be unavoidably exposed to extreme weather conditions.
In Fig. 15, we present the variation of daily transmit energy consumption with payload size for different cover-age requirements using LoRaWAN. Although the effect of distance is generally more pronounced, the figure indicates that energy required is significantly affected by message size as well. For example, for a coverage distance of 50 km, reducing the message size by 20% can result in transmit
energy savings of about 47µJ per message and this can
0 50 100 150 200 250 Payload (Bytes)
0 50 100 150 200 250
Transmit energy per message (
J)
[image:15.595.54.294.54.237.2]10 km 20 km 30 km 40 km 50 km
Figure 15: Effects of payload size on daily energy consumption for different coverage requirements in LoRaWAN using gateway height 12 m, end device height 0.5 m, duty cycle of 1%, and data rate of 25 kbps.
and energy consumption, thereby offering additional degree of flexibility in IoT access network design.
VII. CONCLUSION
Current IoT access technologies are optimised for dif-ferent end-use applications. This paper showed that each of RPMA and LTE-M incur at least 9 dB additional path loss compared with Sigfox and LoRAWAN. That means they are more suitable for short range applications. In real deployments, the alternatives include the use of higher gain antennas or reduction of coverage per gateway both of which impact the deployment cost.
To illustrate the consequences of link budget on system performance, parameters were adopted from the LP-WAN datasheets. The results consistently indicated that receiver sensitivity is the most significant variable in LP-WAN optimisation, followed by transmit power. For example, it was shown that with a 10% improvement in receiver sensitivity, LoRaWAN can increase network coverage by about 142% and Sigfox by 130% whereas with similar receiver sensitivity in NB-IoT 882 MHz and LTE-M, the coverage gains were about 398% and 136% respectively.
Across the technologies, the active device life is affected by payload size, distance and environmental conditions such as temperature. In addition to the applied load, it was observed that extreme weather conditions can significantly reduce active device life of IoT objects in the LP-WAN.
Compared with environmental temperature of 40◦C, the
results indicate operating the IoT devices at a temperature
of -20◦C, can reduce the device life by about half; 53%
(WavIoT, LoRaWAN, Sigfox, RPMA) and 48% in LTE-M. Indoor signal propagation is remarkably different from outdoor due to the plethora of objects contributing to the interference level as well as attenuation from different objects some of which are outlined in Table IV. Thus, our future work in this area includes the investigation of the effects of indoor losses on IoT network performance using the LP-WAN technologies discussed in this paper and any future ones available.
NOMENCLATURE
α coupling loss
β correction factorbetween Shanon limit and realistic
systems
δ environmental parameter
F riis dissipation variable, free space
T wo−ray dissipation variable, multi-path fading
η receiver sensitivity
γ wavelength
λ gateway density
φ noise figure
σ receiver sensitivity
θ threshold SNR
ε bandwidth
ϕ the viewing angle from gateway to end device
antenna
Ψ message length
a(ht) terrain parameter
C channel capacity
ct terrain correction factor
dc cross-over distance
ET x
amp electrical energy consumed by transmitting radio
amplifier
Eb energy per bit
Eelec electrical energy consumed by radio electronic
cir-cuit
Gnet net gain
hg gateway antenna height
N0 thermal noise power
Pt transmit power
wt width of main street
xt distance: gateway antenna to wall on main street
REFERENCES
[1] Statistica, “Internet of things (iot) connected devices installed base worldwide from 2015 to 2025 (in billions),” 2015, accessed on 26 May. 2018. [Online]. Available: https://www.statista.com/statistics/ 471264/iot-number-of-connected-devices-worldwide/
[2] M. James, C. Michael, B. Peter, W. Jonathan, D. Richard, B. Jacques, and A. Dan, “Unlocking the potential of the Internet of things,” 2015, accessed on 26 May. 2018. [Online]. Available: https://www. mckinsey.com/business-functions/digital-mckinsey/our-insights/ the-internet-of-things-the-value-of-digitizing-the-physical-world [3] Drivesnccontrol, “1 in 4 wireless IIoT connections will use LPWA
by 2025,” 2017. [Online]. Available: http://m.drivesncontrols.com/ news/fullstory.php/aid/5553/1_in_4_wireless_IIoT_connections_ will_use_LPWA_by_2025.html26May.2018)
[4] T. M. WG, “A technical overview of LoRa and LoRaWAN,” 2015. [Online]. Available: https://docs.wixstatic.com/ugd/eccc1a_ ed71ea1cd969417493c74e4a13c55685.pdf(accessedon29Jan.2018) [5] K. E. Nolan, W. Guibene, and M. Y. Kelly, “An evaluation of low
power wide area network technologies for the Internet of things,” in
Proc. IEEE Int. Wireless Commun. Mob. Comp., 2016, pp. 439–444.
[6] U. Raza, P. Kulkarni, and M. Sooriyabandara, “Low power wide area networks: An overview,”IEEE Commun. Survs. Tuts., vol. 19, no. 2, pp. 855–873, 2017.
[7] N. Poursafar, M. E. E. Alahi, and S. Mukhopadhyay, “Long-range wireless technologies for IoT applications: A review,” inProc. IEEE
Intl. Conf. Sensing Technol., Dec 2017, pp. 1–6.
[8] J. de Carvalho Silva, J. J. P. C. Rodrigues, A. M. Alberti, P. Solic, and A. L. L. Aquino, “LoRaWAN- A low power WAN protocol for Internet of Things: A review and opportunities,” inProc. IEEE Intl.
Multidisc. Conf. Computer and Energy Sci.(SpliTech), July 2017, pp.
[9] K. Mekki, E. Bajic, F. Chaxel, and F. Meyer, “A comparative study of LPWAN technologies for large-scale IoT deployment,”ScienceDirect
ICT Express, vol. 12, no. 05, 2018.
[10] M. Aazam, S. Zeadally, and K. A. Harras, “Offloading in fog computing for IoT: Review, enabling technologies, and research opportunities,”ScienceDirect Future Generation Computer Systems, vol. 04, no. 057, 2018.
[11] S. Al-Sarawi, M. Anbar, K. Alieyan, and M. Alzubaidi, “Internet of Things (IoT) communication protocols: Review,” inProc. IEEE Intl.
Conf. Information Technol., May 2017, pp. 685–690.
[12] K. Zheng, S. Zhao, Z. Yang, X. Xiong, and W. Xiang, “Design and implementation of LPWA-based air quality monitoring system,”IEEE
Access, vol. 4, pp. 3238–3245, 2016.
[13] W. Guibene, J. Nowack, N. Chalikias, K. Fitzgibbon, M. Kelly, and D. Prendergast, “Evaluation of LPWAN technologies for smart cities: River monitoring use-case,” inProc. IEEE Wireless Commun. and
Network. Conf. Workshops (WCNCW), 2017, pp. 1–5.
[14] J. Chen, K. Hu, Q. Wang, Y. Sun, Z. Shi, and S. He, “Narrowband Internet of things: Implementations and applications,”IEEE Internet
of Things Journal, vol. 4, no. 6, pp. 2309–2314, 2017.
[15] W. Guibene, K. E. Nolan, and M. Y. Kelly, “Survey on clean slate cellular-IoT standard proposals,” in Proc. IEEE Int. Conf. Comput. and Inform. Technol; Ubiquitous Comput. and Commun.; Dependable, Autonomic and Secure Comput; Pervasive Intell. and
Comput (CIT/IUCC/DASC/PICOM), 2015, pp. 1596–1599.
[16] F. Adelantado, X. Vilajosana, P. Tuset-Peiro, B. Martinez, J. Melia-Segui, and T. Watteyne, “Understanding the limits of LoRaWAN,”
IEEE Commun. Mag., vol. 55, no. 9, pp. 34–40, 2017.
[17] L. Gregora, L. Vojtech, and M. Neruda, “Indoor signal propagation of LoRa technology,” inProc. Intl. Conf. Mechatronics-Mechatronika (ME), 2016, pp. 1–4.
[18] B. Reynders, W. Meert, and S. Pollin, “Power and spreading factor control in low power wide area networks,” in Proc. Intl. Conf.
Commun. (ICC), 2017, pp. 1–6.
[19] N. Mangalvedhe, R. Ratasuk, and A. Ghosh, “NB-IoT deployment study for low power wide area cellular IoT,” inProc. IEEE Annual
Intl. Symp. Pers., Indoor, Mob. Radio Commun., 2016, pp. 1–6.
[20] J. Petajajarvi, K. Mikhaylov, A. Roivainen, T. Hanninen, and M. Pet-tissalo, “On the coverage of LPWANs: range evaluation and channel attenuation model for LoRa technology,” inProc. IEEE Intl. Conf.
ITS Telecommunications, 2015, pp. 55–59.
[21] M. Aref and A. Sikora, “Free space range measurements with semtech LoRa technology,” inProc. IEEE Conf. Intel. Data Acqu.
and Adv. Comput. Syst: Technol. and Appl. Wireless Syst., 2014, pp.
19–23.
[22] M. Lauridsen, I. Z. Kovács, P. Mogensen, M. Sorensen, and S. Holst, “Coverage and capacity analysis of LTE-M and NB-IoT in a rural area,” inProc. IEEE Veh. Tech Conf., 2016, pp. 1–5.
[23] O. Georgiou and U. Raza, “Low power wide area network analysis: Can LoRa scale?”IEEE Wireless Commun. Lett., vol. 6, no. 2, pp. 162–165, 2017.
[24] Y. Mo, C. Goursaud, and J.-M. Gorce, “Theoretical analysis of UNB-based IoT networks with path loss and random spectrum access,” in
Proc. IEEE Int. Symp. Personal, Indoor, and Mobile Radio Commun.,
2016, pp. 1–6.
[25] H. Mroue, A. Nasser, S. Hamrioui, B. Parrein, E. Motta-Cruz, and G. Rouyer, “MAC layer-based evaluation of IoT technologies: LoRa, SigFox and NB-IoT,” inProc. IEEE Middle East and North Africa
Commun. Conf (MENACOMM, 2018, pp. 1–5.
[26] M. D’Aloia, A. Longo, R. Ruggero, S. Stanisci, D. Amendolare, M. Vessia, F. Lomastro, and M. Rizzi, “An innovative LPWA network scheme to increase system reliability in remote monitoring.” [27] S. Gangakhedkar, O. Bulakci, and J. Eichinger, “Addressing deep
indoor coverage in narrowband-5G,” inProc. IEEE Veh. Tech. Conf, 2017, pp. 1–5.
[28] C. Y. Yeoh, A. bin Man, Q. M. Ashraf, and A. K. Samingan, “Experimental assessment of battery lifetime for commercial off-the-shelf NB-IoT module,” inProc. IEEE Intl. Conf. Advanced Commun.
Techn.,, 2018, pp. 1–1.
[29] A. Augustin, J. Yi, T. Clausen, and W. M. Townsley, “A study of lora: Long range & low power networks for the Internet of things,”
Sensors, vol. 16, no. 9, p. 1466, 2016.
[30] K. Mikhaylov, J. Petaejaejaervi, and T. Haenninen, “Analysis of capacity and scalability of the LoRa low power wide area network technology,” inProc. VDE European Wireless Conf., 2016, pp. 1–6. [31] M. Lauridsen, H. Nguyen, B. Vejlgaard, I. Z. Kovács, P. Mogensen, and M. Sorensen, “Coverage comparison of GPRS, NB-IoT, lora, and Sigfox in a 7800 km2area,” inProc. IEEE Veh. Technol. Conf., 2017, pp. 1–5.
[32] M. Centenaro, L. Vangelista, A. Zanella, and M. Zorzi, “Long-range communications in unlicensed bands: The rising stars in the IoT and
smart city scenarios,”IEEE Wireless Commun., vol. 23, no. 5, pp. 60–67, 2016.
[33] H. Wang and A. O. Fapojuwo, “A survey of enabling technologies of low power and long range machine-to-machine communications,”
IEEE Communications Surveys & Tutorials, vol. 19, no. 4, pp. 2621–
2639, 2017.
[34] G. A. Akpakwu, B. J. Silva, G. P. Hancke, and A. M. Abu-Mahfouz, “A survey on 5G networks for the Internet of things: Communication technologies and challenges,”IEEE Access, vol. 6, pp. 3619–3647, 2018.
[35] M. Chen, Y. Miao, Y. Hao, and K. Hwang, “Narrow band Internet of things,”IEEE Access, vol. 5, pp. 20 557–20 577, 2017.
[36] P. Neumann, J. Montavont, and T. Noël, “Indoor deployment of low-power wide area networks (lpwan): A LoRaWAN case study,” in Proc. IEEE Conf. Wireless and Mobile Computing, Networking and
Communications (WiMob), 2016, pp. 1–8.
[37] K. Mikhaylov, J. Petäjäjärvi, and J. Janhunen, “On LoRaWAN scalability: Empirical evaluation of susceptibility to inter-network interference,” in European Conf. Networks and Communications
(EuCNC). IEEE, 2017, pp. 1–6.
[38] Mathuranathan, “Channel capacity & shannon theorem -demystified,” 2008, accessed on 07 Aug. 2018. [Online]. Available: https://www.gaussianwaves.com/2008/04/channel-capacity/ [39] T. Myers, “Back to basics: The Shannon-Hartley theorem,” 2016,
accessed on 17 Dec. 2017. [Online]. Available: https://www.ingenu. com/2016/07/back-to-basics-the-{S}hannon-{H}artley-theorem/ [40] Semtech, “LoRa modulation basics,”Application Note, 2015. [41] A. AlAmmouri, J. G. Andrews, and F. Baccelli, “SINR and
through-put of dense cellular networks with stretched exponential path loss,”
IEEE Trans. Wireless Commun., vol. 17, no. 2, pp. 1147–1160, 2018.
[42] X. Zhang and J. G. Andrews, “Downlink cellular network analysis with multi-slope path loss models,”IEEE Trans. Commun., vol. 63, no. 5, pp. 1881–1894, 2015.
[43] M. Di Renzo, W. Lu, and P. Guan, “The intensity matching approach: A tractable stochastic geometry approximation to system-level anal-ysis of cellular networks,”IEEE Trans. Wireless Commun., vol. 15, no. 9, pp. 5963–5983, 2016.
[44] A. Al Ammouri, J. G. Andrews, and F. Baccelli, “A unified asymptotic analysis of area spectral efficiency in ultradense cellular networks,”IEEE Trans. Inform. Theory, 2018.
[45] K.-H. Phung, H. Tran, Q. Nguyen, T. T. Huong, and T.-L. Nguyen, “Analysis and assessment of LoRaWAN,” inProc. IEEE Intl Conf.
Recent Adv. Sig. Process., Telecomm. & Comput., 2018, pp. 241–246.
[46] Link-Labs, “A comprehensive look at low power, wide area networks for Internet of things engineers and decision makers,” 2016, accessed on 14 Dec. 2017. [Online]. Available: https: //www.link-labs.com/symphony
[47] Ingenu, “An educational guide a white paper by ingenu how RPMA works,” 2015, accessed on 14 Dec. 2017. [Online]. Available: http://www.ingenu.com
[48] WavIOT, “Comparison of LPWAN technologies,” 2017, accessed on 23 Dec. 2017. [Online]. Available: https://waviot.com/wp.pdf
[49] J.Schlienz and D. Raddino, “Narrowband Internet
of Things whitepaper, Munich, Germany, Rohde &
Schwarz,” 2016, accessed on 03 Aug. 2018.
[On-line]. Available: https://cdn.rohde-schwarz.com/pws/dl_downloads/ dl_application/application_notes/1ma266/1MA266_0e_NB_IoT.pdf [50] A. Ratilainen, “NB-IoT presentation for IETF LPWAN,” 2016,
ac-cessed on 03 Aug. 2018. [Online]. Available: https://datatracker.ietf. org/meeting/97/materials/slides-97-lpwan-30-nb-iot-presentation-00 [51] R. Ratasuk, J. Tan, N. Mangalvedhe, M. H. Ng, and A. Ghosh, “Analysis of NB-IoT deployment in LTE guard-band,” inProc. IEEE
Veh. Technol. Conf. (VTC Spring), 2017, pp. 1–5.
[52] S.-M. Oh and J. Shin, “An efficient small data transmission scheme in the 3GPP NB-IoT system,”IEEE Commun. Letters, vol. 21, no. 3, pp. 660–663, 2017.
[53] D. Hernandez, G. Peralta, L. Manero, R. Gomez, J. Bilbao, and C. Zubia, “Energy and coverage study of LPWAN schemes for industry 4.0,” in Proc. IEEE Intl. Workshop of Electron., Con-trol, Measurement, Signals and their Application to Mechatronics
(ECMSM), 2017, pp. 1–6.
[54] G. G. Ribeiro, L. F. de Lima, L. Oliveira, J. J. Rodrigues, C. N. Marins, and G. A. Marcondes, “An outdoor localization system based on Sigfox,” inProc. IEEE Conf. Veh. Technol., 2018, pp. 1–5. [55] W. B. Heinzelman, A. P. Chandrakasan, and H. Balakrishnan, “An
application-specific protocol architecture for wireless microsensor networks,”IEEE Trans. wireless commun., vol. 1, no. 4, pp. 660– 670, 2002.
[56] Y. Zhuang, J. Pan, and G. Wu, “Energy-optimal grid-based clus-tering in wireless microsensor networks,” inProc. IEEE Intl. Conf.
![Table III. Energy consumed by the radio electronic circuitin low-power devices such as wireless sensors has beenreported to be about 50 nJ/bit [55], [56]](https://thumb-us.123doks.com/thumbv2/123dok_us/684894.571419/5.595.52.547.70.195/energy-consumed-electronic-circuitin-devices-wireless-sensors-beenreported.webp)
![Figure 5: Non LOS path loss in urban environment with S = f−0.024 [69], δ = 7, wt = 7, xt = 2](https://thumb-us.123doks.com/thumbv2/123dok_us/684894.571419/9.595.61.549.63.258/figure-non-los-path-loss-urban-environment-s.webp)