Transport and Society
Professor Glenn Lyons
Unit for Transport and Society, UWE, BristolAbstract
In 1963 the Buchanan Report in the UK advocated a combination of new road capacity, improved public transport and traffic restraint as a means to tackle congestion. Forty years on and the advice from many transport experts remains the same. However, the scale and complexity of the problems associated with a mobility-dependent society have grown. The need for politicians to make tough but realistic policy decisions on transport is now becoming unavoidable. They must confront the realities of living with the car as must the general public. Policymakers now also have social well-being and sustainable development moving higher on their agendas alongside transport. Against such a backdrop, this paper makes the case for transport research, policy and practice to acknowledge more fully the inherent links between transport and society. It argues that greater recognition and understanding of such links is crucial to confronting the realities we face. Transport does not merely serve society, it shapes society, as in turn society shapes transport. The future of each is dependent on the other and we must recognise this. The paper advocates in turn that the transport profession must move from its heartlands in engineering and economics to also embrace more fully such disciplines as sociology and psychology. A factual picture of the many facets of present-day society is presented and the implications for travel demand are discussed. Through considering phenomena such as social norms and habitual behaviour, the paper then argues that the travel choices and behaviour of individuals are not simply a matter of economic optimisation. This points to the need for decision makers to be furnished with better evidence concerning the transport problems we face and the potential efficacy of measures that might be taken. Discussion of public attitudes and the role of the media is included in the context of assessing how politicians can be encouraged and supported in their implementation of realistic but unpopular policies. Evidence and experience within the paper are UK based although many of the issues and arguments apply worldwide.
Introduction
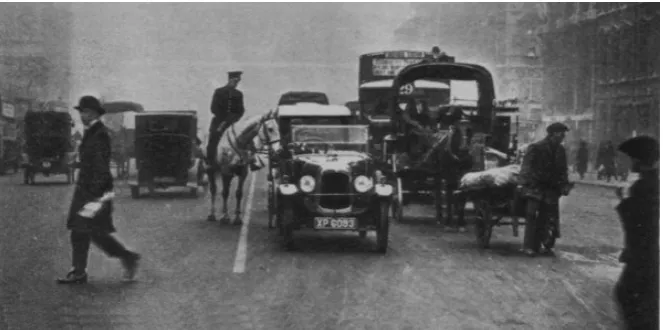
[image:1.595.133.465.583.748.2]In 1924 the first white line was laid down in a London street as an experiment in solving the traffic congestion problem, which was considered at that time to have become acute (see Figure 1). Further back still there were serious concerns that ‘pollution’ from horse-drawn traffic would leave London knee-deep in the consequences.
Ever since it seems that, while enjoying the opportunities it presents, we have been waging a constant battle against the problems arising from mobility. Notable in the list of problems are congestion, pollution and adverse social impacts. In 1997 Professor Phil Goodwin gave his inaugural lecture at UCL, London. It was titled ‘Solving Congestion’ (Goodwin, 1997). As time has passed we seem no closer to achieving that aim. At best it could be argued that we are managing congestion. At worst, we are coping with congestion while, at the same time, our transport system undergoes a graceful degradation under the burden.
What the experts say
A key report has set out recommendations for action to tackle congestion – it advocates a co-ordinated policy involving a combination of new road capacity, development of public transport and traffic restraint measures. This is not, however, a recent publication. The Buchanan Report (‘Traffic in Towns’) was published in 1963 (Buchanan et al, 1963) to “foresee the full development of motor transport, to discern the problems arising, and to show what in principle can be done about them”.
In the intervening forty years the number of licensed cars on Britain’s roads has quadrupled and passenger travel (measured in passenger kilometres) has increased by nearly two and a half times.
In 2002, 28 professors of transport submitted jointly an open letter of concern to the Secretary of State for Transport, Alistair Darling MP (TPS, 2002). In this carefully worded letter, the thrust of the message was clear: a combination of selective road-building and improvements to alternative means of transport to the car will not improve travel conditions unless accompanied by traffic restraint.
So it seems that, whilst not universally accepted, the position of transport experts has not altered dramatically in forty years. Rather what has changed is that the problem has grown in scale and complexity. We have moved from the Motor Age being “at a comparatively early stage” in 1963 (Buchanan, 1963) to 2003 when the Information Age is now at a comparatively early stage. The Motor Age is now at its height or, it might be argued, past its prime.
What the politicians do
Transport experts, for the most part, are not politicians. They are able to keep a safe distance from the wrath of the electorate. Voters in the main do not like any prospect of their car use being compromised. Perhaps rather naïvely and unsympathetically they expect to have, simultaneously, unfettered levels of mobility and a reliable and efficient transport system.
The motoring public are happy to advocate that public transport should be improved but with an implicit if not expressed assumption that it will be used (more) by other people. Traffic restraint, however, is another matter. Surely it is an outrage to further impede car use by reducing its priority on the highways or by charging the poor motorist to do battle with congestion? After all, has the motorist not suffered enough already with being in traffic jams and paying the Treasury dearly for the privilege in the form of road and fuel tax?
As a result, while politicians have been happy to engage in debate over transport challenges and to commission numerous studies, they have been reluctant to turn intent into action or at least action in the full sense which seeks to improve alternatives to the car and restrain car use.
One can argue that politicians should lead the democratic will of the people rather than follow it but the mindset of the politician has remained unaltered for generations – their overarching aim is to gain and remain in power and to do so they pay careful heed to public opinion – opinion consistently fuelled and influenced by the media.
What the future holds
transport professors hope to achieve? Can there be any value in publishing further articles that, in various ways, (re)state the case? The answer to the second question in relation to this paper is something for the reader to decide. The answer to the first question forms the substance of the paper.
2003 will mark an historic year for Britain’s transport system. It is the year that saw the introduction of the world’s most ambitious coordinated scheme to tackle urban congestion. On 17 February 2003 traffic restraint in the form of congestion charging was introduced to Central London (Dix, 2003). A £5 daily charge to enter the central area has been accompanied by substantial investment in surface public transport and preceded by highway improvements.
In London’s Mayor, Ken Livingstone, it seems the transport experts have finally found a politician who is prepared to lead the democratic will of the people.
While criticised for its failure to voice its support for the London scheme before its launch, the Government too should be applauded for its integrated transport White Paper (DETR, 1998a) which, once supported by the necessary primary legislation (DETR, 2000a), bestowed powers on local authorities to introduce pricing-based traffic restraint measures from which they are able to reinvest the revenues in further transport improvements. Applause too is due for the substantially increased level of public spending on transport planned between 2000 and 2010 (DETR, 2000b).
The introduction of traffic restraint in Central London has also not led to chaos and a motorists’ uprising. Rather, at least to date, it has reduced traffic flows and improved traffic movement to the extent in fact that buses have faced the problem of arriving too early at stops rather than too late. Perhaps then the stalemate of forty years is now being broken. The experts’ advice appears to have been right all along and, while London some will argue is atypical rather than typical of other UK cities, politicians nationally and nationwide can have renewed confidence in delivering a policy that combines transport improvements with traffic restraint. London has now set a lead for others to follow.
A lot then has happened since Goodwin’s lecture in 1997. There can be cause for renewed optimism in the prospect of being able to decrease if not solve congestion. Other circumstances may also be, coincidentally, conspiring to support this optimism. The importance of social capital has gained prominence at the heart of Government policy and sustainable development is now espoused by governments around the world.
The policy position
In the UK it is the Government’s expressed wish to reduce social exclusion and to ensure a better quality of life for everyone, now and in the future. Such a wish encompasses the “goals of economic growth, social progress, environmental protection, and the prudent use of natural resources together, rather than at another’s expense” (DEFRA, 2003). In other words, development is crucially no longer driven solely by economic imperatives. Such imperatives have, hitherto, for the transport sector dictated that traffic must be kept moving – time spent travelling and in traffic jams is deemed wasteful to the economy.
The Prime Minister has stated that “This Government’s goal is a good quality of life for all. This means we can’t just focus on narrow economic factors – vitally important as these are – but must also take into account the social and environmental health of our country…it is only through sustainable development that we can meet these ambitions” (ibid).
In 1999 the Government set out ten guiding principles for its Strategy to achieve sustainable development (ibid):
2. Taking a long term perspective - Sustainable development thinking cannot restrict itself to the life of a Parliament or the next decade.
3. Taking account of costs and benefits - Decisions must take account of a wide range of costs and benefits, including those which cannot easily be valued in money terms.
4. Creating an open and supportive economic system - Conditions must be created in which trade can flourish and competitiveness can act as a stimulus for growth and greater resource efficiency. 5. Combating poverty and social exclusion - Everyone should have the opportunity to fulfil their
potential, through access to high quality public services, education and employment opportunities, decent housing and good local environments.
6. Respecting environmental limits - There are limits which should not be breached if serious or irreversible damage to some aspects of the environment and resources is to be avoided.
7. The precautionary principle - Where there are threats of serious or irreversible damage, lack of full scientific certainty should not be used as a reason for postponing cost- effective measures to prevent environmental degradation.
8. Using scientific knowledge - Where possible decisions should be taken in light of scientific advice or research.
9. Transparency, information, participation and access to justice - Opportunities for access to information, participation in decision-making, and access to justice should be available to all. 10. Making the polluter pay - Much environmental pollution, resource depletion and social cost
occurs because those responsible are not those who bear the consequence – if the polluter is made to pay for those costs this offers an incentive to reduce harm and means that costs do not fall on society at large.
Alongside these principles sit the Government's over-arching objectives for transport (DETR, 1998b):
- to protect and enhance the built and natural environment; - to improve safety for all travellers;
- to contribute to an efficient economy, and to support sustainable economic growth in appropriate locations;
- to promote accessibility to everyday facilities for all, especially those without a car; and
- to promote the integration of all forms of transport and land use planning, leading to a better, more efficient transport system.
Of course it would be naïve to assume that such laudable goals across policy areas can be pursued comprehensively and consistently over time, particularly since achieving such goals is a long term endeavour which must compete with more immediate problems and demands. As the Chairman of the Sustainable Development Commission has observed of sustainable development, “as a cross-cutting, even all-embracing concept, it will always work against the grain of Whitehall, the skyline of which remains as dominated today by its vertical policy silos as in any preceding administration. A succession of admirable efforts to get more of the ‘joined-up’ feel between the silos has certainly helped, but it’s still the case that policy gets sorted out and budgets spent without a great deal of cross-cutting co-ordination.”
A look forward
At this point it is appropriate to make some summarising observations:
- Avenues of escape from the realities we face in transport are now closed (Goodwin, 2003). - The need and opportunity for tough but realistic transport policy has come of age.
- Social capital, i.e. ‘society’, now sits alongside transport high(er) on the political and public agenda.
- Policy aspirations dictate that transport must develop in such a way as to support society.
Transport and society
The policy objectives outlined earlier can be interpreted as setting the following agenda for the future of transport:
Our transport systems must be developed and operated in such a way as to support a vibrant economy and an equitable society with enhanced opportunities for individuals to fulfil their potential and to enjoy a satisfactory quality of life. This must be achieved without undue adverse impact on the built and natural environment in which society exists and must be sustained to support the needs of future generations.
This is a significant departure from previous approaches to transport. Once upon a time there appeared to be a mentality of ‘transport is here to serve’. Architects and custodians of the transport system were not asked to reason why but to meet the demands society placed upon them. If more motorised mobility was its desire then success was marked and judged by the ability to deliver adequate system capacity in a cost-effective way. However, in more recent times the illusion of such a comparatively simple regime has been shattered. As society’s levels of mobility have intensified and as a growing array of problems has become apparent, we are being forced into recognising that transport does not merely serve society, it shapes society, as in turn society shapes transport.
Government itself recognises the need for an integrated approach to transport to extend beyond integration within transport and between transport systems and services. It must also include the integration of transport with the environment, land-use planning and policies for education, health and wealth creation. In short, transport is inextricably linked to society and lifestyles; and the linkage is two way.
Although awareness and acceptance of this reality is growing, our understanding of the relationships between transport and society is limited and inadequate. Politicians will wish to argue that they create evidence-based policy. However, the evidence that exists currently is incomplete and in some instances ambiguous or even misleading.
Under the ‘transport is here to serve’ regime, evidence has been implicitly taken to be ‘that which can be counted’ from which it follows that ‘if you can’t count it, it doesn’t count’. We have for decades sought evidence that can be used to advise, usually through the use of modelling techniques, decision makers on how best to meet projected travel demand with transport supply. The possibility of influencing or managing travel demand as opposed to taking it as a given has also been a consideration since the time of the Buchanan report (early examples of consideration include the Smeed Report (1964) and the Ministry of Transport report ‘Better use of town roads’ (1967)). However, consideration has not led to transfer into practice. As Truelove (1999) has observed: “The problem with demand management is not any shortage of ideas about why or how to do it. The problem is one of political feasibility.” Precious little account has been taken of the impacts on our ‘evidence’ of social and technological change.
Government itself acknowledges that its transport planning and investment is based on incomplete evidence. In its Ten Year Plan (DETR, 2000b) it states that “social and technological changes will also alter patterns of behaviour in unforeseen ways” and “the likely effects of increasing Internet use on transport and work patterns are still uncertain, but potentially profound, and will need to be monitored closely”.
In acknowledging the importance of social context, pursuit of better understanding will need to take much greater account of certain social science disciplines such as psychology and sociology. Transport studies must work much harder to move outwards from its heartlands in engineering, mathematics, computing, IT and economics.
A social sciences digression
The need for transport experts to encompass the knowledge base of social sciences merits a brief but important departure.
What is encompassed by ‘social sciences’? A recent commission into the state of social sciences in Britain (Commission on the Social Sciences, 2003) acknowledged that there is “not a simple or unambiguous specification of the social sciences”. It viewed social sciences as “ ‘disciplined curiosity about societies in which we all live’ leading to the creation and sharing of social knowledge.” The commission identified the following disciplinary areas as having a particularly significant element of social sciences: anthropology; business and management studies; economics and econometrics; education; geography; law; politics and international studies; psychology; social policy and administration; social work; and sociology.
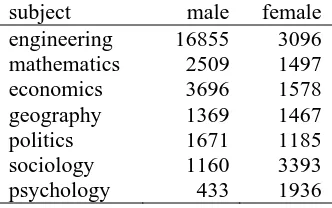
[image:6.595.215.381.389.493.2]What capacity is there within the social sciences to address transport issues more extensively? Collectively British social sciences research is ranked second only to that in the US. In terms of the availability of individuals, Table 1 compares the number of male and female acceptances onto full-time undergraduate university courses in different subjects for 2001.
Table 1. Acceptances to full-time under-graduate courses in different subjects in 2001 (Source: UCAS)
subject male female
engineering 16855 3096
mathematics 2509 1497
economics 3696 1578
geography 1369 1467
politics 1671 1185
sociology 1160 3393
psychology 433 1936
Transport professionals have typically been drawn from the top four subject areas in Table 1 (a survey of members of the UK’s Transport Planning Society found that the five most common first degree subjects were civil engineering (22 per cent of respondents), geography (21 per cent), engineering (other) (7 per cent), economics (6 per cent) and maths and statistics (5 per cent) (Steer Davies Gleave, 2003)). However to date, far fewer transport professionals have their origins in politics, sociology or psychology. The transport profession remains male dominated (85 per cent of TPS members as at June 2002 were male) and characterised by the theory, mental models and thought processes of engineers, geographers, economists and mathematicians.
In order to see the profession equipped to fully address the links between transport and society it would appear that more women must be attracted into transport studies.
The commission’s report identified a further challenge to be addressed – the social sciences are subject to weak interface management, i.e. they are ineffective in communicating their work and knowledge to policymakers and other stakeholders. It would be fair to include the transport studies community as such a stakeholder.
Aims of the paper
society, lifestyles and social and technological change. Evidence and experience within the paper is UK specific. However, many of the issues and arguments apply worldwide.
The remainder of the paper consists of two main parts. The first of these seeks to provide a factual picture of UK society and thus portray the complex pattern of interrelated trends that symbolise how, as individuals and collectively, our society is developing. Specifically, statistics and trends have been singled out which have potentially significant implications for travel demand and hence provide an important context for observing, understanding and influencing choice and behaviour. Such implications are discussed. The subsequent part of the paper then delves into ‘disciplined curiosity about society’. It turns to consider factors that underlie and influence travel choice, behaviour and ultimately patterns of travel and car use. Phenomena such as social norms and habitual behaviour challenge the notion that individuals’ travel choices are driven (solely) by economic optimisation. We must ask where prejudice, faith, pride, loyalty, fear, keeping up appearances, peer pressure, responding to advertisements, ambition, greed and so on fit into our established ‘logical’ framework of transport analysis employed to deliver guidance to politicians.
The paper concludes with an attempt to summarise the main messages that have emerged and offers some suggestions for the way ahead.
Social trends
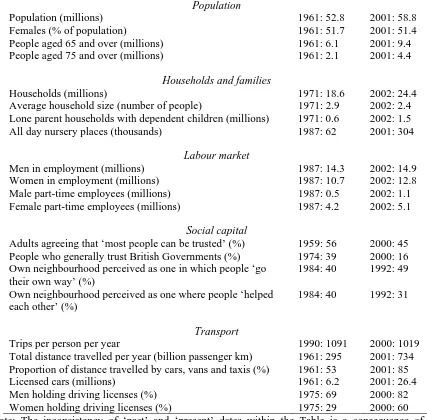
The UK’s Office for National Statistics periodically publishes ‘Social Trends’ (ONS, 2003a). This flagship publication draws together statistics from a wide range of government departments and other organisations to paint “a portrait of British society” through a sequential focus on different social policy areas. Selective information drawn from the 310 pages of the 2003 report is presented in Table 2 and is discussed below with particular consideration given to the implications for transport.
The UK’s population has grown by some 10 per cent in the past 40 years and, as a result of lower fertility rates and improving life expectancy, is ageing. Interpreted simply, (potential) users of the UK’s transport system are getting older and increasing in number. In terms of pressures on the UK’s natural and built environment it is population density rather than the absolute population size that is of significance. In 2000, the number of persons per square km in the UK was 240. This compares to 389 in the Netherlands; 231 in Germany; 108 in France and 30 in the US (UN, 2002). While population statistics refer to numbers of individuals, households rather than individuals are commonly treated as the tripmaking unit. Such tripmaking units are decreasing in size and increasing in number. Divorce, decline or delay in marrying, increasing affluence and longevity and health in old age are all contributory factors to this trend. It could be postulated that those living in larger households have greater opportunities to share journeys and combine trips. Grocery shopping for the entire household can be addressed by trips made by one individual rather than all. In principle cars owned by the household can be shared and more flexibly used in conjunction with other means of travel. It would follow that the reverse is true for those in smaller households.
The majority of the population is female and yet arguably our transport systems have been shaped around male, middle-class, middle-aged professionals who travel without children or luggage. There has been a substantial increase in women in paid employment, whether full or part-time with, in turn, considerable growth in childcare facilities. Lone parent households with dependent children have increased in number too. Women much more than men must juggle household and childcare responsibilities alongside their paid employment. This demands greater flexibility in the patterns and timings of trips – something public transport provision is not easily able to address but which the car can and does. The majority of women now hold driving licenses.
More complex patterns of daily activity can be created, heightening the need for flexible mobility. Crucially for transport, the makeup of employment has changed. Manufacturing has declined while the financial and business services sector is growing and now accounts for about one in five jobs. Growth in the service sector implies a greater proportion of jobs which are concerned with information handling. Unlike jobs in the manufacturing sector, such jobs are less dependent on being carried out at a given location. This presents opportunities to reshape and decrease travel associated with employment. Numbers of people in part-time employment have been increasing. Part-time workers by definition will be travelling to and/or from work at off-peak times. To (only) focus transport provision on the morning and evening peak periods may therefore be short-sighted.
Table 2. UK social trends (ONS, 2003a)
Population
Population (millions) 1961: 52.8 2001: 58.8
Females (% of population) 1961: 51.7 2001: 51.4
People aged 65 and over (millions) 1961: 6.1 2001: 9.4
People aged 75 and over (millions) 1961: 2.1 2001: 4.4
Households and families
Households (millions) 1971: 18.6 2002: 24.4
Average household size (number of people) 1971: 2.9 2002: 2.4
Lone parent households with dependent children (millions) 1971: 0.6 2002: 1.5
All day nursery places (thousands) 1987: 62 2001: 304
Labour market
Men in employment (millions) 1987: 14.3 2002: 14.9
Women in employment (millions) 1987: 10.7 2002: 12.8
Male part-time employees (millions) 1987: 0.5 2002: 1.1
Female part-time employees (millions) 1987: 4.2 2002: 5.1
Social capital
Adults agreeing that ‘most people can be trusted’ (%) 1959: 56 2000: 45
People who generally trust British Governments (%) 1974: 39 2000: 16
Own neighbourhood perceived as one in which people ‘go their own way’ (%)
1984: 40 1992: 49
Own neighbourhood perceived as one where people ‘helped each other’ (%)
1984: 40 1992: 31
Transport
Trips per person per year 1990: 1091 2000: 1019
Total distance travelled per year (billion passenger km) 1961: 295 2001: 734 Proportion of distance travelled by cars, vans and taxis (%) 1961: 53 2001: 85
Licensed cars (millions) 1961: 6.2 2001: 26.4
Men holding driving licenses (%) 1975: 69 2000: 82
Women holding driving licenses (%) 1975: 29 2000: 60
Note: The inconsistency of ‘past’ and ‘present’ dates within the Table is a consequence of the multiple sources from which these data are drawn by Social Trends
are ‘left behind’. There is a significant dynamic underlying aggregate patterns of travel, namely the changes in the relative locations of home and work. One in ten of all households have changed residence in the last 12 months (albeit that two-thirds of owner-occupiers who move do so a distance of less than 10 miles). As at 2002, nearly six per cent of full-time employees were looking for a new job. A third of employees stay in a job for less than two years with over half staying for less than five years.
While household expenditure on transport and travel (15 per cent of overall expenditure) remains second only to that on housing, water and fuel, spending on communications is now eight times higher than 30 years ago (albeit that it still only represents 2 per cent of overall household expenditure). Household mobile phone ownership shot up from 17 per cent in 1996/97 to 65 per cent in 2001/02. Household access to the Internet also quadrupled over a similar period reaching 40 per cent in 2001/02. Creations of the Information Age such as mobile phones and the Internet are providing a new flexible means of connectivity between people, goods services and opportunities and on a very large scale. Growth of the Internet (the physical infrastructure for movement of information) has been far more rapid than previous expansion of the highway infrastructure (for movement of people). Likewise growth in home ownership of computers with Internet access (the ‘vehicles’ for using the Internet) has been far more rapid than the growth experienced in household car ownership. The connectivity provided by both transport and computer networks is ultimately about providing their users with access enabling participation in society. This suggests strongly that, with the transport network’s capacity to provide society with access now stretched close to the limit, the capacity of computer networks must now play a key role in providing access. In effect, virtual mobility, or more specifically virtual access should form part of an integrated transport strategy.
0.0 1.0 2.0 3.0 4.0 5.0 6.0 7.0 8.0 9.0
sleeping employment/study TV and video household and family care travel eating social life shopping and services sports and outdoor activities childcare entertainment and culture other
activity
hours
[image:9.595.107.499.380.645.2]females males
Figure 2. Daily time spent by ‘adults aged 16 and over’ on different activities by sex (reproduced from ONS, 2003a; Figure 13.2 and sourced from the UK 2000 Time Use Survey)
sexes – more than double the amount of time for social life. This latter point raises some interesting issues. Why is so much more time spent watching television than socialising? Perhaps it is because the former is more affordable or readily accessible. Half of television viewing is not carried out in the company of other household members. Such viewing is apparently not performing a social function but rather it offers a form of entertainment, education or relaxation (perhaps a substitute for reading for pleasure). This in turn raises the question of whether, thanks to mobile technology, people will be able increasingly to watch television while travelling and achieve the same level of satisfaction (Lyons, 2003). Could this substitute for television watching in the home, and, by converting travel time into activity time, facilitate longer and longer journeys being made with more time spent travelling?
In our busy daily routines, regular exercise now eludes many people. Thanks to the sedentary lifestyle afforded by the car, cycling and walking are now seldom a by-product of going about one’s daily routine. If they are indulged in at all it is as a ‘leisure’ pursuit. This lack of exercise, coupled with poor diet, can have serious health implications for society. The proportion of the population who are overweight or obese has been increasing. By 2001, 21 per cent of males and 23 per cent of females aged 16 and over in England were obese. 47 per cent of men and 33 per cent of women were overweight. Obesity is a major factor associated with heart disease, diabetes and premature death.
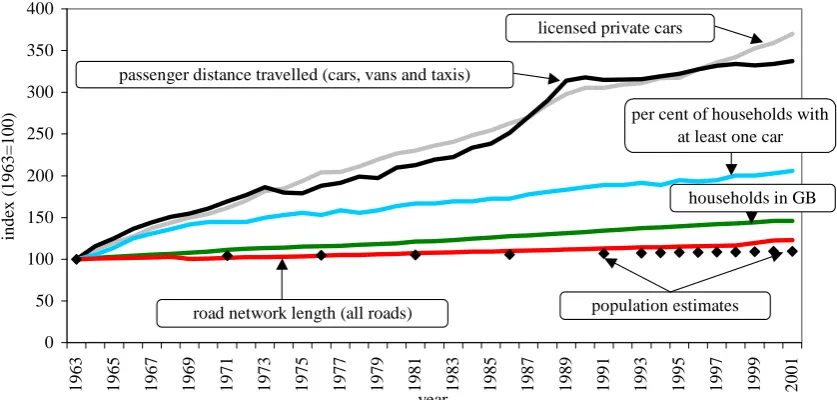
In addition to Table 2, Figure 3 attempts to offer a comparison of some key (transport) trends from the time of the Buchanan Report (referred to at the start of this paper) to the present day (2001). The number of licensed private cars has increased by 270 per cent to 23.9 million. Passenger distance travelled per year using cars vans and taxis has increased by a similar amount (237 per cent) to 624 billion passenger km. To suggest that car ownership and use are not closely correlated in the UK would seem unreasonable. The number of households meanwhile has (only) increased by 46 per cent to 24.4 million. The proportion of households owning at least one car has doubled and now stands at 74 per cent. In spite of such a massive increase in the amount of travel over the period, Britain’s road network has only increased in length by a quarter. Its ability to cope under such a burden of demand must be a credit either to dual carriageways and motorways, effective traffic management, a spreading of travel across the day (to exploit temporal spare capacity) or simply the tolerance of the motoring public when it comes to sitting in traffic jams.
0 50 100 150 200 250 300 350 400
1963 1965 1967 1969 1971 1973 1975 1977 1979 1981 1983 1985 1987 1989 1991 1993 1995 1997 1999 2001 year
index (1963=100)
population estimates road network length (all roads)
per cent of households with at least one car
households in GB passenger distance travelled (cars, vans and taxis)
[image:10.595.90.509.489.689.2]licensed private cars
Figure 3. Normalised comparison of key transport trends 1963-2001 (Sources: ONS, 2003a and 2003b; and DfT, 2002)
in society. Since 1980 economic inequality has been marked. As at 2000/2001, average original income (before any state intervention) of the top 20 per cent of households was 18 times greater than that of the bottom 20 per cent. Final income (after state intervention) saw this decreased to four times. Even after state intervention, economic inequality remains substantial. This is significant in a society in which participation in society, i.e. access, has become increasingly dependent upon motorised mobility. Such mobility comes at a cost. Indeed while, overall, the cost of car use in real terms is cheaper than use of public transport, the initial capital outlay means that a substantial proportion of those in the lowest household income bracket are dependent on public transport. Given the increased household expenditure on transport and travel noted earlier one might ask to what extent some people
are choosing to spend more while others on low incomes are forced to pay higher public transport
fares? Transport Trends (ONS, 2003a) argues that “the availability of bus services is fairly good overall” on the grounds that nearly 90 per cent of households in Britain live within 13 minutes’ walk of a bus stop with a service at least once an hour. However, such a measure is at best a crude proxy for the ability of individuals to use such bus services in order to adequately participate in society. The measure takes no account of physical and financial barriers to people using the bus nor does it reflect whether service routes map onto destinations in people’s daily routines or whether, for the worker doing unsociable hours, the hourly service is running early in the morning or late at night when they need to use it.
Social trends in the UK can be summarised as follows in terms of significant issues for us to be aware of and reacting to in transport:
- We live in an increasingly individualised and ageing society.
- Households are growing in number but reducing in size with a resultant loss of economy of scale when it comes to household mobility demands.
- The number of licensed cars has increased at a greater rate than the number of households and women will soon be as likely as men to hold a driving license.
- The number of trips we make has not increased but journey lengths have, as dependence on the car and household expenditure on mobility have increased.
- There has been a tendency to view ‘women and the elderly’ as a minority consideration in transport planning and policy and yet increasingly they should be a major consideration.
- We have record numbers in employment with nearly as many women as men and the former make up a large proportion of the one quarter of employees who now work part-time.
- Public transport may have served society well in the past but its ability to meet the needs and expectations of modern lifestyles is diminished.
- Potential flexibility of workplace location has increased as the number of jobs in manufacturing have declined and those in information handling have increased.
- The rate of change of job or household residence is substantial and creates an important dynamic in the system.
- Fitness is no longer a by-product of working or getting to work for many people – we sit in our cars and then sit in our offices working the longest hours in Europe.
- Disposable income, though not evenly distributed, has increased.
- While transport accounts for a substantial proportion of household expenditure, household expenditure on communication has increased rapidly.
- Access to and the sophistication of mobile technologies is easing the burden of individualised mobile existences.
- Our transport system is under great strain and the Government itself has now admitted that it expects things to get worse.
Factors influencing choice and behaviour
Consider, for example, the case of third generation mobile phones (3G). 3G with its capability to offer multimedia mobile communications (including sending and receiving video messages and photos and browsing the web) was seen as the future darling of the telecommunications industry. So much so that in 2000 the UK Treasury raised £22.5bn from its auction of 3G licences. The price tag has left leading telecoms companies with serious financial commitments. They cannot afford 3G to fail. In 2003 we are now seeing the availability of 3G handsets being intensively marketed. As the public we will be persuaded of the virtues of, and become eventually dependent upon, this new form of mobile communication. That such communication substantially supports and even encourages mobile lifestyles and by implication more travel will be an issue that transport policymakers can, directly, do little about.
There remains, nevertheless, a significant amount which transport policymakers can do in terms of influencing and managing travel demand. However, this differs in one key respect from steps that have been and are taken to manage traffic (a longer standing and well-established tradition in the transport profession). Managing traffic is seen by the public in the main as trying to accommodate its mobility wishes. Managing demand by contrast is, and is seen to be, a manipulation of, or constraint upon, public wishes in relation to mobility and people’s daily routines. It is, therefore, a much more politically sensitive area.
Many policy options for managing demand are now recognised and some are being pursued. Options include: restricting or prioritising vehicular access or parking; road pricing; improved vehicle utilisation (car sharing); reducing the length and number of motorised trips through land use planning; and trip suppression through enabling virtual access.
What needs greater attention is not only the social context (addressed earlier) for the introduction of such policies, but also our understanding of public reaction and behavioural response to such measures and ultimately their effectiveness. The latter issues are particularly crucial for politicians. We need to consider what factors influence choice and behaviour so that in turn decision makers can be (more) effectively advised on appropriate formulation and implementation of policy. Five key factors are introduced and considered below.
Social norms
What is meant by social norms? There appears precious little discussion of them in academic literature and their neglect even in the field of sociology is bemoaned (Therborn, 2002). Therborn provides a rare but valued discussion of social norms. Norms tell us what is normal and what we ought to do. They reduce uncertainty and thereby contribute to social order by implicating that those who do not conform to the norms act ‘wrongly’.
Why do individuals comply with social norms? It can be because of subconscious habit or routine (returned to later). Alternatively it can be “out of a desire to belong and/or to be held in esteem and respect, or out of fear of ridicule, ostracism, dismissal or legal punishment” (ibid). Our compliance with norms is also influenced by what we believe others are doing. If we believe most are complying then we are more likely to do so ourselves than if we believe others are flouting the norms.
“Norms define the meaning of social membership, members’ expected contribution to the social system, and the proper rewards of their membership and/or contribution. As such, norms are ubiquitous, and they are central to any functioning social system” (ibid). Therborn also notes that “Changing circumstances, new experiences and new knowledge tend to call forth demands for changes or abolition of old norms and for the creation of new ones. Actors’ experiences and perceptions of alternatives, and scientific findings, change foci of attention and notions of what is important or not.” (ibid).
that much human behaviour is motivated by variable melanges of utility maximisation and normativity” (ibid).
There are undoubtedly many norms associated with or influencing our routines and travel behaviour. It is normal to use a car almost regardless of the journey length. It is normal to be ignorant of what public transport services have to offer. It is normal to feel that travel time is wasted time and something to be minimised. It is (increasingly) normal to own more than one car. It is (or has been) normal to be apathetic towards environmental issues. Conversely it is not normal to self-inflict inconvenience by not using the car. It is not normal to make conversation with strangers on public transport. It is (increasingly) not normal to move house following a change of job. The lists could go on.
From the field of psychology, the theory of planned behaviour (which seeks to explain and predict human behaviour) identifies the influence of social norms. The theory centres upon an individual’s intention to perform a given behaviour for which in turn there are three determinants (Ajzen, 1991):
attitude towards behaviour (a person’s evaluation of the behaviour in question);
subjective norm (the perceived social pressure to perform the behaviour or not to perform it); and
perceived behavioural control (the perceived ease or difficulty of performing the behaviour.
The theory of planned behaviour is being used to explain, predict and underpin influencing human behaviours including smoking and drinking as well as, in the transport field, speeding (Stead et al, 2002).
However, as implied above, norms are not fixed and given. They change over time because of circumstance, experience and changing societal priorities. Sometimes change can be rapid or almost instant. The September 2000 fuel crisis changed what was normal with dramatic impacts on travel behaviour. Research during the fuel crisis (Chatterjee and Lyons, 2002) found that a third of commuters used public transport, cycled, walked or car shared instead of driving. A quarter of parents walked or cycled their children to school instead of driving and one in seven car users shopped more locally than usual for groceries, going either by car, walking or cycling. Once the crisis ended norms appeared to revert back to their former state.
One wonders if a (more moderated) form of motor fuel rationing had persisted whether changed norms might have prevailed and persisted. It might have become normal to share lifts to work; normal to cycle to the local store for top-up grocery shopping; normal to use videoconferencing for meetings; or abnormal to drive children to school.
The fuel crisis of course was not a deliberate Government policy to restrain car use. Had it been then the pain and indignation of the rapid period of change in social norms would likely have provoked (even greater) public outrage.
A key feature of the fuel crisis was that it affected huge proportions of the population. Individuals could be in no doubt that they were not alone in changing their travel behaviour. Ordinarily this is not the case. Travel awareness campaigns can do their best to change attitudes with a view to changing social norms but they generally fail to convince the individual that they personally should move in the direction advocated. This situation is referred to as a social dilemma.
Social dilemmas
For an excellent discussion of social dilemmas see Felkins, 2001. He refers collectively to social dilemmas as ‘The Voter’s Paradox’. This can be illustrated through a transport example.
With all or most of the commuters travelling by car they all face (collectively self-inflicted) congestion. If an individual chooses to switch from car to public transport (s)he will remove a car from the road and thereby marginally reduce the traffic level and improve the journey for all other car users and public transport users. This may well, however, be at a greater personal ‘cost’ to the individual concerned than the benefit they receive from the switch. If all or most car users switch to public transport then all commuters would benefit more than they would if no-one switched.
In this situation the rational car user will remain in their car. This is explained as follows. If the individual is the only one to switch then they will lose while all others will gain. If the individual switches and sufficient others do likewise then the individual will gain. If others switch and the individual does not (i.e. the individual is a freerider) then (s)he will gain. Such rational behaviour regrettably results in all commuters being (or remaining) disadvantaged. The essence of the dilemma is that the individual experiences “a relatively high degree of intrapersonal conflict: it is a dilemma in which they have to choose between the personal or collective interest” (Van Lange et al, 2000).
One can distinguish between two means of removing the paradox (Garvill, 1999): “changing the individual’s attitudes and beliefs that influence the choice between cooperation and non cooperation”; and “a structural solution which focuses on changing the structure of interdependence, effectively eliminating the dilemma”. The second means is where congestion charging comes into its own. By being ‘punished’ by a £5 charge to enter Central London, the individual can stand to gain by switching from car use irrespective of whether or not others switch.
People’s behaviour is not always so strictly governed. Some will feel good in switching to public transport and thereby doing their bit to fight congestion. Others will be influenced in their actions by how they will be judged by others – driving a car to a public transport conference when there is a viable public transport alternative and when you are known to have done so by your peers might be such an example! Indeed social science research has seen a large number of studies concerning the phenomenon of social preferences – namely that individuals’ decisions can be shaped not only by the gain or loss to themselves but also by the gain or loss of others. Fehr and Fischbacher (2002) point to four important types of social preference that have been revealed by such studies:
reciprocity (an individual responds to the actions of others in a like-minded manner (reciprocal
fairness) – kind actions evoke a kind response while hostile actions evoke a hostile response);
inequity aversion (an individual seeks an equitable distribution of resource such that they act to
increase the gain of others below the equity line while they envy and act to decrease the gain of people above the equity line);
pure altruism (an individual exhibits unconditional kindness to others such that they would not act
in ways that would decrease the gain of others); and
spite or envy (in contrast to the above, a spiteful or envious person always values the gain of
others negatively).
Taken together, social dilemmas and social preferences present a challenging environment in which to understand and influence travel behaviour.
Habitual behaviour
Research by Kenyon and Lyons (2003) reveals that in general people are multi-modal travellers. However, this does not imply that they are particularly flexible in choosing their means of travel. Rather it means that for different purposes and different (types of) destinations, people tend to make use of different modes. It is therefore inappropriate to label individuals as ‘car users’, ‘public transport users’, ‘cyclists’ or ‘pedestrians’ because in most cases individuals are, at different times, some or all of these.
individual will have a primary and default means of travel predetermined through habit. ‘Primary’ refers to their preferred and normal means of travel. ‘Default’ refers to the alternative means of travel they (automatically) turn to if for some reason their primary means of travel is unavailable.
Such observations tend to fly in the face of standard economic theory that has been employed for many years in interpreting and modelling travel behaviour and choice. Such theory assumes individuals to be rational, optimising agents (as noted earlier). Lee (2002) offers a critique which argues that such an approach is untenable. Human beings are not ‘lightning calculators’ able to continuously optimise their behaviour. Indeed it is argued that the prospect of maximising choice is becoming harder rather than easier in the Information Age. The time and/or cost of obtaining and processing data that promises increasingly to allow the individual to move towards optimisation can exceed the benefit of the move towards optimisation that can be achieved. Lee argues that such information overload “forces actors to employ habits and rules for reducing the set of search space in order to comprehend the high volume of information”. Consequently individuals when making travel choices are inclined, in the face of the ‘cost’ of searching for the optimal outcome, to settle for a ‘good enough’ solution. It is in this way that travel habits are formed and indeed car dependence becomes more deeply embedded.
Our present ‘economics-oriented’ representation of travel choices is therefore arguably naïve or at least too simplistic.
Are we then able to challenge and change habitual behaviour? The brief critique above could spell worrying news for those in the business of providing traveller information services (many of whom will, at least in the past, have tended to be aligned to the economics-based interpretation of choice).
Kenyon and Lyons (2003) argue that information can influence choice. The challenge is in minimising the ‘cost’ of individuals being able to compare travel alternatives. This can then have particular merit in situations where long term habit and a ‘good enough’ approach to travel choices has rendered an individual’s awareness or perceptions of viable and perhaps better travel alternatives outdated, misguided or simply no longer something that is part of their consciousness.
The UK Government is currently pursuing its vision for a service that could address this challenge. Transport Direct (Lyons et al, 2003) aims to provide a one-stop-shop multi-modal traveller information service, initially via the web, to allow individuals to compare travel options across modes and to plan, book and pay for journeys and receive real-time update information. The explicit hope is that for some people, for some journeys and on some occasions this will result in changes to travel choices which include retiming of journeys, alternatives routes or ultimately the decision to use an alternative to the car.
There are also natural junctures in people’s lives when greater opportunity exists to change behaviour, namely life stages or life events. At such junctures personal circumstances can typically be changed significantly. The Government’s UK-Online service (www.ukonline.gov.uk/) focuses on such life events as learning to drive, having a baby, moving home, looking after someone and retirement. At these points, when individuals will be more inclined to review and appraise their options (including those for travel), there is an opportunity to target efforts to positively change behaviour and establish new, more sustainable habits.
Pain, gain and the media
The media are adept at exploiting the public’s fear of change and the prospect of pain. Such things can grab the public’s attention. Ever after the ‘bad news’ story, the media will invariably elect to dwell upon and promote the (potential) pain of planned or imminent change rather than the potential gain that may be realised following change. Gain is a ‘good news’ story of far less value in terms of column inches.
Consider an example of a family moving house. The pressure to move has been created by the offer of a new job to the head of the household. This brings with it an increased household income and the opportunity to live in a nicer dwelling (the gain). The parents recognise or at least perceive that once the move is complete they will have attained a better quality of life. As such they are prepared to endure the pain (real not perceived) of the moving process – dealing with estate agents, house hunting and the cost and logistical nightmare of moving.
The children, meanwhile, perceive from the moment news of the intended move is announced that their lives will suffer – the familiarity and security of what they know will be taken away, they will lose their friends and they will have to go to a new, strange and unwelcoming school.
The reality beyond the move for the children is that they love their new home, they make new friends quickly and have done some growing up in the process. All members of the household have attained a gain which was, on reflection, worth the pain.
This example differs in one key respect from that of the politician preparing to introduce traffic restraint measures. The agents at work in manipulating the attitudes and perceptions of those who are fearing the pain of change are performing different roles. In the example of the house move, the children’s parents and other friends and relatives offer the children repeated reassurances about the move – focusing on the gain rather than the pain. The Government and indeed the public are afforded no such reassurances from the local and national media when new restrictive transport measures are proposed or are being introduced – focus is on the pain rather than the gain.
Human versatility and adaptability to change is a huge opportunity that is seldom exploited by decision makers and politicians in transport. Three alternative or complementary lines of approach would be required to change this situation:
1. Educate the public to be able to see through the media hype and have faith in a gain with (possible) pain culture.
2. Work with the media to identify ways in which promotion of the gain rather than the pain can be made newsworthy (and preferably more so than news (only) of the pain).
3. Notwithstanding the timescales of politics, adopt a resolute approach to introducing change with a preparedness to ‘ride the storm’ of media hype and public opinion and a firm belief that the post-change gain will restore and even begin to build public confidence.
At the very least, we have now seen evidence that the third line of approach can work. The Mayor of London came under intense public and media pressure in the run up to introducing congestion charging in Central London. On the morning of its introduction (Monday 17 February 2003), The Times carried the headline ‘Late payers spark fears of traffic charge chaos’. The Daily Mirror headlined the issue with ‘Mayhem Fear as Congestion Charge Arrives’. Meanwhile the Sun was providing cut-out number plates for its readers showing ‘5OD U KEN’. The following morning the corresponding headline from The Times was ‘The day the lights turned green’ and the Daily Mirror proclaimed ‘Not a Jam in Sight as Feared Plan Begins’. Since then in the wake of the scheme being hailed largely as a success, the media has shown a distinct lack of interest.
Functional thinking
The Table below provides an important reality check to those who are engaged in the research, promotion or industry of transport technologies. Terms used in this field such as ‘Intelligent Transport Systems’ and ‘Advanced Traveller Information Systems’ are prone to be misleading. Strictly speaking the terms ‘intelligent’ and ‘advanced’ refer to the technological sophistication of the applications and solutions being advocated though they can wrongly infer that such solutions will be effective (Lyons, 2002).
Table 3. Key features that have shaped images of the future role of new technologies in transport (adapted from Geels and Smit, 2000)
Contemporary concerns and hopes
Perceptions of the future are shaped and coloured by current problems and aspirations resulting in optimistic rather than plausible scenarios
New
technological trajectories
The pathway of technological innovation and product development may significantly change introducing new possibilities and expectations concerning the role in, and impacts on society of the technology
New for old substitution
The role of a new technology is often phrased in terms of replacing or
substituting the old technology whilst in reality old and new technologies often co-exist, serving different markets, circumstances or purposes.
Social practices neutral
It is often wrongly assumed that the pool of social practices and needs remains unchanged thereby implying that new technology will (only) substitute certain social practices. In reality the pool of social practices can increase.
Narrow functional thinking
Through only functional thinking, new technologies can be judged capable of enabling the purpose of an activity to be fulfilled. This neglects to consider other social and psychological aspects of an activity that may not be addressed.
Societal embedding
The process of societal embedding of new technologies can be viewed an unproblematic when in practice many social and institutional adjustment processes have to take place which may not be straightforward and can take some time to achieve.
Hopeful monstrosities
Promoters in particular of an emerging technology can voice unrealistically high expectations. This may be to serve the purpose of creating a ‘breathing space’ for investment and development to continue. It may also be a
consequence of neglecting the co-evolution of technology and society, and underestimating the practical difficulties and resulting slowness of processes of societal embedding of technology.
This is not to devalue the role of new technologies since they will undoubtedly, for better or worse, be significant in the future of transport. Sometimes these ‘intelligent’ systems are indeed effective. The intention rather is to sound a cautionary note concerning the decisions we make and the approaches we adopt when seeking to take advantage of what technology has to offer.
Although the commentary in Table 3 relates particularly to future transport technologies it raises issues of significance more generally for planners and policymakers who are working to influence future travel behaviour. One point in particular in the Table merits further discussion in this paper, namely the often narrow functional thinking that is applied in relation to (planned) developments.
Survey (reported in ONS, 2003a), 48 per cent of men like non-food shopping and 38 per cent like going to the shops to buy food. This compares to 75 per cent and 51 per cent of women respectively.
Social need can raise a number of other questions for transport. For example why is it that in a survey of over 1000 commuters in the US (Mokhtarian and Solomon, 2001) the average reported ideal one-way commute time was not zero but 16 minutes? One suggested reason is that people value a transition time between work and home.
In the case of males the reason may be even more rudimentary still. In his well know work ‘Men are from Mars, Women are from Venus’, Gray (1993) highlights and explores the distinctly different nature and styles of communication of men and women (analogous perhaps with the degree of communication or lack of it between the engineers and economists and the sociologists!). He refers to men needing to retreat into their caves for undisturbed time to think and reflect. For modern man without a cave at his disposal, viable substitutes are the toilet or the sealed environment of their motor car. The daily commute therefore may be enabling an important social function to be satisfied.
Conclusion
This paper has sought firstly to endorse the need now for tough but realistic policies and actions for transport. It has highlighted the broader social policy context in which transport now sits and the principles of sustainable development that cut across all policy areas.
Against this backdrop the case has been made that if transport is to develop in such a way as to support society then transport experts must become more adept at making and understanding the links between transport and society. Achieving this will necessitate a greater engagement of the transport studies community with the social sciences and notably disciplines such as sociology and psychology.
The paper has attempted to paint a picture of past and present UK society and to consider the transport and travel implications. Lastly it has sought, from the social sciences perspective, to identify and interpret some of the key sociological factors at work in relation to human actions and behaviour with a view to identifying opportunities to positively influence travel behaviour.
One could not hope to do justice to such a vast topic as ‘transport and society’ in a single paper and a number of areas and issues should not be deemed unimportant by virtue of their brief or absent coverage. For example the importance of the distinction between mobility and access when considering transport developments cannot be overstated. This in turn leads to the complex topic of social exclusion and its relationship with transport which is the subject of a recent report by the Government’s Social Exclusion Unit (SEU, 2003). The need to recognise and act upon the interactions between land use and transport is of similar importance to the interactions between transport and society. There has also not been space to challenge the longstanding approach to, and assumptions made in, the economic appraisal process in the UK in relation to transport schemes. Neither has the wide range of environmental impacts upon society resulting from transport been addressed.
The paper has perhaps succeeded in complicating our interpretation of transport rather than narrowing down from the existing pool of knowledge to the point of offering specific advice to the policymakers. For this no apology is made. It is, however, acknowledged that ultimately this will be an important consideration to be borne in mind. For knowledge and understanding to be effective it must be made accessible to decision makers and conveyed in such a way that enables them to act upon it.
It is the author’s belief that future success lies in taking bold steps to ensure car use is rationalised. This does not imply that car use as a whole is bad. Rather it emphasises that as a society we need to limit car use to the journeys and circumstances for which it is the most sensible means of travel.
For the reasons outlined in this paper it is also the author’s belief that rationalising car use cannot be left to the individual. The prevalence of social norms and The Voter’s Paradox dictates that Government must take the lead. To this end the congestion charging scheme in London is to be applauded. It has succeeded in administering a collective ‘kick up the backside’ to the City’s motorists with favourable effect.
Traffic restraint will not be needed at all times and places. When and where it is deemed necessary it will be crucial that politicians feel able to provide consistent and full support. We still have much to do in rising to the challenge of how to keep the public and media on side when tough but effective decisions are called for.
Let us hope that the written words of the experts today will not, in a further forty years from now, be seen to have fallen on deaf political ears. Buchanan and his team could not have foreseen the arrival of the Information Age or certainly not in the form it has taken nor in terms of the speed in which it has been evolving. For the coming forty years not only is it hoped that decision makers will be more far sighted and resolute in acting upon the advice of their transport experts, but also that they will seek to harness the opportunities of non-corporeal means of access that the Information Age has brought. Future transport must have accessibility not mobility at its heart.
References
Ajzen, I. (1991). The Theory of Planned Behavior. Organizational Behavior and Human Decision Processes, 50, 179-211.
Buchanan, C. et al (1963). Traffic in Towns. HMSO.
Chatterjee, K. and Lyons, G. (2002). Travel Behaviour of Car Users During the UK Fuel Crisis and Insights into Car Dependence. In Lyons, G. and Chatterjee, K. (eds.) Transport Lessons from the Fuel Tax Protests of 2000, Ashgate, 123-160.
Commission on the Social Sciences (2003). Great Expectations: the Social Sciences in Britain. March, Academy of Learned Societies for the Social Sciences. Available (as at 15/04/03): http://www.soc.surrey.ac.uk/~scs1ng/C.Univ-Gt.Expectations.pdf
DfT (2002). Transport Statistics Great Britain: 2002 Edition. Department for Transport, October, TSO, London. Available (as at 16/04/03): http://www.transtat.dft.gov.uk/tables/tsgb02/
DEFRA (2003). Achieving a better quality of life – review of progress towards sustainable development. Government annual report 2002, Department for Environment, Food & Rural Affairs. Available (as at 15/04/03): http://www.sustainable-development.gov.uk/ar2002/index.htm DETR (1998a). A New Deal for Transport- Better for Everyone. Transport White Paper, TSO,
London. Available (as at 15/04/03): http://www.dft.gov.uk/itwp/paper/index.htm
DETR (1998b). Guidance on the new approach to appraisal. TSO, London. Available (as at 15/04/03): http://www.dft.gov.uk/itwp/appraisal/guidance/
DETR (2000a). Transport Act 2000. TSO, London.
DETR (2000b). Transport 2010: The Ten Year Plan. July, TSO, London.
Dix, M. (2003). Congestion Charging in Central London. in Thomas, S. (Ed) Sharing in Success – Good News in Passenger Transport, Chapter 3, CICC, Cambridge.
Fehr, E. and Fischbacher, U. (2002). Why social preferences matter – the impact of non-selfish motives on competition, cooperation and incentives. The Economic Journal, 112 (March), C1-C33. Felkins, L. (2001). An Introduction to the Theory of Social Dilemmas. Available (as at 15/04/03):
http://www.magnolia.net/~leonf/sd/sd-1.html
Geels, F.W. and Smit, W.A. (2000). Failed technology futures: pitfalls and lessons from a historical survey. Futures, 32(2000), 867-885.
Goodwin, P.B. (1997). Solving Congestion (when we must not build roads, increase spending, lose votes, damage the economy or harm the environment, and will never find equilibrium). Inaugural Lecture for the Professorship of Transport Policy, University College London, 23 October. Available (as at 15/04/03): http://www.cts.ucl.ac.uk/tsu/pbginau.htm
Goodwin, P.B. (2003). Towards a Genuinely Sustainable Transport Agenda for the UK. in Docherty, I. and Shaw, J. (eds.) A New Deal for Transport, Blackwells, in press.
Gray, J. (1993). Men are from Mars, Women are from Venus. HarperCollins Publishers, London. Kenyon, S. and Lyons, G. (2003). The Value of Integrated Multimodal Information and its Potential
Contribution to Modal Change. Transportation Research Part F - Traffic Psychology and Behaviour, 5(4), 267-287.
Lee, W. (2002). The challenge of institutional theory to neo-classical view on optimising behaviour. Available (as at 15/04/03): www.doc.ic.ac.uk/~wwhl/download/management-essay.pdf
Lyons, G. (2001). From Advanced Towards Effective Traveller Information Systems. In: Hensher, D. Ed. Travel Behaviour Research The Leading Edge, Chapter 47, 813-826, International Association of Travel Behaviour Research, Pergamon.
Lyons, G. (2003). Future mobility - it's about time. Proc. 35th Universities Transport Study Group Conference, January, Loughborough.
Lyons, G., Harman, R., Austin, J. and Duff, A. (2003). Integrated Traveller Information - Transport Direct. In Hine, J. and Preston, J. (Eds.) Integrated Futures and Transport Choices: UK Transport Policy Beyond the 1998 White Paper and Transport Acts, Aldershot, Ashgate, 68-89.
Ministry of Transport (1967). Better use of town roads. HMSO, London.
Mokhtarian, P.L. and Salomon, I. (2001). How derived is the demand for travel? Some conceptual and measurement considerations. Transportation Research A, 35, 695-719.
Morton, H.V. (Ed) (1934). The Pageant of the Century. Odhams Press Ltd, London.
ONS (2003a). Social Trends. No. 33 – 2003 edition, Office for National Statistics, TSO, London. ONS (2003b). Population Trends No 113, Autumn, Office for National Statistics, TSO, London. SEU (2003). Making the Connections: Final Report on Transport and Social Exclusion. February,
Social Exclusion Unit.
Smeed Report (Commitee chaired by Professor Ruben Smeed) (1964). Road Pricing: The Economic and Technical Possibilities. Ministry of Transport (former), HMSO, London.
Stead, M., MacKintosh, A.M., Tagg, S. and Eadie, D. (2002). Changing Speeding Behaviour in Scotland: An Evaluation of the ‘Foolsspeed’ Campaign. Scottish Executive Social Research, TSO, Edinburgh.
Steer Davies Gleave (2003). Survey of Members of the Transport Planning Society. February, Transport Planning Skills Initiative. Available (as at 29/10/03): http://www.tps.org.uk/library/ TPSI-TPS_member_survey_270203.pdf
Therborn, G. (2002). Back to Norms! On the Scope and Dynamics of Norms and Normative Action. Current Sociology, 50(6), 863-880, SAGE.
Truelove, P. (1999). 50 Years of Transport Planning. In Cullingworth, J.B. (Ed.) British Planning:Fifty Years of Urban and Regional Planning, Athlone Press.
TPS (2002). Confronting Realities. Transport Planning Society website. Available (as at 15/04/03): http://www.tps.org.uk/activities/policy/policy.htm
UN (2002). World Population Prospects: The 2002 Revision. United Nations Population Division. Available (as at 15/04/03): http://esa.un.org/unpp/