The impact of menu label design on visual attention, food
choice and recognition: an eye tracking study
REALE, Sophie and FLINT, Stuart
Available from Sheffield Hallam University Research Archive (SHURA) at:
http://shura.shu.ac.uk/12714/
This document is the author deposited version. You are advised to consult the publisher's version if you wish to cite from it.
Published version
REALE, Sophie and FLINT, Stuart (2016). The impact of menu label design on visual attention, food choice and recognition: an eye tracking study. Journal of Sensory Studies, 31 (4), 328-340.
Copyright and re-use policy
See http://shura.shu.ac.uk/information.html
1
The impact of menu label design on visual attention, food choice and recognition: An
1
eye tracking study
2
3
Sophie Reale,1 Stuart William Flint2,3
4
5 1
School of Health and Related Research, University of Sheffield, United Kingdom 6
2
Academy of Sport and Physical Activity, Sheffield Hallam University, United Kingdom 7
3
Centre for Sport and Exercise Science, Sheffield Hallam University, United Kingdom 8
9
10
*Requests for reprints should be addressed to Sophie Reale, School of Health and Related 11
Research, Regent Court, Sheffield, S1 4DA, United Kingdom, email: 12
14
15
16
17
18
19
20
21
22
23
24
2
Abstract
26
Nutritional labelling on menus has been found to promote informed food choices and reduce 27
information asymmetry between manufacturers and consumers. However, lack of attention to 28
nutritional labels limits their effectiveness. This study manipulated the way in which 29
nutritional information was provided on menus in aim of enhancing visual attention to the 30
most health relevant information. A between-subject design was implemented with three 31
experimental conditions (non-directive label; directive label; semi-directive label). A total of 32
84 participants chose meals off a starter, main and desert menu whilst their eye movements 33
were tracked using Tobii eye tracking software. Results showed that the menu labels did not 34
significantly differ in their attentional gaining properties however the use of colour and health 35
logos led participants to choose meals containing significantly less calories compared to 36
when nutritional information was presented in black text alone. These findings indicate that 37
nutritional information should be provided in colour or as health logos as this has the largest 38
impact on food choice. 39
Practical Applications
40
A factor contributing to the rise in obesity prevalence is the obesogenic environment that we 41
live in. The population has become increasingly reliant on convenience foods and dining out 42
which has led to excess calorie consumption. Menu labelling has been identified as a possible 43
intervention that could be employed by policy makers to guide informed food choices. 44
However, there are calls for further actions and intervention to improve food choice as menu 45
labelling has had mixed effects upon consumer choice and consumption. This study suggests 46
that menu labelling is a viable option when the nutritional information is presented in a 47
visually salient way. The use of colours and health logos attracts consumer’s attention to the 48
most health relevant information which could contribute to efforts in reducing obesity and 49
other illnesses linked to unhealthy consumption. 50
Keywords: menu labelling; food choice; eye tracking; visual attention; obesity
51
52
53
54
55
3
Introduction
57
Obesity is a nutrition related disease that has more than doubled in the UK in the past 58
25 years. Currently 24.8% of adults and 15% of children in the UK are classified as obese; 59
therefore it is considered a significant health problem (National Health Service 2013). 60
Nutrition plays a key role in achieving and maintaining a healthy body weight. However, 61
there has been a concomitant increase in the marketing of unhealthy food, poor dietary 62
choices in the British population, and increased prevalence of obesity and associated chronic 63
illness (Fung et al. 2015; Huang et al. 2015). Efforts to reduce the continuing prevalence of 64
obesity have steered towards focusing primarily on reducing energy intake and promoting 65
healthier consumption (Valaquez and Pasch 2014). 66
Factors that influence dietary intake are complex and varied, including taste 67
preferences, beliefs and values about nutrition. Typically, consumers engage in automatic, 68
intuitive decisions regarding food choice that are guided by heuristics (Milosavljevic and 69
Cerf 2008). Health policy and nutritional-related initiatives such as labelling can impact 70
consumers' knowledge of food, health and subsequent food choice (Grunert et al. 2010). 71
Research examining the impact of labelling has primarily focused on food packaging, with 72
increased attention in recent years to menu labelling whilst dining out. Meals eaten out of 73
home are predominantly larger in portion size and contain larger quantities of saturated fat 74
compared to traditional home cooked meals (Bassett et al. 2007). The presence of nutritional 75
information on packaged foods does not act as a precursor for nutritional awareness when 76
dining out (Grunert, Bolton and Raats 2012). Thus, a need for labelling on menus to increase 77
consumer awareness in restaurant environments was evident, and in 2009 the Food Standards 78
Agency (FSA) developed a voluntary menu labelling scheme for the UK catering industry to 79
promote healthier consumption when dining out (Seiders and Petty 2004). A total of 450 80
stores, from 21 well-known high street brands, agreed to display calorie information for their 81
food and drink items, with an overall aim to reduce calorie intake such that it was 82
significantly impactful on health at a population level (Morley et al. 2013). 83
84
Menu labelling
85
Menu labelling has been reported to significantly impact food choice in a UK obese 86
population such that a reduction in calories selected was observed (Reale and Flint 2016). 87
4
has been conducted in the USA (e.g., Pulos and Leng 2010) as catering establishments 89
retailing at 20 or more outlets have to provide calorie information on menus as part of the 90
Patient Protection and Affordable Care Act (ACA; Pizam 2011). Angell and Silver (2008) 91
reported that nutritional information presented at the point-of-purchase led to a decrease in 92
calorie intake by 15% in a fast-food outlet. In alignment, Chu, Frongillo, Jones and Kaye 93
(2009) reported similar findings when examining the impact of nutritional values in a 94
cafeteria setting. The average calories purchased significantly decreased from 839 kcal to 667 95
kcal showing a 20% reduction. Importantly, there were no differences in the total number of 96
entrees sold therefore the reduction in calories were resultant of consumers selecting less 97
energy dense foods. However, in some cases menu labelling has been found to have no 98
impact on food preference (Harnack et al. 2008; Finkelstein et al. 2011). This has questioned 99
the cost effectiveness of such intervention as extensive time and precision is required to 100
provide accurate nutritional information, especially when the catering industry is continually 101
making changes to the foods on offer (Lazareva 2015). 102
One possible explanation for the contrasting evidence is menu label design. Harnack 103
et al. (2008) provided four fast food restaurant menus to participants as part of a between 104
subject design. The calorie information was presented between the food item and price which 105
resulted in just over half of the participant’s reporting that they had seen the calorie 106
information (54%). However, Chu et al. (2009) provided nutritional information on larger 107
labels measuring 5 x 3 inches (height and width) and guided participants towards the 108
information using a space divider to ensure the information was read. In similar studies 109
whereby menu labelling had been presented in large text (Cinciripini 1984) and coloured 110
fonts (Milich, Anderson and Mills 1976) a significant impact on food choice has also been 111
reported. This suggests that visual attention to nutritional information plays a key role in 112
consumer use of information and may explain why menu labelling had no impact when 113
provided on a drive-thru menu in Kings County (Finkelstein et al. 2011). 114
The health consciousness of the individual also plays a part in the use of nutritional 115
information. Health conscious consumers tend to act in accord to their internal attitudes, and 116
thus, are more sensitive to behavioural consequences. They will actively search for the 117
nutritional information to guide their choices when menu labelling is present (Gould 1990; 118
Visschers, Hess and Siegrist 2010). Alternatively, less health conscious consumers without 119
nutrient specific goals are unlikely to have their attention drawn towards the most health 120
5
determined by attention and the visual saliency of the information within the visual field. 122
Label information salience is determined by characteristics of the label itself against the 123
background of the micro and macro context suggesting that labels need to be presented in a 124
way that will attract consumer’s attention towards the most health relevant information 125
(Bialkova and van Trijp 2010). 126
127
Nutrition label manipulation
128
Visual graphics have been reported as a powerful motivator for ordering behaviour 129
(Hanks et al. 2012). When used on coloured advertisements they captured participants’ 130
attention quicker and for a longer duration of time than black and white advertisements, in an 131
eye tracking study of the yellow pages (Lohse 1997). Similar findings have been reported 132
when consumers were presented with nutritional information on labels that had been made 133
more salient within the visual field (Bialkova and van Trijp 2010). The crucial factors in 134
determining visual attention to labels and the initial phase of searching include shape, 135
contrast (Clement et al 2013) and colour, especially when nutritional labels are affected by 136
competing clutter dimensions (Bialkova et al 2013). Even though the debate remains 137
regarding how nutritional information should be presented (Feunekes et al. 2008), these 138
studies support the notion that colours, font and logos can draw attention to stimuli by 139
separating specific items from one another (Kershaw 2009). Based on these findings, a 140
typology of labelling formats was recently suggested (Hodgkins et al. 2012) in relation to the 141
degree to which they allow consumers to draw conclusions about the healthfulness of a 142
product (Grunert and Wills 2007). Three designs were constructed: namely non-directive, 143
semi-directive and directive. 144
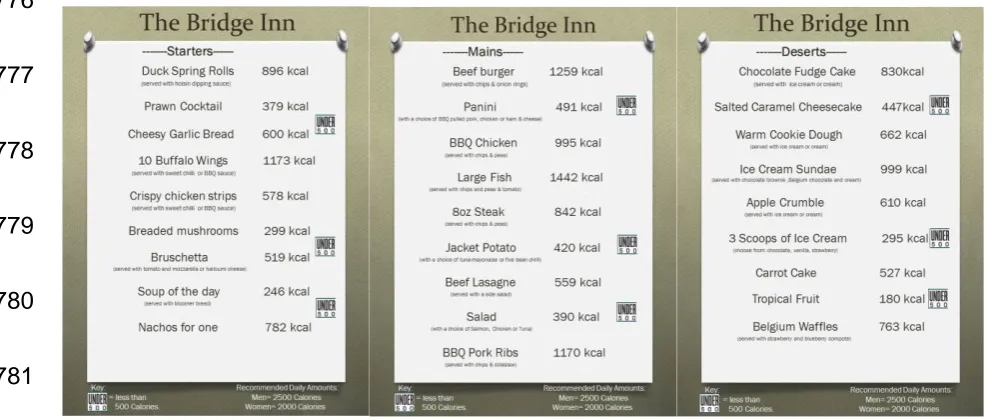
Non-directive labels are currently being used on menus as part of the ACA (Pizam 145
2011). They provide no information of the products healthiness, other than stating the 146
calorific values of food items on the menu. Semi-directive labels include a partial evaluation 147
of nutritional content through colour. For example, the traffic light labelling system 148
encourages consumers to consider the foods they select based on the evaluation of nutritional 149
content (Borgmeier and Westenhoefer 2009). Finally, directive labels use health logos to 150
guide consumers' attention to the healthiest items in an all or nothing format (van Herpen and 151
van Trijp 2011). Logos reduce cognitive effort thus they are beneficial in promoting healthier 152
6
information to guide their decisions (Russo et al. 1986). Health consciousness can be 154
measured using inventories such as the health and nutritional awareness questionnaire which 155
is a validated tool (Kempen et al. 2012). However, Hodgkins et al. (2012) typology of 156
labelling formats have not been utilised on menus, and whilst previous research (e.g., 157
Bialkova et al 2014) demonstrates that they may be effective in improving food choice when 158
purchasing packaged foods, the impact on food choice from a menu is yet to be understood. 159
Traditional approaches measuring nutritional label used have relied upon self-report 160
methods (Cowburn and Stockley 2005; Higginson et al 2002; Kelly et el 2009), surveys and 161
questionnaires (Roberto et al 2012; Steenhuis et al 2010). These processes are limited as two 162
assumptions are made regarding the level of awareness in the processing of nutrition 163
information and the level of introspection in reporting information processing (van Trijp 164
2009). These limitations have stimulated methodological innovation including approaches 165
based on the visual search methodology (Bialkova and van Trijp 2010; Bialkvoa Grunert and 166
van Trijp 2013) and eye tracking measurements (Graham et al 2012). 167
When visual search methodologies were enforced (Bialkova and van Trijp 2010; 168
Bialkvoa Grunert and van Trijp 2013), attention, as indicated by performance, was better with 169
monochromatic than polychromatic colouring, in particular GDA’s. Neuroscience research 170
has demonstrated that this is resultant of the extra brain regions involved in processing colour 171
(Zeki and Marini 1998). However, these findings contradict consumer studies which may be 172
due to the paradigms and measures used. Jones and Richardson (2006) examined the impact 173
of labelling on attention and food choice in a supermarket using eye tracking technology. The 174
use of eye tracking in menu labelling research is sparse; however it is suggested as a useful 175
tool as it is less susceptible to social desirability than participant recall methods (Graham, 176
Orquin and Visschers 2012). It is also well established and widely used in psychology for 177
capturing attention (e.g. Rayner 1998; 2009). The study found that the semi-directive label 178
captured consumers’ attention quickly which made it easier for consumers to evaluate the 179
healthfulness of the item compared to the non-directive labelling design. 180
Similarly, Bialkova et al. (2014) reported that label design was found to significantly 181
impact both the number and duration of fixations, such that participants’ attention was drawn 182
to the semi-directive labelling system significantly more than the non-directive label. This 183
increased the products likelihood of being selected, providing further evidence that attention 184
is drawn to semi-directive labels. However, both of these studies only compared two of the 185
7
found contrasting results when comparing all three labelling designs. The semi-directive label 187
impacted food preferences, but its attention gaining properties and abilities to enhance 188
selection beyond the level achieved in the directive labelling condition was not significant. It 189
was the directive labelling system using health logos that enhanced attention resulting in 190
participants making informed food choices. However, 30% of consumers reported that taste 191
preference was the main reason for food choice, and therefore irrespective of health logos, 192
remained a considerable factor in the decision making process as continuously found in the 193
literature (Grunert, Wills and Fernandez-Celemin 2010). These studies provide some 194
indication as to how labelling design impacts attentional capture and food choice, but they are 195
not without limitation. The results represent the impact of nutritional labels on pre-packaged 196
foods and therefore cannot be generalised to a dining out occasion where no time constraint 197
applies (Drichoutis, Lazaridis and Nayga 2006). 198
Labelling appears to be an effective method of promoting informed food choices. 199
However, despite concerns raised regarding food choice when dining out, there is a lack of 200
research examining the effectiveness of menu labelling and thus, warrants investigation. 201
Research to date has predominantly focused on consumers' comprehension of the information 202
(e.g., Roberto et al. 2012) with only a handful of studies examining the effect of nutritional 203
labelling on visual attention and these were limited to pre-packaged foods (Jones and 204
Richardson 2006). A general concern emerging from this line of research is whether 205
consumers notice and use the nutrition information in their final food choice decisions 206
(Bialkova Grunert and van Trijp 2013). It is important to know what attracts consumers 207
attention to nutrition labels and whether these labels have any influence on consumer 208
purchase decisions (Bialkova and van Trijp 2010). It is still unknown how nutritional 209
information on menus is absorbed and retrieved as no research to date has examined what 210
consumers attention is drawn to throughout exposure of menu labelling (i.e., from first 211
fixation during initial exposure, during final food choice and in retrieval). Therefore, the 212
current study examined the impact of menu labelling design on visual attention, food choice 213
and recognition of information. 214
Based on current evidence relating to the impact of labelling four hypotheses were 215
offered: 216
1. In line with Jones and Richardson (2006), the semi-directive and directive 217
labelling design were expected to attract participants attention quicker 218
8
2. In line with Bialkova et al. (2014), the semi-directive and directive labelling 220
design were expected to draw participant’s attention to the information 221
significantly more thus resulting in more frequent observations than the non-222
directive label (visit count; fixation count; fixation duration). 223
3. Participants will select food items containing the lowest calorie content in the 224
semi-directive and directive labelling conditions in accordance to previous 225
literature (Van Herpen and Van Trijp 2011). 226
4. Greater recognition of nutritional information is hypothesised in the directive 227
and semi-directive condition as it will be attended to more, thus will be 228
processed more effectively (and subsequently recognised) than the non-229
directive condition (Bialkova et al 2014). 230
Methods
231
Participants
232
A convenience sample of 84 participants were recruited from Sheffield Hallam 233
University ensuring a small effect size (=.15) and adequate level of power (=.77). The sample 234
included both university staff and students aged 18 years or above (mean = 23.58 ± 5.84) 235
with a mean body mass index (BMI) of 23.94 ± 4.23 kg·m2. Participants were excluded from 236
the study if classified as blind or colour blind to prevent invalidating findings. 237
Procedure
238
Following ethical approval, a pilot study was conducted in 6 participants from 239
Sheffield Hallam University (female = 50%) who were above the age of 18 (21.45 ± 3.43) 240
and had a mean BMI of 22.95 ± 5.72 kg·m2. Based on the pilot study, an additional task was 241
added to the eye tracking section of the study. It was determined that short term memory 242
could not be measured validly in the recognition task. Therefore, long term memory would be 243
measured. A maze was added for 120 seconds before the recognition task, to ensure that the 244
time between tasks was controlled. 245
On entering the eye tracking studio, participants were provided with the information 246
sheet and were offered the opportunity to ask questions about the study, before signing the 247
informed consent form. Initially, participants completed a demographic form and the HNA 248
(Kempen et al. 2012). Participants were then seated 65 cm in front of a 24 inch monitor with 249
built in Tobii Studio software (Tobii T60) where they were randomly allocated to an 250
9
system; 2= directive labelling system; 3= semi-directive labelling system; see Figures 1-3), to 252
reduce practise effects in line with previous research (van Herpen and van Trijp 2011; Field 253
2009). At this point the principal investigator left the room allowing participants to complete 254
the eye tracking section of the study alone to prevent distractions and social desirability 255
effects (Lohse and Johnson 1996). 256
On screen instructions firstly directed participants to fixate on a black dot presented in 257
the centre of a red circle. Participants were asked to follow the dot as it moved around the 258
screen for 10 seconds to calibrate the participant’s eye movement to the eye tracking camera. 259
Green lines were produced once the participant's eye movements were calibrated, indicating 260
that the eye tracking element of the study could begin. 261
The first element of the eye tracking study required participants to select one food 262
item off the starter, main and desert menu in accordance to the forced choice model. To 263
replicate a natural restaurant setting no time restraint was implemented (Drichoutis et al.
264
2006) and participants were asked to imagine that they were dining out for an evening meal 265
(Brown 2014). Once participants selected their food items, they were directed to solve a maze 266
presented on the screen simply with eye movements. The task was limited to 120 seconds to 267
ensure that time between tasks was controlled. After 120 seconds, regardless of maze 268
completion, the recognition task begun. A previously shown food item from each menu was 269
displayed on the screen for 5 seconds. For each previously shown food item, three calorific 270
values were presented. One of the values was presented previously on the menu and thus was 271
the correct calorific value for that food item. The other two values were fictional but 272
remained within a range of 25% to reduce participant's reliance on guesswork when 273
instructed to select which value they thought was correct (Monroe, Powell and Choudhury 274
1986). At this point, the eye tracking element of the study was complete and participants 275
were instructed to complete the FCQ (Steptoe et al. 1995). The principal investigator then 276
returned to provide a full verbal and written debrief to the participant. 277
Measures
278
The Health and Nutritional Awareness Questionnaire (HNA; Kempen et al. 2012) is a 279
reliable measure of health consciousness relevant to two dimensions (Cronbach Alpha: 280
Health awareness α = 0.86, nutritional lifestyle behaviours α = 0.84). It consists of 21 281
statements each rated on a 5 point Likert scale from 1-5 (strongly disagree to strongly agree). 282
10
This measurement was included as there is evidence suggesting that health consciousness 284
determines the effects of internal attitudes and external influences on consumer behaviour 285
(Gould 1990). 286
The Food Choice Questionnaire (FCQ; Steptoe, Pollard and Wardle 1995) measures
287
the motives that underpin food choice, pertinent to nine dimensions (Cronbach alpha: weight 288
control α = 0.79; mood α = 0.83; convenience α =0.81, health α =0.87; natural content α = 289
0.84; price α = 0.82; familiarity α = 0.70; ethical concern α = 0.70; sensory appeal α = 0.70). 290
A review of the FCQ suggested that an improved version should include less categories and 291
items, to increase robustness (Fotopoulos et al. 2009). Therefore, the categories price, 292
convenience and ethical concern were removed, as they were not relevant to the study. The 293
modified FCQ contained 18 statements, rated on a 4 point Likert scale from 1-4 (not true to 294
very true). Thus overall scores for each scale ranged from 3 to 12. 295
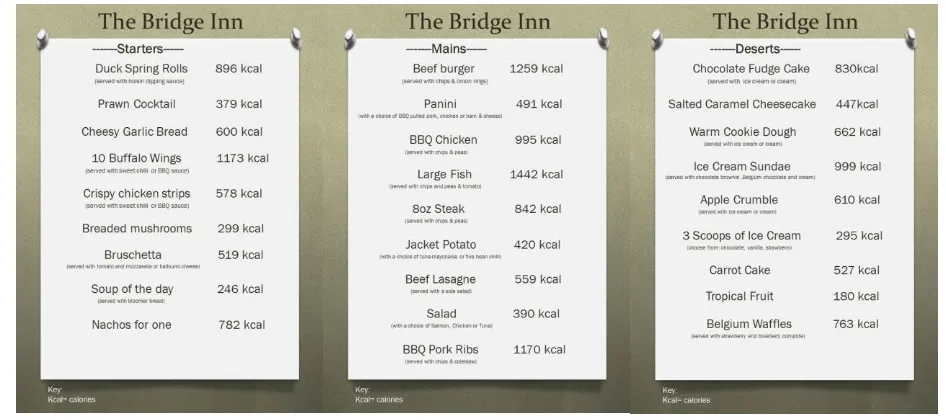
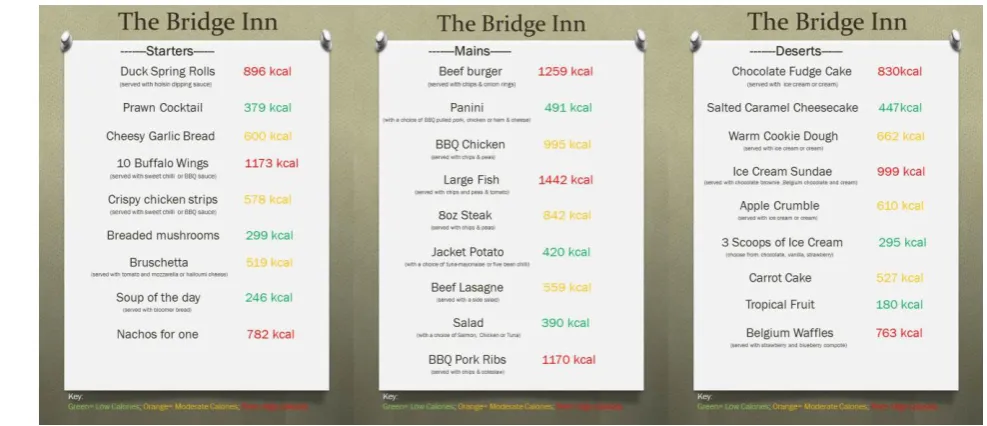
Menu Design: A starter, main and desert menu included 9 items randomly chosen from a 296
well-known dining out establishment, where nutritional information is readily available. A 297
menu from a sit-down service restaurant was chosen to address previous studies limitations 298
that have predominantly used menus from fast-food outlets (e.g., Angell and Silver 2008). 299
The menu contained three meals of low, medium and high calorie options to ensure there was 300
no tendency towards high or low options. Price was removed in line with previous findings, 301
as it is the most influential factor in the food choice process; therefore its inclusion may have 302
invalidated findings (Roseman, Mathe-Soulek and Higgins 2013). Three designs were used as 303
these are the three main labelling schemes currently used on packaged food in the EU: 304
condition one presented calorie information in black text in accordance to the non-directive 305
labelling design; condition two used health logos as part of the directive labelling design; and 306
condition three employed a colour-coded traffic light labelling system as part of the semi-307
directive labelling design (Storcksdieck et al. 2010). For all experimental conditions the 308
calorific value of meals selected was recorded. 309
Visual Attention: An area of interest (AOI) was created around the nutritional 310
information presented on the menus. The AOI had five measures which were calculated using 311
the Tobii eye tracker software (Tobii TX300): 1) Time to first fixation (time from the first 312
menu display until the participant first fixated on the AOI); 2) Total fixation duration (total 313
time of all fixations in the AOI); 3) Fixation count (the number of times a participant fixated 314
on an AOI) and 4) Visit count (the number of times a participant visits an AOI including both 315
11
that participants fixated on; Bialkova and van Trijp 2011). The software used a velocity 317
threshold method to define saccades and fixations. When the velocity of the Fovea was 318
higher than 30 visual degrees per second, the eye movement was defined as a saccade. 319
Anything lower was defined as a fixation. The binocular sampling rate was set at 60 Hz and 320
allowed for freedom of head movement in a 41 x 21 cm virtual box (TobiiPro 2015). 321
Recognition Task: To identify whether learning had taken place following the presentation of 322
nutritional information, a recognition task based on the forced choice model was included 323
(Brown 2014). The crucial feature was that participants were not asked to memorise anything 324
and that under a false pretence, they were presented with calorific values, and thus learning 325
was incidental in nature (Laureati et al. 2011). Visual short term memory was not measured 326
as instructions had to be provided immediately before the task thus inhibiting immediate 327
memory capture. Therefore, long term memory was measured following a 120 second task 328
(Baddely and Hitch 1974). The task consisted of completing a maze, rather than popular 329
counting tasks, to prevent numerical values interrupting memory retrieval of the calorific 330
values (Ricker, Cowan and Morey 2010). 331
Data Analysis
332
A multivariate analysis of covariance (MANCOVA) was run in SPSS (Version, 21) to 333
determine how menu labelling design impacts visual attention, food choice and recognition, 334
when controlling for health consciousness. Health consciousness was used as a covariate due 335
to individual differences in information processing (Gould 1990) and attentional capture 336
(Visschers et al. 2010). All assumptions for the inferential test and the covariate were met 337
following the calculation of descriptive statistics (Table 2). Where a main effect was 338
established, pairwise comparisons were used to follow up significant effects. For all analyses 339
α was set at .05. Internal consistency for the modified FCQ was determined by calculating 340
Cronbach Alpha. 341
342
Results
343
The experimental groups consisted of near to equal sex distribution as shown in Table 344
1. There was no significant difference for age (F(2,81) = .06, p > .05, 2p= .01) or BMI 345
12
Visual Attention
347
The directive labelling (Condition 2) design captured participant's visual attention 348
more quickly than the semi-directive (Condition 3) and non-directive (Condition 1) labelling 349
design. This resulted in participants fixating on the nutritional information in the directive 350
labelling condition for the longest length of time, as shown by the largest fixation duration 351
and count (See Table 2). Participants also returned to the information during the decision 352
making process in the directive labelling condition, but this was more frequent when the 353
information was provided with colours in the semi-directive condition. There was no main 354
effect for time to first fixation (F(2,81) = .30, p > .05, p2 = .01), fixation duration (F(2, 81) = 355
2.08, p > .05, 2p= .05), fixation count (F(2,81) = 2.28, p > .05, 2p= .05) or visit count 356
(F(2,81) = 2.31, p > .05, 2p = .05) for menu labelling design. However, there was a 357
significant difference in the amount of nutrition information that was fixated upon (F(2, 81) = 358
150.84, p > .001, p2 = .79). Participants in the semi-directive and directive labelling 359
condition fixated upon all the nutritional information, whereas participants in the non-360
directive conditions fixated on 41.93 ± 4.73% of the nutritional information provided. 361
When controlling for health consciousness there was also no main effect for time to 362
first fixation (F(2, 81) = .23, p > .05, 2p= .01), fixation duration (F(2,81) = 1.75, p > .05, 2p 363
= .04), fixation count (F(2,81) = 1.96, p > .05, 2p= .05) or visit count (F(2,81) = 2.54, 364
p > .05, 2p= .06) for menu labelling design. However, there was a significant difference in 365
the amount of nutrition information that was fixated upon (F(2, 81) = 110.08, p > .001, 2p 366
= .81). Participants in the semi-directive and directive labelling condition fixated upon all the 367
nutritional information, whereas participants in the non-directive conditions fixated on 41.93 368
± 4.73% of the nutritional information provided. 369
Food Choice
370
Participants in the non-directive labelling system chose meals containing the highest 371
mean energy content compared to when a partial evaluation of overall healthiness was 372
provided with semi-directive and directive labels (see Table 2). The MANOVA showed that 373
there was a main effect for content of meals selected based on the menu labelling condition 374
13
for health consciousness (F(2,81) = 6.95, p < .01, 2p= .15). Pairwise comparisons identified 376
that the food selected was significantly lower in calories in the directive (p < .05) and semi-377
directive (p < .05) conditions in comparison to the non-directive condition. 378
Recognition
379
As show in Figure 1, the largest proportion of participants to accurately recognise all 380
three calorific values were those that chose meals in the directive (N=5) and semi-directive 381
condition (N=5). Participants who observed the nutritional information in the non-directive 382
condition recorded the most incorrect answers (N=4; Figure 1). However, in all three 383
conditions the mean accuracy score and time taken was similar (see Table 2), resulting in no 384
main effect for recognition accuracy (F(2, 81) =.75, p > .05, 2p= .02) or time taken (F(2, 81) 385
= 2.13, p > .05, 2p= .05) for menu labelling design. This was also observed when controlling 386
for health consciousness: recognition accuracy (F(2, 81) =.66, p > .05, p2 = .02) and time 387
taken (F(2, 81) =.73, P > .05, 2p = .02). 388
Reason for Food Choice
389
In all three conditions the most influential factor of food choice was sensory appeal. 390
However, participants were more concerned about their personal health and weight, as well 391
as the food item’s natural content, when nutritional information was presented in the directive 392
and semi-directive conditions compared to the non-directive condition. Yet, there was no 393
main effect for food choice based on natural content (F(2,81) = 1.09, p > .05, p2= .02), 394
weight control (F(2,81) = 1.25, p > .05, 2p = .03), health concern (F(2,81) = 1.71, p > .05, 395
2
p
= .04), sensory appeal (F(2,81) = .85, p > .05, 2p= .02), mood (F(2,81) = 1.05, p > .05, 396
2
p
= .03) or familiarity (F(2,81) = 2.26, p > .05, 2p= .05) in the three menu labelling 397
conditions. This was also observed when controlling for health consciousness: natural content 398
(F(2,81) = .75, p > .05, p2= .02), weight control (F(2,81) = 1.25, p > .05, p2= .03), health 399
concern (F(2,81) = 2.27, p > .05, 2p = .05), sensory appeal (F(2,81) = .86, p > .05, 2p= .02), 400
mood (F(2,81) = .90, p > .05, p2= .02) and familiarity (F(2,81) = 2.35, p > .05, 2p= .06). 401
402
Discussion
14
Eye tracking technology was used to examine the impact of menu labelling design on 404
attention gaining properties and establish whether and how label design impacts food choice 405
and recognition. Three labelling designs were employed that differed in their ‘directiveness’, 406
referring to the degree to which they allow consumers to draw conclusions about the 407
healthfulness of a food item (Grunert and Wills 2007). This study found that visual attention 408
and recognition of the nutritional information did not significantly vary by label design, 409
however label design did significantly impact food choice. 410
Visual Attention
411
When participants were presented with nutritional information on menus, time to first 412
fixation did not significantly vary by menu labelling design in contrast with previous research 413
research (Bialkova et al 2014). Therefore, hypothesis 1 was not met. However, the directive 414
and non-directive label, employing a monochromatic colour scheme, showed slightly higher 415
attentional capture than the semi-directive label, which employed a traffic light colour 416
scheme. These findings are in line with previous literature that compared the attentional 417
gaining properties of monochromatic and polychromatic colouring on nutritional labels 418
(Bialkova and van Trijp 2010, Bialkova Grunert and van Trijp 2013) whereby it has been 419
demonstrated that processing colour coded information takes extra time, as more brain 420
regions are involved in processing this information (Zeki and Marini 1998). This outcome 421
contrasts consumer preference for coloured labels (Kelly et al 2009). Consumers have been 422
reported to understand and interpret colour more efficiently at high levels of cognitive 423
processing than when provided with monochromatic labels. Therefore, suggesting that colour 424
coding effects may vary by level of information processing (Bialkova and van Trijp 2010). 425
During the decision making process, participant’s observed less than half of the 426
nutritional information when it was presented in black text. This finding is in line with 427
research that recorded participants self-reported observations of nutritional information on 428
menus (Harnack et al 2008). When nutritional information has been provided in a visual 429
salient way and received initial attention, an impact on food choice has been reported (Chu et
430
al 2009; Cinciripini 1984; Milich, Anderson and Mills 1976). This finding was replicated in 431
the current study whereby participants in the directive and semi-directive labelling condition 432
who fixated upon significantly more nutritional information provided on the menus had 433
slightly larger fixation durations in comparison to the non-directive label. However, fixation 434
15
Furthermore, nutritional information was viewed slightly less frequently, as indicated 436
by visit and fixation count, when presented in black text compared to the logo and traffic 437
light colour scheme. This difference was not significant and contradicts previous research 438
(Bialkova et al 2014; Jones and Richardson 2006). This may be resultant of participant 439
familiarity. Repeated exposure over time has been shown to enhance consumers learning and 440
familiarity to the nutritional information which subsequently affects attention processes with 441
consumers requiring less time to process information they are familiar with. This concept was 442
supported in Bialkova and van Trijp (2011) study that reported a decrease in the fixation 443
count when consumers were familiar with the label format. Therefore, participant’s fixation 444
and visit count may not have been significantly different due to prior familiarity with the 445
labels provided as they are currently employed on packaged foods in the UK and on some 446
restaurant menus as part of a voluntary menu labelling scheme (FSA 2009). 447
Alternatively, no significant differences in attentional data may have been reported 448
due to the subtle changes enforced to the label design, such that the visually manipulated 449
labels were unable to significantly shift participants’ attention towards the lowest calorie food 450
items (Wansink, Shimizu and Camps 2012). Label design represents an important 451
opportunity for enhancing visual attention (Graham et al. 2012). Hodgkins et al. (2012) 452
typology of labels were derived from a consumer sorting task thus using a typology that aims 453
to make a distinction based on processing requirements for attentional gaining properties may 454
explain why no significant differences were found. Furthermore, label design is not the only 455
factor in which can be manipulated. Consumers have been found to exhibit a bias towards 456
items within a certain location on a menu, also known as the sweet spot. This generally tends 457
to be in the centre of the display which increases the likelihood of that item being selected by 458
60% (Reutskaja et al. 2011). The label design therefore may have been competing for visual 459
attention against a predominant location that the participants were observing. With this in 460
mind it is possible that placing the lowest calorie food items in the centre of the menu could 461
enhance visual attention and steer consumers towards informed food choices. However, 462
further study is required before drawing such conclusion. 463
Food Choice
464
The current study found that label design significantly impacted food choice in the 465
decision making process. Participants chose menu items containing significantly less calories 466
in the directive and semi-directive labelling condition compared to the non-directive 467
16
2011). This may have been a resultant effect of time to first fixation. Even though time to 469
first fixation was not significantly different between conditions, it was slightly quicker in the 470
directive and semi-directive labelling conditions. Evidence suggests that processing of 471
attended information occurs ‘as soon as possible’ (Just and Carpenter, 1980) and acts as a 472
determining factor to elaborate a decision. Therefore, if the attended information is relevant 473
for the intentional decision to be made, then the likelihood of choosing that particular food 474
item increases (Reutskaja et al 2011; Bialkova and van Trijp 2011). These food items are 475
known as trigger foods which once exposed to, can set the tone for the entire meal such that 476
exposure to a low calorie appetiser is 8 times more likely to encourage low calorie 477
consumption for the rest of the meal (Hanks et al. 2012; Wansink and Love 2014). 478
A 17-25% reduction was observed in the directive and semi-directive labelling 479
condition in comparison to the non-directive condition, in line with previous menu labelling 480
studies (Chu et al. 2009; Liu et al. 2012). This reduction equates to a 368 to 528 calorie 481
deficit (semi-directive and directive labelling conditions respectively) which if consumed in 482
excess is equivalent to gaining approximately 8 pounds a year (Cutler, Glaeser and Shapiro 483
2003). Therefore, menu labelling appears to be a particularly relevant intervention to employ 484
in the UK given that consumers reportedly eat out at least once in every six dining occasions 485
(FSA, 2009). 486
Menu label design did not significantly impact motives for food choice; however the 487
current study indicated that participants became slightly more concerned about their weight 488
and health when nutritional information was presented with health logos and colours. 489
Consumers appear to have low awareness of the high calorific content of meals when dining 490
out (Berman and Lavizzo-Mourey 2008). The level of comprehension required to understand 491
nutritional information is easily reduced when attentional capturing properties are enhanced. 492
This has been found to have the largest impact on positive lifestyle changes such as a clearer 493
association between consumption and health (Fogg 2009). However, in accordance to 494
previous studies (e.g., Grunert et al. 2010), sensory appeal remained to be the most influential 495
factor in the decision making process. This finding may appear to be concerning given that 496
menu labelling aims to encourage informed food choices. However, menu labelling must be 497
done in a way to prevent negative perceptions of taste. Low calorie foods are often associated 498
with low sensory appeal (Wansink and Hanks 2013) which can lead to compensatory 499
behaviours, such as overeating (Chandon and Wansink 2007). With this in mind it has been 500
17
foods to enhance consumer taste expectations (Wansink and Love 2014). However, the 502
current study indicates that this may not be needed, as directive and semi-directive labels 503
were found to maintain perceived sensory appeal which could subsequently reduce 504
compensatory behaviours. 505
Recognition
506
The outcome of the recognition task appears to be closely related to the visual 507
attention data. There was no significant difference in the accuracy of the recognition task 508
which opposes hypothesis 4. Eye movements are associated with information processing 509
(Rayner and Castelhano 2008) and the deeper the information is processed the easier it is to 510
be retrieved. However, attentional capture does not imply that comprehension will be 511
improved. Instead, recognition relies on memory and further processing of nutritional 512
information, rather than being a pure measure of attention which may explain why no 513
differences were found between labelling conditions (Bialkova and van Trijp 2010). 514
Furthermore, when the number of alternatives increases consumers often become more 515
selective in the information they encode through heuristics strategies (Payne, Bettman and 516
Johnson 1993). Therefore, deep encoding may not always be possible as the brains 517
information capacity is limited. 518
Implications
519
The implications of the current study are that menu labelling can improve consumer 520
food choice when dining out, and thus should be considered by policy makers. There are calls 521
for further actions and intervention to improve food choice and this study suggests that menu 522
labelling is a viable option that can be enforced. Enforcement of menu labelling could 523
contribute to efforts in reducing obesity and other illnesses linked to overconsumption of high 524
energy dense foods (Bezerra et al. 2012). More specifically, when nutritional information is 525
displayed as health logos or in accordance to the traffic light system, it appears to capture 526
visual attention and encourage consumers to spend a longer duration processing the 527
nutritional information. Repeated exposure to menu labelling may lead to an improved 528
awareness of calorie content when dining out (Bettman 1979) which could consequently 529
enhance informed daily food choices. Restaurants may consider providing lower calorie 530
options to meet the consumer demand as these foods are generally more profitable (Wansink 531
and Chandon 2014). 532
Limitations and Future Research
18
This study makes an important contribution to the menu labelling literature; however, 534
it is not without limitations. First, the study was conducted in an eye tracking laboratory thus 535
hypothetical choices were observed rather than actual food choices. This increases the 536
likelihood of social desirability biases and does not allow conclusions to be drawn on energy 537
consumption (Morley et al. 2013). Second, food choices were based on the forced choice task 538
which mandated participants to choose a starter, main and desert item, whereas in reality they 539
may have chosen a different amount (Brown 2014). Third, participants chose food items after 540
completing the HNA and the menu items were presented in a fixed order which may have 541
created a priming or order effect (Dayan and Bar-Hillel 2011). Furthermore, the current 542
sample were relatively young which reduces the generalisability of the findings given that 543
nutritional label use is influenced by demographic factors such as gender, age, education 544
level and income (Sarink et al 2016). A larger sample may have increased the statistical 545
power ensuring the study was not exploratory in nature. Having said this, the current study's 546
findings were similar to previous research conducted in a natural setting, implying that 547
environmental and social influences may not impact food choice to the extent that attentional 548
capture does (Chu et al. 2009). Irrespective, future research should test the impact of menu 549
labelling in a real life setting to accurately examine consumer visual attention to menu 550
labelling and its subsequent effect on food choice and consumption. 551
552
Conclusion
553
The current study is a useful addition to consumer psychology and menu labelling 554
research examining the impact of menu label design on visual attention, food choice and 555
recognition by using eye tracking technology. The findings suggest that presenting nutritional 556
information in health logos or colour captures and maintains visual attention such that it has a 557
significant impact on food choice. Consumers became more concerned about their health and 558
weight management which reduced the calorie content of food selected. The UK should 559
therefore consider implementing menu labelling nationwide to enhance informed food 560
choices and reduce the prevalence of obesity and associated ill health. 561
562
19
References
564
ANGELL, S. and SILVER, L. 200). Calorie Labeling in New York City Restaurants: An 565
Approach to Inform Consumers. Retrieved August 22, 2015, from 566
http://www.cspinet.org/reports/generationexcess/nycdh.pdf 567
ARES, G., GIMENEZ, A., BRUZZONE, F., VIDAL, L., ANTUNEZ, L. And MAICHE, A. 568
2013. Consumer Visual Processing of Food Labels: Results from an Eye‐Tracking 569
Study. J. Sensory Stud. 28, 138-153. 570
BADDELEY, A. and HITCH, G. 1974. Working memory. Psychol Learn. Motiv. 8(1), 47-89. 571
BASSETT, M., DUMANOVSKY, T., HUANG, C., SILVER, L., YOUNG, C., NONAS, C. 572
And FRIEDEN, T. 2008. Purchasing behavior and calorie information at fast-food 573
chains in New York City, 2007. Am. J. Public Health. 98(8), 1457-1459. 574
BERMAN, M. and LAVIZZO-MOUREY, R. 2008. Obesity prevention in the information 575
age: caloric information at the point of purchase. J. Am. Med. Assoc. 300(4), 433-435. 576
BEZERRA, I., CURIONIi, C. and SICHIERI, R. 2012. Association between eating out of 577
home and body weight. Nutr. Rev. 70(2), 65-79. 578
BETTMANN, J. 1979. Memory factors in consumer choice: A review. J. Marketing. 43(2), 579
37-53. 580
BIALKOVA, S., GRUNERT, K. and VAN TRIJP, H. 2013 Standing out in the crowd: The 581
effect of information clutter on consumer attention for front-of-pack nutrition labels. 582
Food Policy. 41, 65-74. 583
BIALKOVA, S. and VAN TRIJP, H. 2010. What determines consumer attention to nutrition 584
labels? Food Quality and Preference.21(8), 1042-1051. 585
BIALKOVA, S. and VAN TRIJP, H.2011. An efficient methodology for assessing attention 586
to and effect of nutrition information displayed front-of-pack. Food Qual. Prefer. 22(6), 587
592-601. 588
BIALKOVA, S., GRUNERT, K., JUHL. H., WASOWICZ-KIRYLO, G., STYSKO-589
KUNKOWSKA, M. and VAN TRIJP, H. 2014. Attention mediates the effect of 590
nutrition label information on consumers’ choice. Evidence from a choice experiment 591
involving eye-tracking. Appetite. 76(1), 66-75. 592
BORGMEIER, I. and WESTENHOEFER, J. 2009. Impact of different food label formats on 593
healthiness evaluation and food choice of consumers: a randomized-controlled study. 594
BMC public health. 9(1), 184. 595
BROWN, A. 2014. Item response models for forced-choice questionnaires: A common 596
20
CHANDON, P. and WANSINK, B. 2007. The biasing health halos of fast-food restaurant 598
health claims: lower calorie estimates and higher side-dish consumption intentions. J. 599
Consum. Res. 34(3), 301-314. 600
CHU, Y., FRONGILLO, E., JONES, S. and KAYE, G. 2009. Improving patrons' meal 601
selections through the use of point-of-selection nutrition labels. Am. J. Public Health. 602
99(11), 2001. 603
CINCIRIPINI, P. 1984. Changing food selection in a public cafeteria: An applied behaviour 604
analysis. Behav. Modif. 8, 520-539. 605
CLEMENT, J., KRISTENSEN, T. and GRØNHAUG, K. 2013. Understanding consumers' 606
in- store visual perception: The influence of package design features on visual 607
attention. Journal of Retailing and Consumer Services.XXXXX 608
COWBURN, G. and STOCKLEY, L. 2005. Consumer understanding and use of nutrition 609
labelling: a systematic review. Public Health Nutrition,8(1), 21-28. 610
CUTLER, D., GLAESER, E. and SHAPIRO, J. 2003. Why have Americans become more 611
obese? J. Econ. Perspect. 17(3), 93-118. 612
DAYAN, E. and BAR-HILLELl, M. 2011. Nudge to nobesity II: Menu positions influence 613
food orders. Judgm. Decis. Mak. 6(4), 333-342. 614
DRICHOUTIS, A., LAZARIDIS, P. and NAYGA, R. 2006. Consumers’ use of nutritional 615
labels: a review of research studies and issues. Acad. Market. Science Rev. 9(9), 1-22. 616
FEUNEKES, G., GORTEMAKER, I., WILLEMS, A., LION, R. and VAN DEN KOMMER, 617
M. 2008. Front-of-pack nutrition labelling: testing effectiveness of different nutrition 618
labelling formats front-of-pack in four European countries. Appetite. 50(1), 57-70. 619
FIELD, A. 2009. Discovering statistics using SPSS: And sex and drugs and rock 'n' roll. 620
London: SAGE. 621
FINKELSTEIN, E., STROMBOTNE, K., CHAN, N. and KRIEGER, J. 2011. Mandatory 622
menu labeling in one fast-food chain in King County, Washington. Am. J. Prev. Med. 623
40(2), 122-127. 624
FOGG, B. 2009.. A behavior model for persuasive design. In Proceedings of the 4th
625
international Conference on Persuasive Technology (p. 40). ACM. 626
FOOD STANDARDS AGENCY. 2009. Calorie Labelling and Nutrition Information in 627
Catering. Retrieved August 22, 2015, from 628
http://collections.europarchive.org/tna/20100927130941/http://food.gov.uk/healthiereat 629
21
FOTOPOULOS, C., KRYSTALLIS, A., VASSALLO, M and PAGIALIA, A. 2009. Food 631
Choice Questionnaire (FCQ) revisited. Suggestions for the development of an enhanced 632
general food motivation model. Appetite, 52(1), 199-208. 633
FUNG, T., PAN, A., HOU, T., CHIUVE, S., TOBIA, D., MOZAFFARIAN, D and HU, F. 634
2015. Long-Term Change in Diet Quality Is Associated with Body Weight Change in 635
Men and Women. J. Nutr. 145(8), 1850-1856. 636
GOULD, S. 1990. Health consciousness and health behavior: The application of a new health 637
consciousness scale. Am. J. Prev. Med. 6(4), 228-237. 638
GRAHAM, D.,ORQUIN, J. and VISSCHERS, V.2012. Eye tracking and nutrition label use: 639
A review of the literature and recommendations for label enhancement. Food Policy. 640
37(4), 378–382.
641
GRUNERT, K., BOLTON, L. and RAATS, M. 2012. Processing and acting on nutrition 642
labeling on food. Florida: Routledge Academic. 643
GRUNERT, K., FERNANDEZ-CELEMIN, L., WILLS, J., GENANNT BONSMANN, S. 644
and NUREEVA, L. (2010). Use and understanding of nutrition information on food 645
labels in six European countries. J. Public Health. 18(3), 261-277. 646
GRUNERT, K. and WILLS, J. 2007. A review of European research on consumer response 647
to nutrition information on food labels. J. Public Health. 15(5), 385-399. 648
GRUNERT, K., WILLS, J. and FERNANDEZ-CELEMIN, L. 2010. Nutrition knowledge, 649
and use and understanding of nutrition information on food labels among consumers in 650
the UK. Appetite. 55(2), 177-189. 651
HANKS, A., JUST, D., SMITH, L., WANSINK, B. and DYSON, J. 2012. Healthy 652
convenience: nudging students toward healthier choices in the lunchroom. J. Public 653
Health. 34(3), 370-376. 654
HARNACK, L., FRENCH, S., OAKES, J., STORY, M., JEFFERY, R. and RYDELL, S. 655
(2008). Effects of calorie labeling and value size pricing on fast food meal choices: 656
results from an experimental trial. Int. J. Behav. Nutr. Phys. 5(1), 63. 657
HIGGINSON, C. S., KIRK, T. R., RAYNER, M. J. and DRAPER, S. 2002. How do 658
consumers use nutrition label information? Nutrition & Food Science. 32(4), 145-152. 659
HODGKINS, C., BARNETT, J., WASOWICZ-KIRYLO, G., STYSKO-KUNOWSKA, M., 660
GULCAN, Y., KUSTEPLI, Y. and RAATS, M. 2012. Understanding how consumers 661
categorise nutritional labels. A consumer dervied typology for front-of-pack nutrition 662
22
HUANG, T., QI, Q., ZHENG, Y., LEY, S., MANSON, J., HU, F. and QI, L. 2015. Genetic 664
Predisposition to Central Obesity and Risk of Type 2 Diabetes: Two Independent 665
Cohort Studies. Diabetes care. 38(7), 1306-1311. 666
JONES, G. and RICHARDSON, M.2006. An objective examination of consumer perception 667
of nutrition information based on healthiness ratings and eye movements. Public Health 668
Nutr. 10(3), 238–244.
669
KELLY, B., HUGHES, C., CHAPMAN, K., LOUIE, J. C.-Y., DIXON, H., CRAWFORD, J., 670
KING, L., DAUBE, M. and SLEVIN, T. 2009. Consumer testing of the acceptability 671
and effectiveness of front-of-pack food labelling systems for the Australian grocery 672
market. Health Promotion International. 24(2), 120-129. 673
KEMPEN, E., MULLER, H., SYMINGTON, E. and VAN EEDEN, T. 2012. A study of the 674
relationship between health awareness, lifestyle behaviour and food label usage in 675
Gauteng. S.Afr. J. Clin. Nutr. 25(1), 15-21. 676
KERSHAW, S. 2009. Using menu psychology to entice diners. Retrieved August 22, 2015, 677
from http://www.nytimes.com/2009/12/23/dining/23menus.html?pagewanted=all&_r=0 678
LAUREATI, M., PAGLIARINI, E., MOJET, J. and KOSTER, E. 2011. Incidental learning 679
and memory for food varied in sweet taste in children. Food Qual. Prefer. 22(3), 264-680
270. 681
LAZAREVA, Y. 2015. Can nutrition menu labelling positively influence consumer food 682
choices? A review of the literature. Surrey Undergraduate Research Journal. 1(1) 1-8. 683
LIU, P., ROBERTO, C., LIU, L. And BROWNELL, K. 2012. A test of different menu 684
labeling presentations. Appetite. 59(3), 770-777. 685
LOHSE, G. and JOHNSON, E. 1996. A comparison of two process tracing methods for 686
choice tasks. In Proceedings of the Twenty-Ninth Hawaii International Conference on
687
System Sciences (Vol. 4, pp. 86-97). IEEE. 688
MILICH, R., ADERSON, J. and MILLS, M. 1976. Effects of visual presentation of caloric 689
values on food buying by normal and obese persons. Percept. motor skill.42, 155-162. 690
MILOSAVLJEVIC, M. and CERF, M. 2008. First attention then intention: Insights from 691
computational neuroscience of vision. Int. J. Advert. 27(3), 381-398. 692
MONROE, K., POWELL, C. and CHOUDHURY, P. 1986. Recall versus recognition as a 693
measure of price awareness. Adv. Consum. Res. 13(1), 594-599. 694
MORLEY, B., SCULLY, M., MARTIN, J., NIVEN, P., DIXON, H. and WAKEFIELD, M. 695
2013. What types of nutrition menu labelling lead consumers to select less energy-696
23
NATIONAL HEALTH SERVICE 2013. Britain: ‘the fat man of Europe’. Retrieved August 698
22, 2015, from http://www.nhs.uk/livewell/loseweight/pages/statistics-and-causes-of-699
the-obesity-epidemic-in-the-uk.aspx 700
PAYNE, J., BETTMAN, J., & JOHNSON, E. 1993. The adaptive decision maker. 701
Cambridge: University Press. 702
PIZAM, A. 2011. Menu labeling: the new trend. Int J. Hosp. Manag. 30(2), 221-224. 703
PULOS, E. and LENG, K. 2010. Evaluation of a voluntary menu-labeling program in full-704
service restaurants. Am. J. Public Health. 100(6), 1035. 705
RAYNER, K. 1998. Eye movements in reading and information processing. Psychological 706
Bulletin. 85(3), 618-660. 707
RAYNER, K. 2009. Eye movements and attention in reading, scene perception, and visual 708
search. The Quarterly Journal of Experimental Psychology. 62(8), 1457-1506. 709
RAYNER, K. and CASTELHANO, M. S. 2008. Eye movements during reading, scene 710
perception, visual search, and while looking at print advertisements. Visual marketing: 711
From attention to action. 1(1), 9-42. 712
REALE, S., and FLINT, S. W. (2016). Menu labelling and food choice in obese adults: a 713
feasibility study. BMC obesity. 3, 17. 714
REUTSKAJA, E., NAGEL, R., CAMERER, C. And RANGEL, A. 2011. Search dynamics in 715
consumer choice under time pressure: An eye-tracking study. Am. Econ. Rev. 101(2), 716
900-926. 717
RICKER, T., COWAN, N., & MOREY, C. 2010. Visual working memory is disrupted by 718
covert verbal retrieval. Psychon. Bulletin & Review. 17(4), 516-521. 719
ROBERTO, C., BRAGG, M., SEAMANS, M., MECHULAN, R., NOVAK, N. and 720
BROWNELL, K. 2012. Evaluation of consumer understanding of difference front-of-721
package nutrition labels, 2010-2011. Prev. chron. dis. 9(1), 149-161. 722
ROSEMAN, M., MATHE-SOULEK, K. and HIGGINGS, J. 2013. Relationships among 723
grocery nutrition label users and consumers’ attitudes and behavior toward restaurant 724
menu labeling.Appetite. 71(1), 274-278. 725
RUSSO, J., STAELIN, R., NOLAN, C., RUSSELL, G. and METCALF, B. 1986. Nutrition 726
information in the supermarket. J. Consum. Res. 13(1), 48-70. 727
SARINK, D., PEETERS, A., FREAK-POLI, R., BEAUCHAMP, A., WOODS, J., BALL, K. 728
& BACKHOLER, K. 2016. The impact of menu energy labelling across 729
24
SEIDERS, K. and PETTY, R. 2004. Obesity and the role of food marketing: A policy 731
analysis of issues and remedies. J. Public Policy Mark. 23(2), 153-169. 732
STEENHUIS, I. H. M., KROEZE, W., VYTH, E. L., VALK, S., VERBAUWEN, R. & 733
SEIDELL, J. C. 2010. The effects of using a nutrition logo on consumption and 734
product evaluation of a sweet pastry. Appetite. 55(3), 707-709. 735
STEPTOE, A., POLLARD, T. and WARDLE, J. 1995. Development of a measure of the 736
motives underlying the selection of food: the food choice questionnaire. Appetite. 737
25(3), 267-284. 738
STORCKSDIECK, S., FERNANDEZ, L., LARRANAGA, A., EGGER, S., WILLS, J.M., 739
HODGKINS, C. & RAATS, M. 2010. Penetration of nutrition information on food 740
labels across the EU-27 plus Turkey. Eur. J. Clin. Nutr. 64, 1379-1385. 741
TOBIIPRO. 2015. Eye Tracking Software: Tobii Studio. Retrieved August 22, 2015, from 742
http://www.tobii.com/eye-tracking-research/global/products/software/tobii-studio-743
analysis-software/ 744
VAN HERPEN, E. And VAN TRIJP, H. 2011. Front-of-pack nutrition labels. Their effect on 745
attention and choices when consumers have varying goals and time constraints. 746
Appetite. 57(1), 148-160. 747
VAN TRIJP, H. C. M. 2009. Consumer understanding and nutritional communication: Key 748
issues in the context of the new EU legislation.48(1), 41-48. 749
VALAZQUEZ, C. and PASCH, K. 2014. Attention to food and beverage advertisements as 750
measured by eye-tracking technology and the food preferences and choices of youth. J. 751
Acad. Nutr. Diet. 114(4), 578-582. 752
VISSCHERS, V., HESS, R., & SIEGRIST, M. 2010. Health motivation and product design 753
determine consumers’ visual attention to nutrition information on food products. Public 754
health nutr. 13(7), 1099-1106. 755
VON RESTORFF, H. 1933. Ober die wirkung von bereichsbildungen im spurenfeld. 756
Psychologische Forschung, 18(1), 299-342. 757
WANSINK, B. and CHANDON, P. 2014. Slim by design: Redirecting the accidental drivers 758
of mindless overeating. J. consum. psychol. 24(3), 413-431. 759
WANSINK, B. and HANKS, A. S. 2013. Slim by design: serving healthy foods first in buffet 760
lines improves overall meal selection. PloS one. 8(10), e77055- e77059. 761
WANSINK, B. and LOVE, K. 2014. Slim by design: Menu strategies for promoting high-762
25
WANSINK, B., SHIMIZU, M. and CAMPS, G. 2012. What would Batman eat?: Priming 764
children to make healthier fast food choices. Pediatr. Obes. 7(2), 121-123. 765
ZEKI, S. & MARINI, L. 1998. Three cortical stages of colour processing in the human brain. 766
26
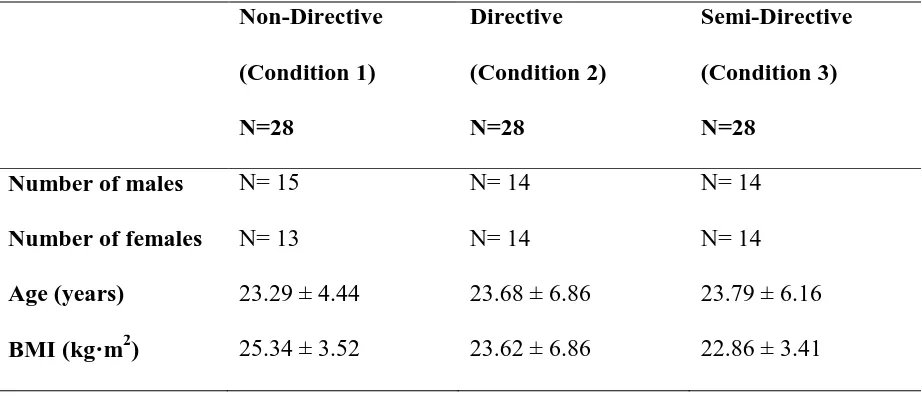
Table 1 Participants’ demographic information for each experimental condition (mean and 768
standard deviation) 769
Non-Directive
(Condition 1)
N=28
Directive
(Condition 2)
N=28
Semi-Directive
(Condition 3)
N=28
Number of males N= 15 N= 14 N= 14
Number of females N= 13 N= 14 N= 14
Age (years) 23.29 ± 4.44 23.68 ± 6.86 23.79 ± 6.16
BMI (kg·m2) 25.34 ± 3.52 23.62 ± 6.86 22.86 ± 3.41
[image:27.595.68.529.113.311.2]27
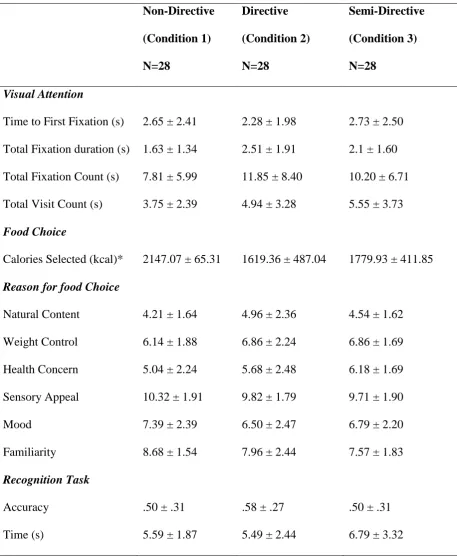
Table 2 Visual attention, food choice, reason for food choice and recognition of nutritional 771
information (mean and standard deviation) following the provision of menu labelling 772
Non-Directive
(Condition 1)
N=28
Directive
(Condition 2)
N=28
Semi-Directive
(Condition 3)
N=28
Visual Attention
Time to First Fixation (s) 2.65 ± 2.41 2.28 ± 1.98 2.73 ± 2.50
Total Fixation duration (s) 1.63 ± 1.34 2.51 ± 1.91 2.1 ± 1.60
Total Fixation Count (s) 7.81 ± 5.99 11.85 ± 8.40 10.20 ± 6.71
Total Visit Count (s) 3.75 ± 2.39 4.94 ± 3.28 5.55 ± 3.73
Food Choice
Calories Selected (kcal)* 2147.07 ± 65.31 1619.36 ± 487.04 1779.93 ± 411.85
Reason for food Choice
Natural Content 4.21 ± 1.64 4.96 ± 2.36 4.54 ± 1.62
Weight Control 6.14 ± 1.88 6.86 ± 2.24 6.86 ± 1.69
Health Concern 5.04 ± 2.24 5.68 ± 2.48 6.18 ± 1.69
Sensory Appeal 10.32 ± 1.91 9.82 ± 1.79 9.71 ± 1.90
Mood 7.39 ± 2.39 6.50 ± 2.47 6.79 ± 2.20
Familiarity 8.68 ± 1.54 7.96 ± 2.44 7.57 ± 1.83
Recognition Task
Accuracy .50 ± .31 .58 ± .27 .50 ± .31
Time (s) 5.59 ± 1.87 5.49 ± 2.44 6.79 ± 3.32
[image:28.595.69.527.134.692.2]28 774
29 776
777
778
779
780
[image:30.595.37.534.79.289.2]781
30 783
784
785
786
787
[image:31.595.61.555.70.283.2]788