Home energy management system over low-power
narrowband PLC
IKPEHAI, Augustine and ADEBISI, Bamidele
Available from Sheffield Hallam University Research Archive (SHURA) at:
http://shura.shu.ac.uk/23887/
This document is the author deposited version. You are advised to consult the
publisher's version if you wish to cite from it.
Published version
IKPEHAI, Augustine and ADEBISI, Bamidele (2016). Home energy management
system over low-power narrowband PLC. In: 2016 10th international symposium on
communication systems, networks and digital signal processing (CSNDSP). IEEE.
Copyright and re-use policy
See
http://shura.shu.ac.uk/information.html
Sheffield Hallam University Research Archive
Home Energy Management System over Low-Power
Narrowband PLC
Augustine Ikpehai
1, Bamidele Adebisi
2School of Engineering, Manchester Metropolitan University, Manchester, UK.
{augustine.ikpehai@stu.mmu, b.adebisi@mmu}.ac.uk
Abstract—The need for efficient use of energy has inspired intelligent load control strategies in the home area network (HAN) using the power of Information and Communication Technologies (ICT). This paper investigates the use of low-power Narrowband Power Line Communication (NPLC) to support home energy management system (HEMS). Compared with low power wireless systems, it will be shown that using low-power Narrowband PLC (NPLC), packet success rate can be improved by approximately 85.32%, 208% and 85.32% in dense, sparse and large networks respectively. These results imply that low power NPLC is a feasible alternative for HEMS where low power wireless network is limited or inadequate.
Keywords—Building energy management system; home energy management system; narrowband PLC; smart home; smart build-ings; LoWPAN.
I. INTRODUCTION
Current power grids are expected to provide contingency plans to mitigate wholesale outages in the events of natural or man-made disruptions. Traditionally, in UK for instance, a capacity margin of 20% was provided even though average capacity utilisation per year was around 55% of installed capac-ity [1]. Hence, low cost plants typically operate at about 85% load factor while plants with high operational costs (installation, fuel, maintenance) operate only when absolutely necessary-a few times per yenecessary-ar. Obviously, shifting consumer lonecessary-ads away from peak periods can result in running less number of plants, lower wear-and-tear and reduced fuel consumption at generating facilities. As ICT continues to pervade buildings, new possibilities such as the notions of smart building, smart home, home networking and connected home are unveiling new realities as different levels of controls and monitoring integrate into the buildings. Traditional stand-alone appliances are also becoming embedded with microprocessor, sensors and communication capabilities; hence, the hope of achieving smart home or smart building is fast becoming reality. A connected home attracts further benefits, for example as electricity meters also become smart; connecting with home appliances, con-sumers can make informed decisions with respect to energy consumption. Such automated interaction between devices in the building can aptly be summarised as Machine-to-Machine (M2M) communication. Since energy management is process-driven, how much efficiency is achieved will depend on the level of monitoring and control achieved over the network. In terms of energy consumption, households account for a significant part of energy consumed. To underscore this, for example in the US, commercial and residential buildings consume 72% of all energy produced [2]. The situation is not different in
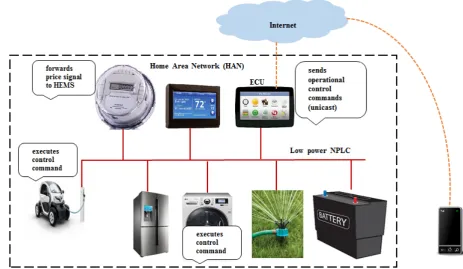
Europe; Eurostat estimated that in 2010, residential buildings accounted for 26.7% of consumption [3]. Clearly, the need for optimal energy use in the home is undisputable. Apart from load shifting at peak periods, energy management system control unit (ECU) can also dynamically control operation of appliances to take advantage of favourable price in energy market. In home energy management system (HEMS), all elec-trical loads including traditionally stand-alone appliances such as dishwashers and heaters connect to ECU to form a network over which consumption data and controls are exchanged. The process of saving energy or cost is sometimes beyond simply turning an appliance “ON” or “OFF”. For example, in washing machine, energy saving could mean increasing or reducing it revolution per minutes (RPM), thereby extending its duty cycle; this depends on whether end or start of the peak period is nearer. Though, energy savings on individual home may be small, if several thousands or millions homes employ similar settings within the same peak period, a significant amount of energy could be saved. The model of HEMS considered in this study is illustrated in Fig.1.
Fig. 1. Home Energy Management System
follows. Motivation and related work are discussed in Section 2 whereas section 3 describes our simulation environment using NPLC. Section 4 presents our simulation results and finally, the key conclusions are highlighted in Section 5.
II. MOTIVATION ANDRELATEDWORK
To effectively balance demand with generation, distributed intelligent systems such as HEMS are needed at the edge of the power distribution networks. The roles of HEMS are to monitor and optimise the operations of electrical loads in the house in manners that are pocket-friendly. With HEMS, it is possible to obtain and visualise energy consumption information on the in-home display unit following which the consumers can control their consumption through direct building control or voluntary curtailment. Domestic controllable devices are broadly classified into reducible, deferrable and partially interruptible loads [4] depending on what proportion of the loads’ operation can be halted or suspended. While deferrable loads such as dishwasher or dryer can be wholly shifted, threshold temperature and duty cycle of home thermostat and washing machine can be modified to accommodate unfavourable price at peak periods, hence they are reducible and partially interruptible loads respectively. Therefore, the goals of energy management programmes are cost saving, efficiency and peak shaving. The idea of interconnecting home appliances with ECU aligns with the fundamental prin-ciple of Machine-to-Machine (M2M) communication, which is that devices add more value when they function as a network of machines than in autonomous operation. Resting on this ideal, a genre of spin-off applications such as remote load monitoring and control are now possible. In the home, a two-way communication system enables home appliances to take advantage of periodic changes in price of electricity to perform their tasks. While older communication technologies appear
over-provisioned, low cost technologies are actively needed to fill the communication gap, keeping the cost of delivery in mind. No single technology can guarantee complete coverage in the home area, this is one of the motivations for developing IEEE 1905.1 standard to support Wi-Fi, Ethernet, coaxial and indoor Broadband PLC. Hence, 1905.1 aggregates specific characteris-tics of individual technologies commonly found in homes into a single hardware interface marketed as 1905.1 adapter. Although 1905.1 provides interoperability among these media, at least Wi-Fi is found in most home but it is not necessarily the preferred option for smart home solutions.
1 2.83
2.83 2.83
5.66 8.49 11.32 14.15 16.98
19.81 22.64 25.47
2.83 5.66 8.49 11.32 14.15
16.98 19.81 22.64
25.47
smart meter ECU
Node 1 Node 11
[image:4.595.39.528.105.200.2]Node 2 Node 3 Node 4 Node 5 Node 6 Node 7 Node 8 Node 9 Node 10 Node 12 Node 13 Node 14 Node 15 Node 16 Node 17 Node 18 Node 19 Node 20
Fig. 2. Logical diagram of baseline network
(SEP) 2.0 to facilitate interaction among elements within the energy ecosystem such as HEMS. The acceptance of LoWPAN is understandable given that interactions between appliances and ECU is predominantly low rate communications. However, blind spots within the home where wireless signal are either absent or too weak can severely affect performance of HEMS. Although 802.15.4 standards prescribes 250kbps maximum data rate at physical layer for LoWPAN, actual throughput at application layer is significantly less. The locations of devices found in the home span different distances depending on their func-tions. Therefore, one major challenge with ZigBee in home is coverage. Considering that appliances are located at different parts of the homes, sometimes separated by concrete walls and other partitions, attenuations such as penetration loss and absorption can further reduce the effective range of the wireless signal even though the 802.15.4 standard specifies a maximum range of 75m (line-of-sight) [10]. The study in [11] shows that coverage range in typical indoor environments can be as low as 10-20m. Since power lines infrastructure already exists, the idea of this work is to leverage it as alternative channel where wireless communication is difficult or unreliable. This quest for inexpensive low power communication technique has motivated us to investigate potential opportunities in NPLC. In this paper, we simulate low power NPLC in a manner similar to ZigBee and compare their performances.
III. SIMULATIONSETUP
This section describes the experimental setup used in this study. Power line is a time-, frequency- and location-variant channel. Accordingly, impedance can be fixed, time-selective and/or frequency-selective. For simplicity, fixed line impedance is employed in this work. IEEE 802.15.4 and 1901.2 define PHY and MAC specifications for LoWPANs and NPLC respectively. The home network implemented here is such that all appliances communicate directly with the ECU. Rather than per-device consumption, the ECU forwards aggregated consumption data to the utility through the smart meter. Therefore, in addition to its metrological functions, the electricity meter serves as gateway to the ECU. The logical connection in the baseline network
is illustrated in Fig. 2. The baseline is a HEMS consisting of 20 appliances in a bungalow, all of which connect to the ECU. The network starts with 2 devices and iteratively scales to 20. Performance is then compared between LoWPAN and low power NPLC.
Mains 50Hz Frequency 1-499 kHz Channel spacing 976.6Hz Number of channels 510 (316 active) OFDM symbol lenght 1228.8us
PHY rate 257.162kbps Modulation BPSK Bits per symbol 1 Transmit power 2.21e-5W
Noise model Impulsive TABLE I
NPLCPARAMETERS
Frequency 2.45GHz Channel access Unslotted CSMA
Modulation O-QPSK Number of channels 26
Noise model AWGN PHY rate 250kbps Bits per symbol 2 Transmit power 2.21e-5W
TABLE II LOWPANPARAMETERS
IV. RESULTS
In this section, the simulation results are presented and analysed. Throughout the experiments, transmissions are con-sidered successful only when 100% of transmitted packets by the appliances are received by the ECU and vice versa. Using the baseline network of 20 electrical appliances as described in section III, we begin by comparing the proposed approach with LoWPAN. Using an acceptable one-way delay bound (5 seconds) for HEMS application, we set UDP application to run for 5seconds and compute the number of consumption information of appliances that are successfully received by the ECU. The result is summarised in Fig. 3.
As can be seen in Fig.3, within the set delay bound, out of 20 nodes on the network, with LoWPAN 18 appliances could upload consumption data while with NPLC, all 20 successfully uploaded their data. The implication of this result is that given similar network and application configurations, NPLC can provide coverage where LoWPAN is limited. It is also necessary to investigate the average latency performance as the network size increases. The result is presented in Fig. 4. In this case, rather than a one-way delay, Return Trip Time (RTT) has been considered as a way to measure time interval between request dispatch from ECU to appliances and receipt of energy consumption information by ECU.
Fig.4 shows the variation of average RTT with number of ap-pliances on the network. The figure shows that NPLC generally provides lower latency. However, with 16 appliances, LoWPAN exhibited lower delay, the trade-off for this performance is seen in further drop in number of successful upload as shown in Fig. 3. Fig. 4 also reveals that as the number of appliances increases from 6, each of the media responds differently to the network changes. While LoWPAN exhibits packet drops resulting in less number of successful uploads (Fig. 3), with NPLC all appliances uploaded their information but with a steady rise in delay. Having seen the network performance in a single-floor building, it is useful to study the performances in different network scenario varying from dense to sparse networks. In view of that, inter-node distances of 2, 20 and 30m are considered
0 2 4 6 8 10 12 14 16 18 20 0
2 4 6 8 10 12 14 16 18 20
No of smart appliances
Successful uploads
[image:5.595.86.241.49.275.2]LoWPAN low power NPLC
Fig. 3. Baseline network coverage
0 2 4 6 8 10 12 14 16 18 20 0
100 200 300 400 500 600 700
No of smart appliances
Average RTT per packet (ms)
[image:5.595.318.549.58.231.2]LoWPAN Low power NPLC
Fig. 4. Average RTT in baseline network
to represent dense, moderate and sparse networks respectively. The result is shown in Fig. 5.
It can be seen in Fig. 5 that while NPLC supports all devices as the network configuration changes from dense to sparse, consistently yielding efficiency of 100% in terms of uploads, with LoWPAN, the number of successful uploads by appliances declines as the network changes from dense to sparse. The consequence of this behaviour is that NPLC support all configuration with trade-off in higher latency and LoWPAN is more amenable to dense network with significant drop in performance as the inter-node distance increases.
Fig. 6 illustrates variation of packet error probability (PEP) with number of appliances. The packet error probability is computed as ratio of lost packet to total transmit packet. Fig.6 reflects two extremes of dense and sparse networks. Here, a dense network is regarded as one with distance of 2m between neighbours while a sparse network is that with 50m between neighbours. Fig.6 shows that compared with dense networks, data packets in sparse network are more prone to error, corrup-tion or outright loss. Although, the trend is subtler in NPLC, in both techniques, appliances at the farthest ends of the network exhibit the highest likelihood of error or loss.
[image:5.595.316.548.268.441.2]0 2 4 6 8 10 12 14 16 18 20 0
2 4 6 8 10 12 14 16 18 20
No of smart appliances
No of uploads
[image:6.595.316.549.57.230.2]LoWPAN:2m low power NPLC:2m LoWPAN:20m low power NPLC:20m LoWPAN:30m low power NPLC:30m
Fig. 5. Network coverage with different inter-node distances
0 2 4 6 8 10 12 14 16 18 20 0
0.1 0.2 0.3 0.4 0.5 0.6 0.7
No of smart appliances
Packet Error Probability
[image:6.595.49.280.58.231.2]LoWPAN:2m low power NPLC:2m LoWPAN:50m low power NPLC:50m
Fig. 6. Packet error probability in dense and sparse networks
LoWPAN and low power NPLC occurred at 20 devices with PEPs of 0.489 for LoWPAN and 0.053 for low power NPLC. These translate to success probabilities of 0.511 and 0.947 for LoWPAN and low power NPLC respectively. This represents an improvement of 85.32% in probability of packet delivery compared with LoWPAN. Similarly, in the sparse network, the widest performance gap occurred at 16 appliances with PEPs of 0.675 and 0 for LoWPAN and low power NPLC respectively. Therefore, it can be inferred that with 16 appliances, the prob-ability that a packet will be successfully delivered in LoWPAN and low power NPLC are 0.325 and 1 respectively, translating to an improvement of 0.675 in probability of delivery. The signifi-cance of this result in real network is that if all other parameters are unchanged, low power NPLC can potentially improve in-home coverage provided by LoWPAN by approximately 208%. Finally, we simulate HEMS in a storey building with 20 nodes on each floor. As with the bungalow network in Fig.2, inter-node distance of 2m is maintained on each floor. The performance of the new network is illustrated in Fig. 7.
Fig. 7 shows variation of PEP with number of appliance in a storey building. The HEMS is such that all devices on the network connect with the ECU on the ground floor. From the results, LoWPAN consistently exhibited higher probability of
0 5 10 15 20 25 30 35 40 0
0.1 0.2 0.3 0.4 0.5 0.6 0.7
No of smart appliances
Packet Error Probability
LoWPAN low power NPLC
Fig. 7. Packet error probability in storey building
error. The significance of this result is that given the same network conditions in a storey building with 40 appliances, consumption data from the appliances are less likely to be delivered successfully over LoWPAN than low power NPLC. Fig.7 also indicates that the widest performance gap between the two technologies occurred at 20 appliances with PEP of 0.489 and 0.053 for LoWPAN and low power NPLC respectively. These imply 0.511 and 0.947 as chances of successful packet delivery over LoWPAN and low power NPLC. With this, NPLC exhibits an improvement in chance of packet delivery by 0.436 over LoWPAN. It therefore implies that given a large network of 40 appliances in a storey building, using low power NPLC can potentially improve network coverage by 85.32% above LoWPAN.
V. CONCLUSIONS
No single communication technology can guarantee adequate coverage everywhere within the home. While the search for low power communication continues, there are opportunities in HEMS but cost of delivery is a key concern. Taking advantage of power lines that already exist in homes, we have shown in this paper that regardless of the network configuration, low power NPLC can significantly improve HEMS performance where LoWPAN is limited or impossible to achieve. Although the proposed technique exhibited a performance trade-off in form of higher delay, the latencies observed in this study are within acceptable limit. We showed that using low-power Narrowband PLC (NPLC), packet success rate can be improved by approximately 85.32%, 208% and 85.32% in dense, sparse and large networks respectively. Another major observation is that network performance does not depend on size of the house alone, network configuration is also a major determinant. It therefore means that given the size of an apartment, position of the electrical loads should be considered in determining the communication system to be deployed for HEMS.
ACKNOWLEDGMENT
[image:6.595.49.277.267.440.2]Energy Management” project (Innovate UK Project 101836). The authors would also like to thank Manchester Metropolitan University for the internal support received.
REFERENCES
[1] G. Strbac, “Demand side management: Benefits and chal-lenges,” Energy policy, vol. 36, no. 12, pp. 4419–4426, 2008.
[2] D. Holmberg, “Building integration with smart grid.” nist, December 2012. [Online]. Available: http://www.nist. gov/el/smartgrid/bisgrid.cfm(accessedon21April2015) [3] S. D’Alessandro, A. M. Tonello, A. Monacchi, and W.
El-menreich, “Home energy management systems: Design guidelines for the communication infrastructure,” inProc. IEEE International Energy Conference (ENERGYCON), May 2014, Cavtat, Croatia. IEEE, 2014, pp. 805–812. [4] R. H. Khan and J. Y. Khan, “A comprehensive review of
the application characteristics and traffic requirements of a smart grid communications network,”Computer Networks, vol. 57, no. 3, pp. 825–845, 2013.
[5] H. S. Kim, J.-H. Song, and S. Lee, “Energy-efficient traffic scheduling in IEEE 802.15. 4 for home automation networks,”IEEE Trans. Consum. Electron., vol. 53, no. 2, pp. 369–374, 2007.
[6] J. Han, C.-S. Choi, and I. Lee, “More efficient home energy management system based on zigbee communication and infrared remote controls,”IEEE Trans. Consum. Electron., vol. 57, no. 1, pp. 85–89, 2011.
[7] D.-M. Han and J.-H. Lim, “Design and implementation of smart home energy management systems based on zigbee,”
IEEE Trans. Consum. Electron., vol. 56, no. 3, pp. 1417– 1425, 2010.
[8] J. Han, C.-S. Choi, W.-K. Park, I. Lee, and S.-H. Kim, “Smart home energy management system including re-newable energy based on zigbee and plc,” IEEE Trans. Consum. Electron., vol. 60, no. 2, pp. 198–202, 2014. [9] Y. S. Son, T. Pulkkinen, K. D. Moon, and C. Kim,
“Home energy management system based on power line communication,”IEEE Trans. Consum. Electron., vol. 56, no. 3, pp. 1380–1386, 2010.
[10] A. Kailas, V. Cecchi, and A. Mukherjee, “A survey of communications and networking technologies for energy management in buildings and home automation,” Journal of Computer Networks and Communications, vol. 2012, 2012.
[11] M. Starsinic, “System architecture challenges in the home M2M network,” inProc. Long Island Systems Applications and Technology Conference (LISAT), Farmingdale, New York, May 2010. IEEE, 2010, pp. 1–7.