School Games Mark Validation : Final Report : Year 3
(2013-14)
HART, Gemma, SHIBLI, Simon <http://orcid.org/0000-0002-4420-115X>, BULLOUGH, Steven <http://orcid.org/0000-0001-8836-5853> and BARRETT, David <http://orcid.org/0000-0001-8132-6819>
Available from Sheffield Hallam University Research Archive (SHURA) at:
http://shura.shu.ac.uk/10325/
This document is the author deposited version. You are advised to consult the publisher's version if you wish to cite from it.
Published version
HART, Gemma, SHIBLI, Simon, BULLOUGH, Steven and BARRETT, David (2015). School Games Mark Validation : Final Report : Year 3 (2013-14). Project Report. Sheffield Hallam University.
Copyright and re-use policy
See http://shura.shu.ac.uk/information.html
Sheffield Hallam University Research Archive
____________________________________________________________
School Games
Mark Validation - Final Report - Year 3 (2013-14)
January 2015
____________________________________________________________
Submitted to:
Natasha O'Flaherty Sport England
Submitted by:
Sport Industry Research Centre Sheffield Hallam University A118 Collegiate Hall Collegiate Crescent Sheffield
S10 2BP
Contents
EXECUTIVE SUMMARY ... ii
1 INTRODUCTION ... 1
2 THE SELECTION OF SCHOOLS FOR INDEPENDENT VALIDATION ... 2
2.1 The Validation Process ... 3
3 THE COHORT OF MARK SCHOOLS ... 4
3.1 Headlines ... 4
3.2 The validation process in greater detail ... 5
3.3 Outcomes of the independent validation process... 6
3.4 2013-14 school year compared with 2012-13 ... 8
3.5 Concluding comments ... 9
4 KEY ISSUES ... 10
4.1 SGO Engagement with Mark... 10
4.2 Causes of failure ... 16
4.3 Potential for Progression ... 19
4.4 Driving Volume ... 21
4.4.1 SGO Work plans ... 21
4.4.2 Changes to Mark Criteria ... 24
4.5 Level 1 and Level 2 Sports ... 25
5 RECOMMENDATIONS & CONCLUSION ... 30
5.1 SGO and School Engagement... 30
5.2 Causes of Failure ... 30
5.3 Progression of Schools ... 31
5.4 Driving Volume ... 31
5.6 Level 1 and 2 Sports ... 31
5.7 Conclusion ... 31
APPENDICES ... 33
Appendix 1: The list of 302 schools validated ... 33
Appendix 2: The validation pro-forma ... 41
Appendix 3: Colour coded rating of schools against criteria ... 46
Appendix 4: Reasons for 'failure' at higher levels of award ... 50
EXECUTIVE SUMMARY
The Mark award scheme entered its third year of commission in 2013-14. The scheme is administered by the Youth Sport Trust and provides schools with the opportunity to assess themselves against a set of criteria to achieve a Bronze, Silver or Gold award which recognises their commitment to the provision of school sport and school sport competition.
Applications
There are 23,063 schools and colleges in England which are eligible to apply for a Mark award (as long as they have activated School Games accounts), of which 67% (15,433) are primary schools, 16% (3,680) are secondary schools and 17% (3,950) are in other categories. Registration with the School Games website stood at 18,450 at the end of the 2013-14 Mark application window, an increase of 20% (3,132) more activated accounts than at the end of the 2012-13 application window. All activated schools have the opportunity to apply for a School Games Mark award and in the 2013-14 school year 5,906 (32%) took advantage of this opportunity. On initial application for a Mark award through the School Games website, 96% (5,683) of applications were successful and 4% (223) were unsuccessful. The independent validation programme saw the validation of 302 schools across 151 SGO areas, 97% (292) of these schools were able to provide satisfactory evidence to support their awards and 3% were unable to do so and consequently failed. Furthermore, within the sample of 302 schools, it was necessary to upgrade 110 awards.
SGO and School Engagement
Of the 452 SGOs in England, 443 (98%) submitted at least one successful Mark application and the remaining 9 (2%) submitted no applications at all. This was a significant improvement on 2012-13 in which 84% (379) of SGOs made at least one application and 16% (72) did not.
Key Points
SGO engagement with Mark has improved in 2013-14 relative to 2012-13 with 98% (443) of SGOs now making at least one Mark award application.
Some SGOs are more productive in Mark applications than others, the bottom 25% generate 8% (472) of all applications whereas the top 25% generate 48% (2,835) of applications.
There are significant differences between LOC areas in terms of schools activated, applications made and success rate.
With all but 2% of SGO regions now generating at least one successful application, future growth is likely to be driven by persuading less productive SGOs to submit multiple applications.
The LOC with the largest number of schools in the system, London, illustrates the issue of varying engagement within LOCs.
Causes of failure
Key Points
The number of schools failing almost halved in 2013-14 (223 compared with 429 in 2012-13). This is also a significant decrease in terms of overall percentage failure rate (3% in 2013-14 v 16% in 2012-13) given the increased number of applications.
85% of schools that failed were first time applicants; therefore some additional work with their SGOs may prove useful to help them become more familiar with the application process.
Similar to last year, the majority of schools that failed to meet at least the Bronze level were unsuccessful due to their answer in one area only (60% cf. 76% in 2012-13), rather than systematic failure across a wider range of criteria.
The most common reasons for failure were insufficient provision of sports at Level 2 (50%) which is a slight change from last year where Level 1 sports were more likely to be a cause of failure. Level 1 provision along with having at least 5% of pupils involved in leading, managing and officiating sport, were criteria not met by around two-fifths of failed applications.
Potential for progression
Key Points
Schools progressing up to a higher level of award is similar to 2012-13, i.e. that there continues to be strong potential for schools engaged with the School Games Mark award to make progression in the future, although the caveat remains that some criteria are more straightforward to develop/deliver than others.
Prominent issues for Silver schools included three areas where the SGO involvement, particularly around understanding what is included, could have a positive impact (club links, promotion of School Games and helping to develop School Sport Organising Committee / Crews). The criteria causing the most issues (in terms of progression) in 2012-13 are similar in 2013-14, although there has been an increase in the proportion of validated schools offering the requisite number of B and C teams (58% v 48%).
A point made in the 2012-13 report stated that "different types of schools will face different challenges in order to progress" and this remains the same, as the size of school and type of school makes certain areas of the Mark criteria more difficult than others. For example, the percentage questions in larger schools can be more difficult than in smaller schools where each child accounts for a larger percentage point.
As with 2012-13, the majority of the 110 upgrades made to the sample of 302 independently validated schools could be explained by errors on the application form against one or two criteria, rather than wholesale misinterpretation of the application form.
Level 1 and 2 Sports
Key Points
Schools making successful Mark award applications play an average of ten sports at Level 1 and eight at Level 2. Of the eight sports provided at Level 2, schools enter an average of three B teams and one C team. These totals are higher for Silver and Gold schools.
The most frequently included sports at Levels 1 are Athletics, Football, Netball, Cricket and Rounders. At Level 2, the most popular sports among Schools applying for a Mark award are Football, Athletics, Netball, Cricket and Cross-Country.
Analysis by sport reveals considerable gaps in the provision of competitive opportunities at Level 2, compared with participation at Level 1. While Level 2 participation in Football and Athletics matches Level 1 very closely, in half of the sports provided by School Games, the number of schools entering Level 2 competitions is less than 75% of those offering provision at Level 1. Of these, Level 2 provision in ten sports is less than half that at Level 1. This highlights a lack of competitive infrastructure in some sports, which may be of concern to the relevant NGBs.
Schools do not only provide a wide range of sports, but also do so in considerable depth. Football and Netball are the most frequently provided sports at B and C team level, but there are disparities in the extent to which other sports appear to encourage multi-team entries. Athletics is one of the most popular sports in the School Games, but only 36% of schools competing at Level 2 enter more than one team. In Swimming, this proportion is even lower, at 21%.
The variance in the breadth and depth of provision of sports at Level 1 and Level 2 highlights the challenge for SGOs and NGBs alike in encouraging engagement in inter-school competition. Participation at Level 1 does not necessarily translate to Level 2, as demonstrated by the example of Rounders. In developing solutions to try to close these gaps however, providers of school sport could help to drive increases in participation across the board, particularly if schools have strong links to voluntary sports clubs. This may have particular significance for non-traditional sports such as Handball, which have made recent inroads into schools.
Sport Industry Research Centre
January 2015
1
1
INTRODUCTION
The Mark award scheme entered its third year of commission in 2013-14. The scheme is administered by the Youth Sport Trust and provides schools with the opportunity to assess themselves against a set of criteria to achieve a Bronze, Silver or Gold award which recognises their commitment to the provision of school sport and school sport competition. Schools are able to apply for the award annually. This report focuses on the independent validation of the Mark award scheme which was conducted by the Sport Industry Research Centre (SIRC) at Sheffield Hallam University between June and December 2014.
The validation programme for 2013-14 was the second full year of the independent validation (although a retrospective pilot validation which covered 100 schools took place in 2011-12). Schools selected for validation in 2013-14 did not have their award confirmed until their validation visit had taken place and the evidence to support their applications had been reviewed. The application window for schools to apply for a Mark award for 2013-14 period was open for almost four months (from Wednesday 4th June 2014 to Friday 3rd October 2014). During this period 5,906 schools (32% of those with activated accounts on the School Games website as of 3rd October 2014) applied for a Mark award, of which 96% (5,683) were successful in their online applications. This is an increase of 114% (3,144) in applications compared with the 2012-13 academic year. The independent validation programme for the 2013-14 academic year commenced in June 2014 and was completed by mid-December 2014. During this time 302 schools were validated across 151 SGO areas.
The purpose of the validation programme for 2013-14 was to:
1. bring further weight and value to the award scheme via a formal validation process; 2. ensure schools achieve the award levels they deserve;
3. ensure consistency of awards across SGO regions; and
4. allow feedback to be gathered on the criteria, providing the opportunity for further amendments and refinement to the scheme and criteria for subsequent years.
2
2
THE SELECTION OF SCHOOLS FOR INDEPENDENT VALIDATION
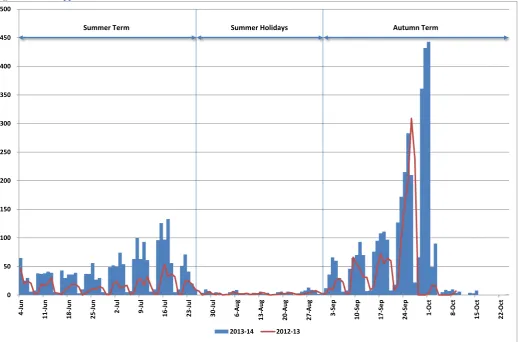
[image:8.595.41.560.145.487.2]The validation included 302 schools drawn from 151 SGO areas. Schools were selected for validation throughout the application window. Figure 1 below shows the spread of Mark applications made throughout the application window.
Figure 1 - Mark applications over time
The graph highlights that the pattern of applications in 2013-14 mirrored that of the previous year, although volumes were more than twice as high. There were 2,129 applications between the window opening in June and the end of the summer term (25th July). There were a further 161 applications between the last week of July and the end of August with the remaining 3,617 applications (61%) being submitted between the 1st September and the close of the application window. Towards the end of this latter period, there was a considerable rush of applications, with the result that 2,496 (42%) of the final total of 5,906 were submitted in the last two weeks. It is worth noting however, that the deadline for applications was a week later than in 2012-13, and this resulted in 1,463 being added (a quarter of the total).
From a SIRC perspective, the end result of the late surge in applications was to delay the selection of schools for validation. It was not possible to complete the selection of all 302 schools until the application window closed at the beginning of October 2014. From a purely operational point of view however, the higher volume of applications overall, and the apparent bias in favour of later applications have implications for the management of the validation process. In the majority of cases there is a significant time gap between submission and the end of the relevant school year. This increases the risk of evidence being mislaid or discarded, with the result that validation itself may be impaired.
0 50 100 150 200 250 300 350 400 450 500 4 -J u n 1 1 -J u n 1 8 -J u n 2 5 -J u n 2 -J u l 9 -J u l 1 6 -J u l 2 3 -J u l 3 0 -J u l 6 -A u g 1 3 -A u g 2 0 -A u g 2 7 -A u g 3 -S e p 1 0 -S e p 1 7 -S e p 2 4 -S e p 1 -O ct 8 -O ct 1 5 -O ct 2 2 -O ct 2013-14 2012-13
3 (Note: there were a handful of applications submitted after the close of the application window due to SGOs appealing the outcome of some applications and as a result of some applications being reset). Just under a third (94 schools) of the entire validation sample was selected for validation between 21st September and the close of the application window.
Once schools and SGOs had been selected for validation, they were notified via an automated email from the application system and SIRC staff then began the process of contacting individual SGOs to arrange and schedule validation meetings with their schools. In total 43 Schools (22 SGO areas) received validation visits prior to the end of the 2013-14 academic year, the remaining 259 schools (130 SGO areas) received their validation visits between September and mid-December 2014. All validations were complete within eleven weeks of the Mark application window for the 2013-14 period closing.
2.1 The Validation Process
The validation process was a systematic and objective process carried out by 11 SIRC staff as outlined in the bullet points below.
SIRC staff worked to agreed protocols following standardised in-house training. (A sample proforma used by SIRC validators is provided in Appendix 2).
Schools were asked to provide evidence to support their application across the different areas of the criteria.
Support documents relating to the validation were available to schools and SGOs on the School Games website. In practice, there was some flexibility in terms of the types of evidence accepted after taking into account local circumstances. Where necessary, approval to use discretion was sought by validators from the project's more senior staff.
Awards were confirmed if sufficient evidence was seen by validators.
4
3
THE COHORT OF MARK SCHOOLS
3.1 Headlines
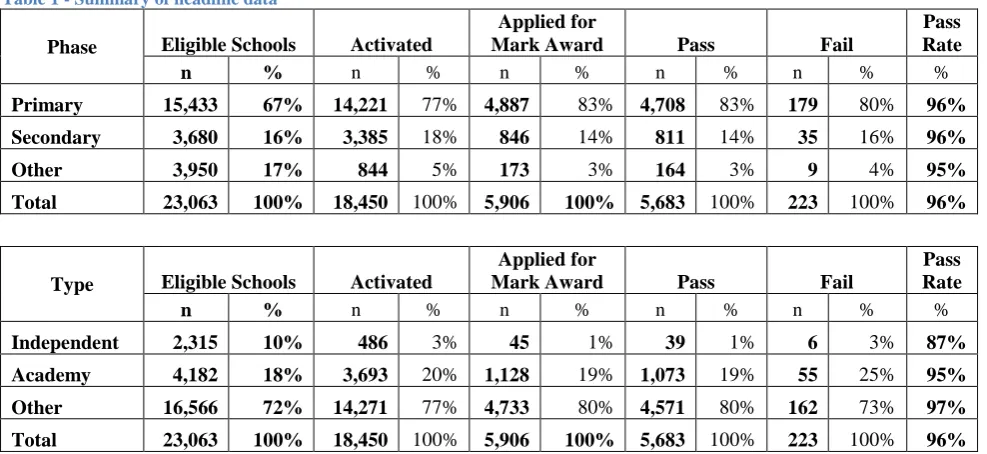
This section is concerned with providing the technical detail on the overall population of schools applying for a Mark award along with the results of the independent validation process. In Table 1 we present the headline data summarising the numbers and proportions of:
Schools in England eligible to apply for a Mark award;
Schools activated on the School Games website (as of 3rd October 2014);
Schools which applied for a Mark award;
Schools which were successful with their applications; and
[image:10.595.35.529.263.490.2] Schools which failed their applications.
Table 1 - Summary of headline data
Phase Eligible Schools Activated
Applied for
Mark Award Pass Fail
Pass Rate
n % n % n % n % n % %
Primary 15,433 67% 14,221 77% 4,887 83% 4,708 83% 179 80% 96%
Secondary 3,680 16% 3,385 18% 846 14% 811 14% 35 16% 96%
Other 3,950 17% 844 5% 173 3% 164 3% 9 4% 95%
Total 23,063 100% 18,450 100% 5,906 100% 5,683 100% 223 100% 96%
Type Eligible Schools Activated
Applied for
Mark Award Pass Fail
Pass Rate
n % n % n % n % n % %
Independent 2,315 10% 486 3% 45 1% 39 1% 6 3% 87%
Academy 4,182 18% 3,693 20% 1,128 19% 1,073 19% 55 25% 95%
Other 16,566 72% 14,271 77% 4,733 80% 4,571 80% 162 73% 97%
Total 23,063 100% 18,450 100% 5,906 100% 5,683 100% 223 100% 96%
There are 23,063 schools and colleges in England which are eligible to apply for a Mark award, of which 67% are primary schools (including middle deemed primary); 16% are secondary schools (including middle deemed secondary) and 17% are in other categories. These form the 'population' against which our 'sample' of those registered with the School Games website and those who applied for Mark awards can be compared.
The second half of the table makes clear that engagement in School Games is lower at Academies and Independent schools. Independent schools in particular are under-represented in terms of activations, accounting for only 3% of all schools registered on the School Games website. Fewer still have applied for School Games Mark (1% of all schools), and the pass rate of 87% is nearly ten percentage points lower than the overall average.
Registration with the School Games website was 18,450 at the end of the 2013-14 Mark application window, which equates to 20% (3,132) more activated accounts than at the end of the 2012-13 application window. This in turn can be seen as an indication of the increasing relevance of School Games generally and the Mark scheme specifically to schools in England.
5
Key Points:
On initial application for a Mark award through the School Games website, 96% (5,683) of applications were successful and 4% (223) were unsuccessful. This pass rate statistic compares favourably with the 2012-13 school year in which 84% (2,333) of applications were successful and 16% (411) were unsuccessful. Later in the report we look in closer detail at the reasons why 4% of schools which applied in 2013-14 failed their Mark award application.
3.2 The validation process in greater detail
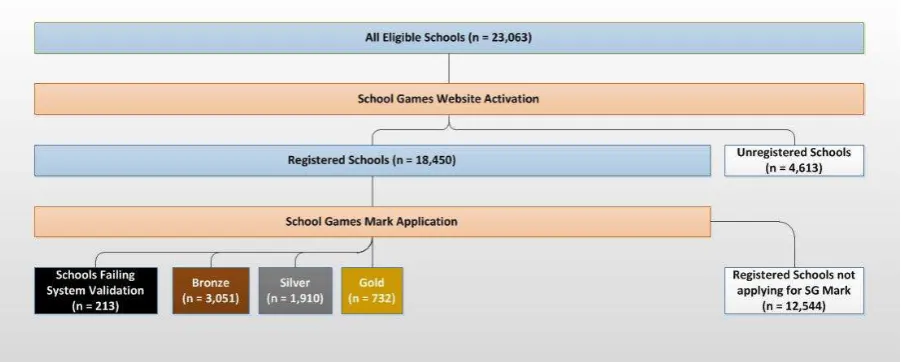
[image:11.595.42.493.290.471.2]The flow diagram in Figure 2 illustrates the initial stages of applying for a Mark award in the 2013-14 school year. The system-based validation procedure evaluated the 5,906 applications and found that 5,693 (96%) met the criteria for an award and that 213 schools (4%) were deficient in at least one criterion such that an award could not be made.
Figure 2 - Schools Registered for School Games and Applying for School Games Mark
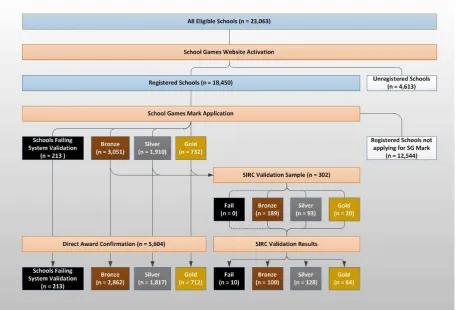
From the total of 5,693 applications that achieved a successful system validation, a sample of 302 of these applications across 151 SGO areas was selected for an independent evaluation by SIRC as shown in Figure 3. The 4% of schools (213 in total) which failed in this initial phase were not eligible for validation by the research team. For those schools that passed the online validation process, the distribution of awards by type was:
Bronze 3,051 (53%);
Silver 1,910 (34%); and
6 Figure 3 - The Process of Application and Validation
3.3 Outcomes of the independent validation process
[image:12.595.37.497.69.379.2]The primary purpose of the independent validation process was to assess the extent to which the awards made by the online system stood up to a more thorough inspection of the answers given and the underpinning evidence. A secondary purpose was to establish the extent to which successful applications achieved the most appropriate level of award for the evidence provided. A summary of the initial sample selection, the changes made and the final sample is shown in Table 2.
Table 2 - Validation Sample
Fail Bronze Silver Gold Total
Initial Sample Selected 0 189 93 20 302
Failed 10 -9 -1 0 0
Upgraded Bronze to Silver 0 -66 66 0 0
Upgraded Bronze to Gold 0 -15 0 15 0
Upgraded Silver to Gold 0 0 -29 29 0
Downgraded Gold to Silver 0 0 0 0 0
Downgraded Silver to Bronze 0 1 -1 0 0
Summary of Changes 10 -89 35 44 0
Final Validated Sample 10 100 128 64 302
7 assume that the sample was representative of the population of schools which passed the online validation (5,693), it is likely that if all such schools had been independently validated then 170 (3%) would have failed. Taken alongside the initial failure rate of 4%, the overall failure rate would have been 7%, or fewer than one in fourteen schools. The headline finding is that in terms of 'pass' or 'fail' the independent validation found the online system to be 97% accurate.
In addition to assessing whether or not a school passed or failed its Mark award application, we also assessed the extent to which awards made were appropriate for the evidence provided. The findings from this programme were encouraging:
Within the sample of 302 schools it was necessary to upgrade 110 awards.
At Bronze level 66 out of an initial sample of 188 (35%) were upgraded to Silver level;
At Silver level 29 out of 93 schools (31%) were upgraded to Gold level.
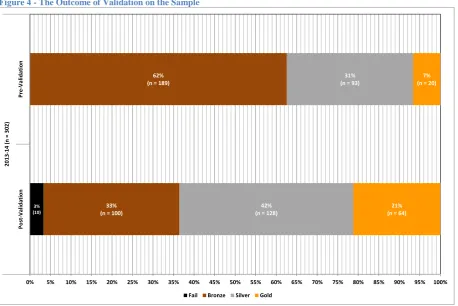
[image:13.595.37.496.349.655.2]Again if we assume that the sample of schools selected for independent validation is representative of the population, then the nature of the awards achieved would change considerably with more schools achieving Silver and Gold awards and fewer achieving Bronze awards. This point indicates that in the 2013-14 school year, a significant minority of schools (around one third) appear to have underestimated their level of engagement with School Games as illustrated in Figure 4.
Figure 4 - The Outcome of Validation on the Sample
Figure 4 shows the change in the composition of the sample of 302 schools after validation. An additional 3% of schools did not meet the criteria for any award and there was a considerable shift upwards from Bronze to Silver and from Silver to Gold. Many validated schools performed better than they initially received credit for. It appears therefore, that those schools which apply for a Mark award tend to sell themselves short in terms of the extent and intensity of their engagement. The fact remains however, that the majority of eligible schools have not applied for an award, and we will return to this theme later in the report.
3% (10)
33% (n = 100)
62% (n = 189)
42% (n = 128)
31% (n = 93)
21% (n = 64)
7% (n = 20)
0% 5% 10% 15% 20% 25% 30% 35% 40% 45% 50% 55% 60% 65% 70% 75% 80% 85% 90% 95% 100%
P
o
st
-V
a
li
d
a
ti
o
n
P
re
-V
a
li
d
a
ti
o
n
2
0
1
3
-1
4
(
n
=
3
0
2
)
8
3.4 2013-14 school year compared with 2012-13
[image:14.595.38.498.201.506.2]To put the 2013-14 data into perspective we now move on to examine the Mark award outcomes for schools that applied for a Mark award in both 2012-13 and 2013-14 with those who were first time applicants in 2013-14. The number of schools which applied in both years was 2,114 (36%) and the number of first time applicants was 3,792 (64%). In 2012-13 the number of schools applying for a Mark award was 2,762 and thus the proportion that reapplied in 2013-14 can be confirmed as 77% - a large majority. Figure 5 shows how those schools which applied in 2012-13 fared this year in comparison with their previous award level and how those schools which applied for the first time in 2013-14 performed.
Figure 5 - Comparison between 2012-13 and 2013-14 Cohorts
For those schools which were new applicants (i.e. did not apply in 2012-13), the overall picture is one of considerable success, with 95% (3,603) of schools achieving a Mark award. Better still, over a third of these new entrants achieved a Silver or Gold award, indicating that it is possible to 'hit the ground running'. The second column on the graph relates to schools which failed in 2012-13, and here it is interesting to note that of the 429 schools which were not successful in the previous year, 296 (69%) re-applied and 95% (282) of these were successful in achieving an award of some sort.
Just under a third of this year's applicants (1,818 schools as shown in columns 3, 4 and 5) had also made successful applications last year, and it is relevant to examine how these schools have fared in 2013-14. More than half (956) of the returning schools achieved a Bronze in 2012-13, and the majority of these (58% or 555) have progressed to at least a Silver award in 2013-14. Of the 639 schools from this group which were awarded a Silver in 2012-13, a third progressed to Gold. The highest achieving schools were generally able to at least maintain their level of award, with 194 out 223 (87%) being awarded Gold again.
At a headline level these findings highlight two key points:
189 14
17 3 223
2,313
160
384
101
4
2,962 1,032
108
457
323
25
1,945
258 14
98
212
194
776
0% 10% 20% 30% 40% 50% 60% 70% 80% 90% 100%
Did not apply 2012-13 Failed 2012-13 Bronze 2012-13 Silver 2012-13 Gold 2012-13 Grand Total
9
first, that a successful application is within reach, even if a school is new to the system or has failed in previous years; and
second, that schools which have been successful in applying for a Mark award in previous years are likely to at least maintain their status, and more often than not progress to a higher level of award.
3.5 Concluding comments
Independent validation has benefitted both schools and SGOs in the sense that around a third of schools were awarded a higher grade in the final analysis of evidence, while SGOs are increasingly knowledgeable about the process. This has encouraging implications for this year's application window. We would also note however, that up to 170 additional schools would have failed the application process if subjected to the additional rigour of an in-person validation. However, in the context of seeking further development and improvement of the Mark award process, we have identified a series of key issues for further analysis and discussion. These are:
SGO engagement with Mark;
Causes of failure;
Potential for progression; and
Driving volume.
10
4
KEY ISSUES
4.1 SGO Engagement with Mark
SGO engagement with Mark is not uniform, and Figure 6 illustrates the extent to which a relatively small percentage of SGOs generate a disproportionately high number of award applications. Of the 452 SGO regions in England, 443 (98%) submitted at least one successful Mark application and the remaining 9 (2%) made no applications at all. This is a noticeable improvement on the 2012-13 school year in which 84% (379) of SGOs made at least one application and 16% (72) did not. The finding that 98% of SGOs engaged with Mark in 2013-14 is further evidence of the positive impact of building the process into SGOs' annual work plans.
To illustrate the point that there are varying levels of engagement with the Mark award we have divided the distribution of 443 applicants into quartiles. Our analysis shows that:
Of those SGO regions which were engaged with Mark, the top quartile (i.e. the most productive 25%) generated 2,742 applications (48% of the total).
The least productive 25% of SGOs were responsible for 441 (or 8%) of all 5,906 Mark award applications.
[image:16.595.38.493.443.736.2]While this demonstrates that there is a degree of 'polarisation' in terms of engagement among SGOs, the graph also shows that there has been a positive shift in the balance of applications with the top quartile no longer accounting for more than half (58%) of applications and the two bottom quartiles now making 26% of applications compared with 15% last year. This does not quite tell the full story however, as there are varying levels of engagement across the country.
Figure 6 - Mark applications by SGO Regions, Grouped by Count per Region
To identify where the variances in Mark applications are occurring we have conducted further analysis on the data available at County Sports Partnership / LOC level as shown overleaf in Table 3.
8%
18%
26%
48%
4%
11%
26%
58%
0% 10% 20% 30% 40% 50% 60% 70%
1st Quartile 2nd Quartile 3rd Quartile 4th Quartile
11 Table 3 - Mark applications by LOC
LOC Eligible Registered Applications Success
n n % n % n %
Beds. 295 258 87% 169 66% 167 99%
Tees Valley 288 265 92% 127 48% 124 98%
Northumberland 185 158 85% 73 46% 69 95%
Durham 266 264 99% 121 46% 117 97%
Cornwall 286 247 86% 111 45% 110 99%
Surrey 425 333 78% 145 44% 140 97%
Humber 398 358 90% 153 43% 148 97%
Derbys. 463 442 95% 184 42% 178 97%
Essex 660 598 91% 248 41% 238 96%
Oxon. 351 290 83% 118 41% 112 95%
Sussex 631 486 77% 197 41% 194 98%
North Yorks. 464 395 85% 158 40% 154 97%
Devon 546 389 71% 150 39% 148 99%
Cheshire & Warrington 458 352 77% 135 38% 131 96%
Herts. 542 395 73% 151 38% 143 95%
Shropshire 255 210 82% 80 38% 80 100%
Staffs. 521 422 81% 154 36% 147 95%
Greater Manchester 1,207 952 79% 335 35% 325 97%
Kent 754 565 75% 196 35% 191 97%
Merseyside 612 528 86% 178 34% 174 98%
Tyne & Wear 438 317 72% 102 32% 100 98%
Worcs. 268 217 81% 67 31% 65 97%
Somerset 294 230 78% 69 30% 68 99%
Suffolk 366 294 80% 87 30% 84 97%
Lancs. 792 661 83% 193 29% 185 96%
Northants. 337 271 80% 79 29% 73 92%
Bucks. & Milton Keynes 320 275 86% 80 29% 78 98%
London 2,941 2,046 70% 590 29% 557 94%
South Yorks. 503 426 85% 121 28% 112 93%
Lincs. 374 290 78% 80 28% 78 98%
West of England 429 300 70% 82 27% 79 96%
Hants. 678 617 91% 166 27% 159 96%
Cambs. & Peterborough 352 308 88% 81 26% 78 96%
Dorset 282 212 75% 53 25% 51 96%
Herefordshire 113 86 76% 21 24% 21 100%
Leics. & Rutland 460 362 79% 88 24% 84 95%
West Yorks. 944 773 82% 186 24% 175 94%
Notts. 445 369 83% 85 23% 79 93%
Cumbria 317 266 84% 61 23% 60 98%
Wilts. 342 261 76% 58 22% 55 95%
Glos. 319 248 78% 55 22% 53 96%
Birmingham 450 345 77% 73 21% 70 96%
Black Country 447 373 83% 77 21% 74 96%
Norfolk 407 376 92% 74 20% 71 96%
Coventry, Solihull & Warks. 452 368 81% 57 15% 50 88%
Berks. 386 252 65% 38 15% 34 89%
Total 23,063 18,450 80% 5,906 32% 5,683 96%
12 Table 4 - Change in Rank
LOC Eligible
Schools
School Registrations
All Mark Applications
Successful Applications
SGO Engagement (10+ Appns)
n % r n % r n % r n % r
Somerset -9 32 13% -6 60 25% +22 63 43% +40 2 50% +12
Cornwall -2 97 34% +34 67 16% -3 76 22% +36 3 75% +15
Herefordshire -1 48 43% +8 16 11% -4 17 20% +32 2 100% +40
Cumbria -2 81 26% +27 43 13% 0 46 20% +29 2 33% +3
Derbyshire -5 110 24% +11 143 30% +26 148 24% +26 7 70% +26
Surrey 10 64 13% -5 76 18% +1 94 30% +24 3 50% +2
Lincolnshire 5 62 16% +2 24 3% 22 34 19% +24 2 25% -13
North Yorkshire -5 109 24% +23 113 24% +14 118 17% +19 5 50% +12
Devon 5 71 12% -2 75 15% -2 85 15% +18 3 38% -7
Cambs. & Peterborough 5 22 6% -5 43 13% -2 50 22% +16 3 60% +12
Black Country 4 78 16% +1 44 10% -7 49 20% +13 2 18% -3
Humber 2 44 11% 0 68 16% -1 78 15% +10 3 43% -4
Worcestershire -5 41 17% +6 17 3% -19 23 13% +7 2 33% -11
West of England 5 80 18% 0 49 12% -3 52 14% +5 2 25% -7
Kent -2 95 13% -5 64 7% -16 79 12% +5 7 43% +2
Merseyside -3 58 10% -3 60 9% -12 71 11% +4 6 43% -4
Oxfordshire 6 14 3% 15 70 24% +13 75 18% +3 2 40% -4
Essex -3 100 16% +4 167 25% +17 172 15% +3 9 64% +13
Greater Manchester -1 153 13% -4 164 14% -1 178 11% +1 9 43% -4
Bedfordshire -1 9 3% -7 26 9% 0 36 7% +1 0 0% -11
Bucks. & Milton Keynes -2 48 16% +4 39 11% -8 42 10% 0 2 21% -18
Shropshire, Telford Wrekin -5 42 17% +4 65 29% +24 65 0% 0 3 50% +6
South Yorkshire 1 91 18% +4 74 14% +1 77 19% -1 4 40% +5
Norfolk 2 101 24% +14 57 14% 0 57 14% -1 4 50% +12
Tees Valley 0 29 10% -1 85 30% +17 86 8% -2 5 71% +10
Sussex 4 109 17% +6 132 24% +12 134 6% -2 4 44% -4
Suffolk -5 43 12% 10 59 19% +12 60 11% -4 4 50% +9
Nottinghamshire -1 40 9% -8 67 18% +7 65 15% -5 3 33% +3
Tyne & Wear 2 51 11% -5 55 14% -2 55 2% -6 2 18% -4
Hampshire & IoW 11 86 11% 0 35 2% -24 49 12% -10 3 20% -21
Leicestershire & Rutland 1 72 16% +3 38 7% -13 42 11% -11 2 20% -7
Durham 3 21 7% 0 53 18% -1 56 7% -11 2 33% +1
Lancashire -4 128 16% +2 147 20% +15 146 11% -12 6 43% +2
London 52 341 11% -4 287 11% -9 306 11% -12 13 23% -9
Berkshire 11 24 4% -9 3 0% -18 6 9% -12 -1 -13% -16
Wiltshire 4 21 5% -24 27 9% -9 29 11% -14 2 40% -2
Birmingham 7 66 14% -4 42 10% -6 43 9% -17 0 0% -7
Cheshire & Warrington 4 49 10% -16 67 16% +1 69 5% -18 3 38% -7
Dorset -8 29 12% -7 18 6% -16 19 5% -20 1 17% -14
Gloucestershire 1 41 13% -7 30 10% -7 29 0% -20 1 20% -15
Staffordshire 2 72 14% -5 78 14% -2 80 7% -22 3 30% -12
Hertfordshire 1 41 8% -16 66 14% -4 69 8% -24 5 42% -2
West Yorkshire 13 116 11% -9 136 16% +6 132 8% -24 8 44% +11
Northamptonshire -6 47 15% -1 27 6% -13 29 7% -24 2 40% -2
Coventry, Solihull & Warks. 6 43 8% -11 28 6% -5 24 -2% -37 1 13% -13
Northumberland -5 13 9% -5 40 23% +10 37 -2% -37 4 67% +17
[image:18.595.37.566.60.668.2]Total 93 3,132 13% 0 3,145 14% 0 3,350 12% 0 160 0% 0
13 application in 2013-14. This helps to identify the best performing areas in the context of increasing engagement with Mark more generally.
The first point of note is that every LOC has seen an increase in the number of registered schools and a concurrent increase in those applying for School Games Mark. This growth is not uniform however, with some LOCs experiencing more rapid progression than others.
The LOC which was bottom of the table last year, Somerset, has achieved a notable improvement, with 78% (230) of its eligible schools activated, and 30% (69) of these submitting a School Games Mark application. More significantly, all but one of these applications were successful. The LOC is still below the national average in terms of the total number of applications made however (see Table 3, above), suggesting that there is potential for further growth if more schools can be persuaded to engage. In contrast, Northumberland made proportionately fewer successful applications in 2013-14, despite increasing the overall volume by some 37 schools.
The table also demonstrates that volume alone is not enough to produce improved performance. In London, despite an additional 306 successful applications in the most recent round of School Games Mark awards, the proportion of schools applying is still lower than the national average, at 29%. Further, the rate of successful applications in London, though 11% higher than 2012-13, remains below average, and is now 40th out of 46 LOCs. In short, the largest LOC in the country in terms of the number of schools has increased its engagement with School Games, but other LOCs have done so at a faster rate.
If we drill deeper into the data, our analysis of Mark applications at LOC level shows that there are significant differences within LOC areas. For example; the application rate for London as a whole is just below the national average, at 29%. There is however wide variation between the capital's 32 boroughs in the number of schools registering for School Games and going on to apply for a Mark award. The registration rate in London Central is 55%, lower than any LOC in the country. Further, in London South only 13% of registered school applied for a Mark award in 2013-14, which is less than the lowest ranked LOC. London North has a lower success rate than any other part of the country at 80%. The findings from London point to the likelihood that there are different levels of engagement with the Mark process by SGO.
Again we can interrogate the data in more detail to identify the number of SGO regions within each LOC and then to compute the proportion of SGOs within each LOC submitting at least one Mark application. The national picture is that virtually all (98%) SGOs engaged with the Mark process in 2013-14 and thus this year it is useful to look at the volume of applications by region. Table 5 shows the scores for each LOC area for at least one Mark application; five or more applications; and 10 or more applications.
14 Table 5 - Mark engagement by SGO region
LOC SGOs
At least 1 Application
5 or more Applications
10 or more Applications
Yes % No Yes % No Yes % No
Surrey 6 6 100% 0 6 100% 0 6 100% 0
Tees Valley 7 7 100% 0 7 100% 0 7 100% 0
Durham 6 6 100% 0 6 100% 0 6 100% 0
Cornwall 4 4 100% 0 4 100% 0 4 100% 0
Herefordshire 2 2 100% 0 2 100% 0 2 100% 0
Northumberland 6 6 100% 0 6 100% 0 5 83% 1
Cambs. & Peterborough 5 5 100% 0 5 100% 0 4 80% 1
Sussex 9 9 100% 0 9 100% 0 7 78% 2
Cheshire & Warrington 8 8 100% 0 8 100% 0 6 75% 2
Humber 7 7 100% 0 7 100% 0 5 71% 2
Shropshire 6 6 100% 0 6 100% 0 4 67% 2
North Yorks. 10 10 100% 0 10 100% 0 6 60% 4
Staffordshire 10 10 100% 0 10 100% 0 6 60% 4
Northants. 5 5 100% 0 5 100% 0 3 60% 2
Wiltshire 5 5 100% 0 5 100% 0 3 60% 2
South Yorkshire 10 10 100% 0 10 100% 0 5 50% 5
Somerset 4 4 100% 0 4 100% 0 2 50% 2
Essex 14 14 100% 0 13 93% 1 12 86% 2
Merseyside 14 14 100% 0 13 93% 1 10 71% 4
West Yorkshire 18 18 100% 0 16 89% 2 9 50% 9
Nottinghamshire 9 9 100% 0 8 89% 1 3 33% 6
Bedfordshire 8 8 100% 0 7 88% 1 6 75% 2
Devon 8 8 100% 0 7 88% 1 6 75% 2
Suffolk 8 8 100% 0 7 88% 1 5 63% 3
Kent 16 16 100% 0 14 88% 2 9 56% 7
Lincolnshire 8 8 100% 0 7 88% 1 4 50% 4
Bucks. & Milton Keynes 8 8 100% 0 7 88% 1 4 50% 4
Greater Manchester 21 21 100% 0 18 86% 3 15 71% 6
Lancashire 14 14 100% 0 12 86% 2 8 57% 6
Hertfordshire 12 12 100% 0 10 83% 2 8 67% 4
Black Country 11 11 100% 0 9 82% 2 2 18% 9
Oxfordshire 5 5 100% 0 4 80% 1 4 80% 1
Hampshire 15 15 100% 0 12 80% 3 8 53% 7
Gloucestershire 5 5 100% 0 4 80% 1 2 40% 3
Tyne & Wear 11 11 100% 0 8 73% 3 3 27% 8
Leicestershire & Rutland 10 10 100% 0 7 70% 3 3 30% 7
Dorset 6 6 100% 0 4 67% 2 2 33% 4
Birmingham 11 11 100% 0 7 64% 4 1 9% 10
Berkshire 8 8 100% 0 4 50% 4 - 0% 8
London 56 53 95% 3 32 57% 24 22 39% 34
Derbyshire 10 9 90% 1 8 80% 2 8 80% 2
Coventry, Solihull & Warks. 8 7 88% 1 5 63% 3 2 25% 6
Norfolk 8 7 88% 1 4 50% 4 4 50% 4
West of England 8 7 88% 1 4 50% 4 3 38% 5
Worcestershire 6 5 83% 1 5 83% 1 4 67% 2
Cumbria 6 5 83% 1 3 50% 3 2 33% 4
Total 452 443 98% 9 369 82% 83 250 55% 202
15
Key points
SGO engagement with Mark has improved in 2013-14 relative to 2011-12 with 98% of SGOs now making at least one Mark award application.
Some SGOs are more productive in Mark applications than others, the bottom 25% generate 8% (472) of all applications whereas the top 25% generate 48% (2,835) of applications.
There are significant differences between LOC areas in terms of schools activated, applications made and success rate.
With all but 2% of SGO regions now generating at least one successful application, future growth is likely to be driven by persuading less productive SGOs to submit multiple applications. This in turn means that SGO engagement needs to be measured against higher thresholds to differentiate the high and low performing areas,
The LOC with the largest number of schools in the system, London, illustrates the issue of varying engagement within LOCs.
16
4.2 Causes of failure
In addition to the analysis on schools that were failed during the SIRC validation, applications that failed to meet at least the Bronze level of award according to the online system were reviewed to identify whether there were any learning points in the data. The first noteworthy finding is that the overall number of failed applications was lower for 2013-14 compared with 2012-13 (223 v 429), and this was against a higher number of overall applications (5,906 compared with 2,762). Overall the year on year failure rate has decreased from 16% in 2012-13 year to 4% in 2013-14. Second, the rate of failures from the validated schools was similar to the sample as a whole (3%), which suggests that the sampling is representative and that the criteria are being applied consistently by the online system and the SIRC validators. Third, the majority of failures (189 schools) were "new applicants", having never applied for a School Games Mark award before, only 20 failed applications came from schools that had previously been successful and the remaining 14 had also failed last year. At a headline level, this suggests that schools are making fewer mistakes on their application, and those that have previously been successful with an award are more familiar with the application process.
In order to achieve a Bronze level award, the minimum requirement is to meet the six pre-requisite questions and the five additional questions listed below, which in some cases have different sub-criteria depending on the type and size of schools:
At least having the aspiration to provide 2 hours of PE:
The requisite number of sports at Level 1 for the school type and size;
The requisite number of sports at Level 2 for the school type and size;
At least 5% of pupils engaged in leading, managing and officiating; and
At least 25% of spaces for extra-curricular sport taken up in a typical week.
In 2012-13, none of the 429 schools failed on one of the six pre-requisite questions (this included the 2 hours of PE question, which is no longer a pre-requisite and now has three sub-criteria). All failures were due to answers given to one of the five questions required at the Bronze level. In 2013-14, two schools were failed by their SGO due to not meeting a pre-requisite (alongside other areas at the Bronze level). One did not host a School Games Day; and one did not have a School Games noticeboard. One additional failure (also by an SGO) was due to the evidence for "aspiring" to do 2 hours of PE not being in place. Despite assurances from the school, via the PE co-ordinator, that these discussions were taking place with the senior management team, there was no evidence to support this, for example, new action plans or meeting minutes discussing changing the PE provision.
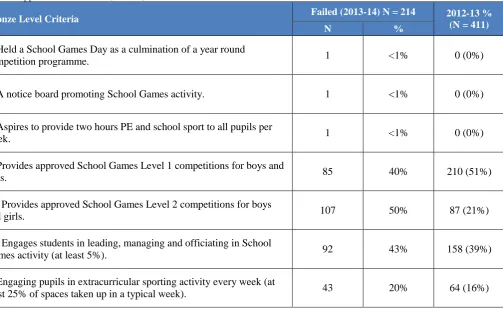
17 Table 6 - Applications that failed (N = 214)
Bronze Level Criteria Failed (2013-14) N = 214 2012-13 %
(N = 411)
N %
3. Held a School Games Day as a culmination of a year round
competition programme. 1 <1% 0 (0%)
5. A notice board promoting School Games activity. 1 <1% 0 (0%)
6. Aspires to provide two hours PE and school sport to all pupils per
week. 1 <1% 0 (0%)
9. Provides approved School Games Level 1 competitions for boys and
girls. 85 40% 210 (51%)
10. Provides approved School Games Level 2 competitions for boys
and girls. 107 50% 87 (21%)
14. Engages students in leading, managing and officiating in School
Games activity (at least 5%). 92 43% 158 (39%)
7. Engaging pupils in extracurricular sporting activity every week (at
least 25% of spaces taken up in a typical week). 43 20% 64 (16%)
The main points emerging from the failed applications analysis are:
Half (50%) of 107 schools failed the Bronze level Mark award due to not meeting the required number of approved sports at Level 2. The failure for the Level 2 requirements saw twenty additional schools fail on this question compared with 2012-13, which accounted for only 21% of failures in 2012-13
Eighty five schools failed to provide the requisite number of Level 1 sports (40%) and this was an eleven percentage point decrease from last year (51%).
Consistent with 2012-13, some validated schools reported simply matching up the sports they did at Level 1 with Level 2, i.e. running sports clubs at Level 1 that were followed by competitive fixtures at Level 2 (which works at the Gold level as the number of sports required at each level are the same, but not at Silver and Bronze). This continued to be an area of delivery that was consistent amongst the higher achieving schools (in Mark award terms). Of the schools that failed to deliver the amount of sports required at either Level 1 or Level 2, (153 schools), 39 of them failed to meet the requirements at both Level 1 and Level 2.
Some 92 (43%) schools that failed recorded less than 5% of students being engaged in leading, managing and officiating, with 35 recording zero engagement and an additional 24 schools recording 1% or 2%. The main reason for understating performance in this criterion in 2012-13 was applicants being unsure which students to include in this calculation, and this continued to be a common error on the application form, despite the improvements in the system to calculate the answer for this question. The proportion of schools failing in this area was slightly higher in 2013-14 than 2012-13 (39%).
18 for 2013-14 to record take-up rather than capacity, and saw a reduction in the number of schools failing in this area (43 in 2013-14 compared with 64 in 2012-13).
[image:24.595.35.447.122.266.2]For schools that did fail, the majority (60% or 128 schools) failed in only one area, as Table 7 shows. Table 7 - Number of areas failing in (for at least a Bronze award)
Number of criteria 2013-14 2012-13
N % N %
Failed on pre-requisite only 2 1% 0 0%
One 128 60% 313 76%
Two 57 27% 85 21%
Three 20 9% 12 3%
Four 6 3% 0 0%
TOTAL 213 100% 411 100%
In summary from Table 7:
Two schools failed a pre-requisite only (see Table 7 above), although they met all the other minimum criteria for a Bronze award. The third school that failed a pre-requisite also failed in three other areas and is included in that sub-group.
Almost two-thirds of schools (128) that failed did so on just one of the four areas (60%), and the most likely reason was a lack of sports at Level 2 (54 schools) followed by the leading, managing and officiating percentage (35 schools);
Just over a quarter failed in two areas (27% or 57 schools);
Twenty schools (9%) failed in three areas;
Six schools failed in four areas (two large primary schools, four large secondary schools) and they included four first-time applicants, and two Bronze schools from 2012-13. No schools failed all five.
For the 60% of schools (128) that failed in just one area, the following breakdown shows what they failed on.
Reasons for failing (for at least a Bronze award)
32 schools failed on just the number of Level 1 sports provided (33% in 2012-13).
54 schools failed on just the number of Level 2 sports provided (11% in 2012-13).
35 schools failed on just leading managing and officiating (less than 5%). (23% in 2012-13).
7 schools failed on just the extra-curricular question (less than 25%). (8% in 2012-13).
19
Key Points
The number of schools failing almost halved in 2013-14 (223 compared with 429 in 2012-13). This is also a significant decrease in terms of overall percentage failure rate (3% in 2013-14 v 16% in 2012-13) given the increased number of applications.
85% (or 189) of schools that failed were first time applicants; therefore some additional work with their SGOs may prove useful to help them become more familiar with the application process.
In similar fashion to last year, the majority of schools that failed to meet at least the Bronze level were unsuccessful due to their answer in one area only (60% cf. 76% in 2012-13), rather than systematic failure across a wider range of criteria.
The most common reasons for failure were insufficient provision of sports at Level 2 (50%) which is a slight change from last year where Level 1 sports were more likely to be a cause of failure. Level 1 provision along with having at least 5% of pupils involved in leading, managing and officiating sport, were criteria that were not met by around two-fifths of failed applications.
4.3 Potential for Progression
In this section we outline the level of attainment by those schools which were independently validated at the Bronze and Silver levels compared with the higher awards to identify the parts of the award criteria that schools were not meeting. Overall, 110 of the 302 validated schools were upgraded following the SIRC visit (36%), 66 to Silver from Bronze, and 44 schools to Gold (29 from Silver, 15 from Bronze).
[image:25.595.45.563.506.764.2]This analysis is important to understand where schools are falling short at the higher award levels, and provides information about how to plan and prepare School Games activity in order to make progression in the following year. The analysis is based on the final level of award achieved (following upgrades and downgrades) and does not include Gold level schools as they all achieved the Gold standard across the Mark criteria. Appendix 3 has the full set of tables outlining the results at each award level. Cells highlighted in red indicate a minority (i.e. under 50%) of achievement against a criterion whereas, cells highlighted in green indicate high levels of achievement against a criterion (in excess of 85%).
Table 8 - All validated schools awarded Silver (N = 128)
School Games Mark Award Criteria
Schools passing at Gold
% (13-14)
% (12-13) N = 141
6. Provision of two hours PE and school sport to all pupils per week. 107 84% N/A
7. Engaging pupils in extracurricular sporting activity every week. 90 70% N/A
8. Can provide evidence of provision of support for talented young sports people. 103 80% 84%
9. Provides approved School Games competition at Level 1. 107 84%
60% 10. Provides approved School Games competition at Level 2. 94 73%
11. Provides School Games Level two competitions for B teams and C teams. 77 60% 48%
12. Promote the School Games to parents and the local community as specified. 62 48% 58%
13. Results of competitions and reports are featured on the school website / press. 116 91% 94%
14. Engages students in leading, managing and officiating in School Games activity. 65 51% 52%
15. Engaged in planning and developing SG (School Sport Organising Committee). 51 40% 41%
16. Is utilising sports coaches to support school sport activity. 128 100% 100%
17. Can provide evidence of training wider school staff to support school sport activity. 119 93% 93%
20 Of those 128 schools awarded Silver, three areas were met by more than 85% of schools; the use of sports coaches (100%), providing training for wider school staff (93%) and results of fixtures published on the website/local press (91%). All three of these areas were amongst the areas most likely to be achieved by Silver schools in 2012-13 as well. Silver schools were least likely to meet the Gold Mark criterion for the promotion of the School Games to parents and the community at least fortnightly (48%) and the provision of a School Sport Organising Committee/Crew (40%), which was similar to 2012-13. One additional area (at least 20% of students engaged in leading, managing and officiating) just exceeded the 50% level by one school. More validated schools in 2013-14 (60%) were meeting the B and C team requirements at Gold than in 2012-13 (48%).
For those schools awarded Bronze, there are two levels of analysis, first against the requirements for a Silver award and second against the requirements for a Gold award. Only one area exceeded 85%, the utilisation of sports coaches (92% at both Silver and Gold). The new staggered PE provision question saw 80% of Bronze schools meeting the 2 hour level via a combination of curriculum and additional activity, and 67% having 2 hours on the curriculum. None of the criteria saw fewer than 50% of Bronze schools meeting the Silver level award; however, eight of the thirteen areas were below 50% at Gold (see Appendix 4).
Areas that stood out for upgraded schools were:
The frequency of promotion of School Games activity to parents and the local community continued to be answered conservatively. Although there were examples of increased Twitter use and increased involvement by Organising Committees/Crews against the criteria, these practices were not in wide use across different SGO areas.
The change in the extra-curricular question made much more sense to applicants that were validated, but still causes some confusion. Many schools were measuring individuals, despite the guidelines explaining the requirements to measure capacity taken up, and this was, therefore, decreasing their percentage. Despite this confusion, many schools were actually exceeding the 50% level at Gold through individuals alone, thus demonstrating a really strong level of engagement in school sport.
There continued to be underreporting of activity in terms of leading managing and officiating, although there appeared to have been a lot of work done in some SGO areas to ensure Organising Committees/Crews had been set up across all schools.
Accurate recording of club links was not commonplace, with the validation visit identifying more links than submitted - SGOs could have a greater role here in co-ordinating local/cluster links.
21
Key Points
The message regarding schools progressing up to a higher level of award is similar to 2012-13, i.e. that there continues to be strong potential for schools engaged with the School Games Mark award to make progression in the future, although the caveat remains that some criteria are more straightforward to develop/deliver than others.
Prominent issues for Silver schools included three areas where the SGO involvement, particularly around understanding what is included, could have a positive impact (club links, promotion of School Games and helping to develop School Sport Organising Committee/Crews). The criteria causing the most issues (in terms of progression) in 2012-13 are similar in 2013-14, although there has been an increase in the proportion of validated schools offering the requisite number of B and C teams (58% v 48%).
A point made in the 2012-13 report stated that "different types of school will face different challenges in order to progress" and this remains the same, as the size of school and type of school makes certain areas of the Mark criteria more difficult than others. For example, the percentage questions in larger schools can be more difficult than in smaller schools where each child accounts for a larger percentage point.
As with 2012-13, the majority of the 110 upgrades made to the sample of 302 independently validated schools could be explained by errors on the application form against one or two criteria, rather than wholesale misinterpretation of the application form.
Armed with the intelligence gained from two years' worth of the independent validation programme, it is ever clearer that the SGOs have an important role in helping schools to plan for progression, particularly around things under their control (e.g. creating Level 2 opportunities) but also in the communication of the Mark requirements, particularly what is included for areas such as promotion and helping to develop active club links across cluster schools.
4.4 Driving Volume
As noted previously the proportion of eligible schools that applied for a Mark award was 32%, with just over two thirds of schools not applying. The independent validation of schools found that 96% of the sample of schools selected met the criteria for a pass at some level and, of these, 110 schools were upgraded. Given that the application and validation processes are demonstrably effective, the challenge remains to encourage the majority (68%) of eligible schools that did not apply for an award in 2013-14 to engage with the scheme. This is what we call ‘driving volume’ and in section 4.4.1 and 4.4.2 we look at the prospects for driving volume by two methods, namely SGO work plans and criteria changes.
4.4.1 SGO Work plans
Table 9 (overleaf) details the forecast number of Mark applications for 2012-13 and 2013-14, measured against the actual outcome. The table is sorted by the standardised measure of actual performance as a percentage of target for 2013-14. In the first year of Mark, the number of applications forecast by SGOs in their work plans proved to be an underestimate of 295 (+22%). In 2012-13, as the forecast number of applications increased significantly, the actual outturn of applications fell short by 364 (-12%), though this still represented an increase of 1,383 applications on the previous year.
22 there was only a marginal fall of 2% from 2012-13. This overall figure conceals some significant variation at LOC level however, which raises a number of questions.
For the second year running, Bedfordshire generated the highest rate of applications from its registered schools (66%). This was only marginally short of its forecast for the year, and the county was one of four to get within 2 applications of its target. Conversely, Berkshire was the worst performing LOC on this measure, with only 37% of the forecast 107 applications materialising. In Somerset however, where there was a significant increase in the number of successful applications, delivery was 29% ahead of target. Sussex's SGOs managed to generate an additional 88 applications above their collective target (+80%), while the equivalent figure for Surrey was 51 (+54%). Overall, thirteen LOCs exceeded their work plan forecasts, while 32 fell short.
23 Table 9 - Mark applications - forecast and actual
LOC 2011-12 2012-13 2013-14 2014-15
Actual Forecast Actual Var % Forecast Actual Var % Forecast
Sussex 19 49 65 16 133% 110 198 88 180% 120
Surrey 3 23 69 46 300% 94 145 51 154% 101
Cornwall 14 15 44 29 293% 77 111 34 144% 77
Herefordshire 1 2 5 3 250% 15 21 6 140% 45
Devon 21 55 75 20 136% 111 150 39 135% 83
Tees Valley 11 34 42 8 124% 99 127 28 128% 103
Somerset 11 10 9 -1 90% 54 69 15 128% 70
Staffordshire 36 88 76 -12 86% 136 154 18 113% 150
Derbyshire 4 55 41 -14 75% 162 183 21 113% 143
Merseyside 80 99 118 19 119% 164 178 14 109% 170
Shropshire, Telford Wrekin 7 10 15 5 150% 75 81 6 108% 94
Essex 4 107 80 -27 75% 230 247 17 107% 191
North Yorkshire 9 33 44 11 133% 148 157 9 106% 157
Cumbria 0 0 18 18 61 61 0 100% 87
West Yorkshire 27 79 51 -28 65% 188 187 -1 99% 190
Bedfordshire 81 113 142 29 126% 171 169 -2 99% 139
Bucks. & Milton Keynes 20 44 41 -3 93% 81 79 -2 98% 97
West of England 10 27 33 6 122% 85 82 -3 96% 168
Humber 73 119 85 -34 71% 159 153 -6 96% 159
Dorset 9 16 35 19 219% 57 54 -3 95% 178
South Yorkshire 33 80 47 -33 59% 129 121 -8 94% 150
Greater Manchester 116 204 171 -33 84% 363 335 -28 92% 237
Lancashire 7 47 46 -1 98% 211 193 -18 91% 177
Suffolk 18 30 28 -2 93% 99 88 -11 89% 125
Nottinghamshire 11 10 18 8 180% 98 86 -12 88% 190
Durham 35 70 68 -2 97% 138 121 -17 88% 108
Black Country 23 37 33 -4 89% 88 77 -11 88% 151
Cambs. & Peterborough 37 42 39 -3 93% 94 81 -13 86% 191
Oxfordshire 15 95 48 -47 51% 138 118 -20 86% 142
Worcestershire 35 46 50 4 109% 81 66 -15 81% 136
Cheshire & Warrington 53 87 68 -19 78% 168 135 -33 80% 146
Hertfordshire 60 102 86 -16 84% 192 151 -41 79% 139
Gloucestershire 27 35 25 -10 71% 71 55 -16 77% 149
Northumberland 21 38 33 -5 87% 95 73 -22 77% 87
Leicestershire & Rutland 32 53 50 -3 94% 126 88 -38 70% 164
Tyne & Wear 11 42 47 5 112% 152 102 -50 67% 165
Birmingham 2 30 31 1 103% 110 73 -37 66% 137
Hampshire & IoW 38 117 130 13 111% 256 166 -90 65% 207
Northamptonshire 9 63 52 -11 83% 124 79 -45 64% 99
Norfolk 0 2 17 15 850% 116 73 -43 63% 463
London 202 564 303 -261 54% 940 590 -350 63% 553
Wiltshire 3 17 31 14 182% 92 57 -35 62% 99
Kent 90 188 132 -56 70% 325 196 -129 60% 194
Lincolnshire 40 72 56 -16 78% 138 80 -58 58% 125
Coventry, Solihull & Warks. 11 22 29 7 132% 103 57 -46 55% 111
Berkshire 10 55 36 -19 65% 107 40 -67 37% 111
Total 1,379 3,126 2,762 -364 88% 6,831 5,906 -924 86% 7,079
London West 91 135 113 -22 84% 192 149 -43 78% 125
London East 28 106 76 -30 72% 275 200 -75 73% 172
London North 42 114 69 -45 61% 181 128 -53 71% 251
London South 18 25 21 -4 84% 85 49 -36 58% 157
London Central 23 184 24 -160 13% 207 63 -144 30% 172