Dialogic Teaching: Addendum Report
THOMAS, Peter <http://orcid.org/0000-0003-3816-3158>, JAY, Tim
<http://orcid.org/0000-0003-4759-9543>, WILLIS, Benjamin
<http://orcid.org/0000-0002-4346-0459>, TAYLOR, Roberta
<http://orcid.org/0000-0002-2924-8216>, MERCHANT, Guy
<http://orcid.org/0000-0001-8436-7675>, MOORE, Nicolas
<http://orcid.org/0000-0002-0829-5523>, BURNETT, Cathy
<http://orcid.org/0000-0001-6087-244X> and STEVENS, Anna
<http://orcid.org/0000-0002-9450-890X>
Available from Sheffield Hallam University Research Archive (SHURA) at:
http://shura.shu.ac.uk/24924/
This document is the author deposited version. You are advised to consult the
publisher's version if you wish to cite from it.
Published version
THOMAS, Peter, JAY, Tim, WILLIS, Benjamin, TAYLOR, Roberta, MERCHANT, Guy,
MOORE, Nicolas, BURNETT, Cathy and STEVENS, Anna (2019). Dialogic Teaching:
Addendum Report. Project Report. London, UK, Education Endowment Foundation.
Copyright and re-use policy
See
http://shura.shu.ac.uk/information.html
Addendum – added April 2019
Executive summary
This addendum should be read in conjunction with the main report on this project: “Dialogic Teaching: Evaluation Report and Executive Summary, July 2017”. It reports on analysis of KS2 data constituting the secondary outcome measures for the evaluation. These data were not available at the time of publication of the main report.
[image:2.595.73.515.427.642.2]The Dialogic Teaching intervention took place over the autumn and spring terms of the 2015/16 school year, with a cohort of Year 5 pupils. The data analysed in this document are derived from the Key Stage 2 national curriculum assessments completed by pupils in the summer term of the 2016/17 school year.
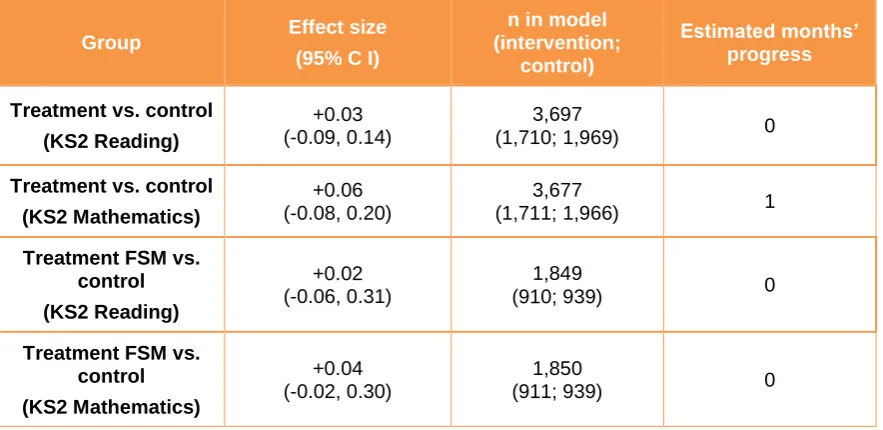
Table 1: Summary of impact on outcomes
Group Effect size
(95% C I)
n in model (intervention;
control)
Estimated months’ progress
Treatment vs. control
(KS2 Reading)
+0.03 (-0.09, 0.14)
3,697
(1,710; 1,969) 0
Treatment vs. control (KS2 Mathematics)
+0.06 (-0.08, 0.20)
3,677
(1,711; 1,966) 1
Treatment FSM vs. control (KS2 Reading)
+0.02 (-0.06, 0.31)
1,849
(910; 939) 0
Treatment FSM vs. control (KS2 Mathematics)
+0.04 (-0.02, 0.30)
1,850
(911; 939) 0
Key conclusions
1. These analyses provide no definitive evidence that Dialogic Teaching schools made additional progress, measured by attainment in KS2 national tests, when compared with controls. The estimated effects are very small and not statistically significant.
2. No data were available regarding schools’ practices during the four terms between the end of
Methods
A full account of methods relating to the impact analysis for this project is included on pages 13-17 of the main report1.
This addendum reports the analysis of secondary outcome measures for the report: pupil scores in KS2 national tests in English reading and Mathematics. For the analyses of these secondary outcome measures, we employed a 3-level clustered design (the same model as used for analysis of primary outcome measures in the main report), with KS2 scores for English reading and Mathematics as outcome variables, KS1 scores as covariate, and experimental group and eligibility for free school meals as predictors.
The modelling was conducted in the following stages; first, a main effects stage followed by an interaction stage. The main effects model is used for the main results. This was constructed in two steps:
1. pupil participant variables—intervention/control dummy variable and KS1 attainment; and 2. as 1, but also including FSM status (pupil level).
The second step represents the models that will be used for the main results. The first step is included for sensitivity and so that the findings can be compared across different trials. Covariate tables are reported in the appendix.
Effect sizes for a cluster randomised trial using total variance can be calculated as:
where (Y̅T−Y̅C) adjusted denotes ANCOVA mean difference between intervention groups adjusting for NPD KS1 pre-test score and other pupil background variables (EverFSM) (See appendix for Effect Size worked example.).
On-treatment analysis
An on-treatment analysis repeated the main analysis described above but included only the 31 Dialogic Teaching schools that participated fully in the intervention along with the control schools. This means that this analysis included schools that took part in all training and plenary sessions provided by the project delivery team and returned completed pupil tests at the end of the intervention. Fully participating schools were coded as 1 and non-compliers as 0. Those schools that did not comply were thus not included in the comparison.
Sensitivity analysis
The main analysis was repeated including only prior attainment at KS1 as a covariate in order to test the model’s sensitivity to inclusion of covariates.
1 Jay, T. et al. (2017). Dialogic Teaching: Evaluation report and executive summary. London: Education Endowment Foundation. Available at:
Sub-group analyses
Subgroup analyses of FSM and non-FSM pupils were carried out, as well as sub-group analysis for pupils with low prior attainment. In addition, tests for interaction were conducted to assess whether there were differential effects by FSM status or by prior attainment.
Low attainment was defined as those in the lower third in the distribution of previous attainment.
Missing data
The majority of unmatched data with respect to the analysis of secondary outcome measures was at classroom level (1086 cases of 4958). That is to say, we had NPD data for pupils and schools but we did not have data from the schools themselves regarding the classes pupils were in for Y6. To
complete the 3-level analysis Y5 classroom data was used (this was deemed appropriate because the pupils were in Year 5 when they completed the intervention). Nevertheless, given the unmatched classroom data potentially compromised the robustness of the 3-level (pupils within classrooms, within schools) model employed for the main analysis the analysis was repeated, employing a 2-level model (pupils within schools) in order to test the similarity of findings. The two-level analysis allowed us to use the vast majority of the actual data cases available. However, it should be noted that this represents a deviation from the SAP protocol as it was not possible to foresee this reason for missing data.
Impact evaluation
[image:5.595.39.561.272.651.2]Pupil characteristics
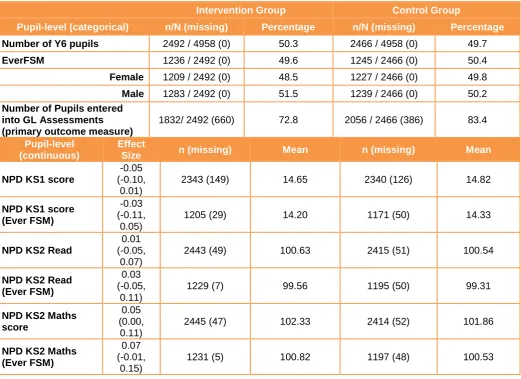
Table 2 summarises pupil characteristics of the sample at analysis stage. The intervention group had a slightly higher proportion of boys than girls, whereas the control group was evenly split. At 49.6% (intervention) and 50.4% (control), the proportion of pupils eligible for FSM was very similar in the two groups. KS2 data was obtained for 98% of the Intervention group and 98% of the Control group.
The bottom half of Table 2 gives means for the secondary outcome measures and shows slightly higher mean scores on all four measures (KS2 score for English reading and KS2 score for Mathematics, for all pupils, and for those pupils ever eligible for free school meals) for the intervention group relative to controls.
Table 2: Pupil Characteristics for secondary analysis
Intervention Group Control Group
Pupil-level (categorical) n/N (missing) Percentage n/N (missing) Percentage
Number of Y6 pupils 2492 / 4958 (0) 50.3 2466 / 4958 (0) 49.7
EverFSM 1236 / 2492 (0) 49.6 1245 / 2466 (0) 50.4
Female 1209 / 2492 (0) 48.5 1227 / 2466 (0) 49.8
Male 1283 / 2492 (0) 51.5 1239 / 2466 (0) 50.2
Number of Pupils entered into GL Assessments (primary outcome measure)
1832/ 2492 (660) 72.8 2056 / 2466 (386) 83.4
Pupil-level (continuous)
Effect
Size n (missing) Mean n (missing) Mean
NPD KS1 score
-0.05 (-0.10,
0.01)
2343 (149) 14.65 2340 (126) 14.82
NPD KS1 score (Ever FSM)
-0.03 (-0.11,
0.05)
1205 (29) 14.20 1171 (50) 14.33
NPD KS2 Read
0.01 (-0.05,
0.07)
2443 (49) 100.63 2415 (51) 100.54
NPD KS2 Read (Ever FSM)
0.03 (-0.05,
0.11)
1229 (7) 99.56 1195 (50) 99.31
NPD KS2 Maths score
0.05 (0.00,
0.11)
2445 (47) 102.33 2414 (52) 101.86
NPD KS2 Maths (Ever FSM)
0.07 (-0.01,
0.15)
Outcomes and analysis
Main effects stage
Data from NPD was collected for all 4958 pupils at randomisation.
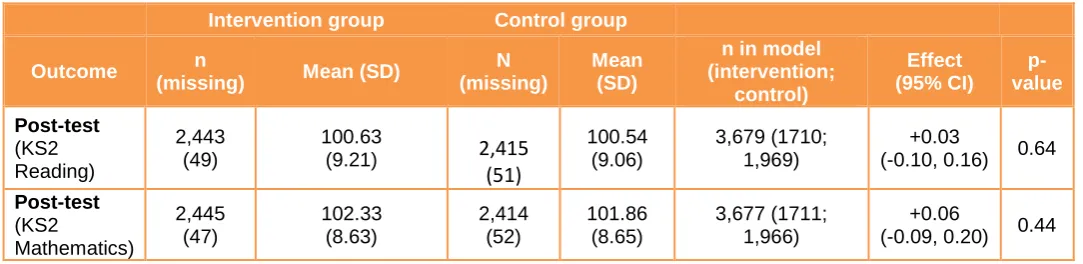
See Table 3 for a summary of main effects. When examining the main effects models controlling for prior attainment, and pupil FSM the intervention group marks for KS2 Reading were 0.09 units higher than the control. There was a low effect size of +0.03. We cannot discount the possibility that this result has happened by chance [p = .64].
The KS2 Mathematics marks for the intervention group were 0.47 units higher than the control group. There was a low effect size of +0.06. We cannot discount the possibility that this result has happened by chance [p = .43].
Table 3: Analysis of secondary outcome measures
Intervention group Control group
Outcome n
(missing) Mean (SD)
N (missing)
Mean (SD)
n in model (intervention; control) Effect (95% CI) p-value Post-test (KS2 Reading) 2,443 (49) 100.63
(9.21)
2,415
(51)
100.54 (9.06) 3,679 (1710; 1,969) +0.03 (-0.09, 0.14) 0.64 Post-test (KS2 Mathematics) 2,445 (47) 102.33 (8.63) 2,414 (52) 101.86 (8.65) 3,677 (1711; 1,966) +0.06 (-0.08, 0.20) 0.43 On-treatment AnalysisTable: 4: On-treatment analysis summary
Intervention group Control group
Outcome n
(missing) Mean (SD)
N (missing)
Mean (SD)
n in model (intervention; control) Effect (95% CI) p-value Post-test (KS2 Reading) 1,858 (585) 100.69
(9.11)
2,415
(51)
100.54 (9.06) 3,565 (1,596; 1,969) +0.04 (-0.09, 0.17) 0.55 Post-test (KS2 Mathematics) 1,859 (586) 102.44 (8.40) 2,414 (52) 101.86 (8.65) 3,563 (1,597; 1,966) +0.06 (-0.09, 0.21) 0.44An on-treatment analysis was conducted that included in the intervention group only those 31 schools that participated fully in the intervention for the two terms of the project. When examining the main effects models controlling for prior attainment, and pupil FSM the intervention group marks for KS2 Reading were 0.15 units higher than the control. There was a low effect size of +0.04. We cannot discount the possibility that this result has happened by chance [p = .55].
The KS2 Mathematics marks for the intervention group were 0.58 units higher than the control group. There was a low effect size of +0.06. We cannot discount the possibility that this result has happened by chance [p = .44].
There is very little difference between the findings of the main analysis and those of the on-treatment analysis, suggesting similar changes in attainment for pupil in both sets of schools.
When examining the main effects models considering intervention and control dummy, and controlling for KS1 prior attainment only, there was a small effect size of +0.03 for KS2 Reading and a small effect size of +0.06 for KS2 mathematics. It is not possible to rule out chance as an explanation for the effect observed. These findings are almost identical with those from the main analysis, which adds confidence in the robustness of its conclusions.
Table 5: Summary of sensitivity analysis including KS1 covariate only
Intervention group Control group
Outcome n
(missing) Mean (SD)
N (missing)
Mean (SD)
n in model (intervention;
control)
Effect (95% CI)
p-value
Post-test
(KS2 Reading)
2,443 (49)
100.63
(9.21)
2,415
(51)
100.54 (9.06)
3,679 (1710; 1,969)
+0.03
(-0.10, 0.16) 0.64
Post-test
(KS2
Mathematics)
2,445 (47)
102.33 (8.63)
2,414 (52)
101.86 (8.65)
3,677 (1711; 1,966)
+0.06
(-0.09, 0.20) 0.44
Sub-Group analysis
There was no significant interaction effect between the intervention and FSM status. For KS2 Reading the co-efficient was -.1751 (SE .389) [p = .65]. For KS2 Mathematics the co-efficient was -.2017 (SE .371) [p = .59]. This means that the effect of the intervention on attainment did not differ between FSM and non-FSM groups for Mathematics or for Reading.
The analyses performed for the full data were repeated for the subgroup FSM and non-FSM pupils (using EverFSM6 from NPD).
For FSM pupils the intervention group marks for KS2 Reading were 0.25 units higher than the control. There was a low effect size of +0.02. We cannot discount the possibility that this result has happened by chance [p = .77]. The KS2 Mathematics marks for the intervention group were 0.58 units higher than the control group. There was a low effect size of +0.04. We cannot discount the possibility that this result has happened by chance [p = .62].
Table 6: Sub-Group analysis: Free School Meal Eligible (Ever FSM6) controlling for KS1 prior attainment
Raw means Effect size
Intervention group Control group
Outcome n
(missing) Mean (SD)
n (missing)
Mean (SD)
n in model (intervention; control) Effect (95% CI) p-value Post-test (KS2 Reading) 1,229 (7) 99.56 (9.10)
1,195
(50)
99.31 (8.96) 1,849 (910; 939) +0.02 (-0.06, 0.31) 0.77 Post-test (KS2 Mathematics) 1,231 (5) 101.11 (8.76) 1,197 (48) 100.53(8.82) 1,850 (911;939)
+0.04 (-0.02,
0.30)
0.62
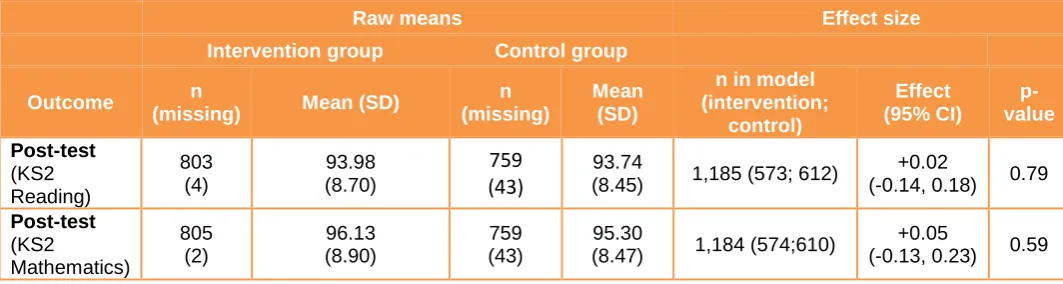
We considered pupils with low prior attainment by analysing those pupils in the lowest third in terms of prior attainment.
There was no significant interaction effect between the intervention and prior attainment status. For KS2 Reading the co-efficient was -.045 (SE .059) [p = .45]. For KS2 Mathematics the co-efficient was -.086 (SE .056) [p = .13]. This means that the effect of the intervention on attainment did not differ by prior attainment.
The intervention group marks for KS2 Reading were 0.35 units higher than the control. There was a low effect size of +0.02. We cannot discount the possibility that this result has happened by chance [p = .79]. The KS2 Mathematics marks for the intervention group were 0.97 units higher than the control group. There was a low effect size of +0.05. We cannot discount the possibility that this result has happened by chance [p = .59].
For those pupils with high prior attainment (the highest third) the intervention group marks for KS2 Reading were 0.21 units higher than the control. There was a low effect size of +0.04. We cannot discount the possibility that this result has happened by chance [p = .74]. The KS2 Mathematics marks for the intervention group were 0.32 units higher than the control group. There was a low effect size of +0.04. We cannot discount the possibility that this result has happened by chance [p = .75].
Table 7: Low attainment (pupils whose prior attainment is in the lowest third)
Raw means Effect size
Intervention group Control group
Outcome n
(missing) Mean (SD)
n (missing)
Mean (SD)
n in model (intervention; control) Effect (95% CI) p-value Post-test (KS2 Reading) 803 (4) 93.98 (8.70)
759
(43)
93.74(8.45) 1,185 (573; 612)
+0.02
(-0.14, 0.18) 0.79
Post-test (KS2 Mathematics) 805 (2) 96.13 (8.90) 759 (43) 95.30
(8.47) 1,184 (574;610)
+0.05
(-0.13, 0.23) 0.59
Missing Data
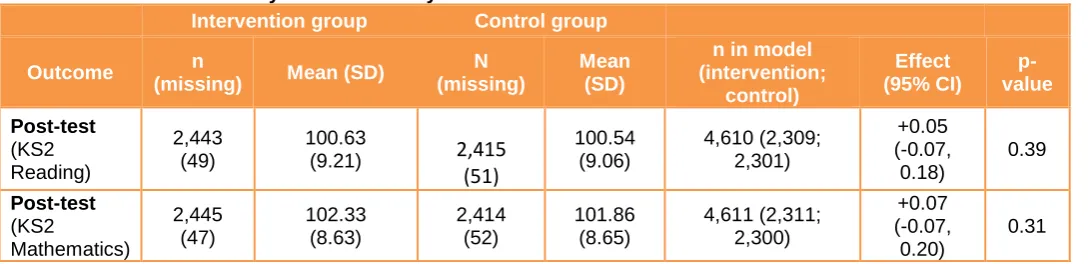
[image:8.595.32.564.517.659.2]In the secondary analysis main 3-level model for KS2 Reading (with covariates) we have 3,679 pupils and 3,677 for KS2 Mathematics (representing 74% of the original pupils).
The majority of missing data with respect to the analysis of secondary outcome measures was at classroom level, meaning that it was not possible to match all pupils with a particular classroom group (1,086 cases missing). This compromised the robustness of the 3-level (pupils within classrooms, within schools) model employed for the main analysis. For this reason the analysis was repeated, employing a 2-level model (pupils within schools), in order to test the similarity of findings. A two-level model (pupils within schools) allowed us to analyse data for 4859 cases. This approach was not specified in the Statistical Analysis Plan, but represents the most appropriate response to the data given that the difficulty in matching pupils to classes could not have been predicted.
An analysis was therefore run as a two-stage model comprising only school and pupil level data. In this test for KS2 Reading with covariates there were 4,610 in the model and for KS2 Mathematics with covariates there were 4,611 in the model. For KS2 Reading there was a low effect size of +0.05, so this is a slightly bigger effect size than the 3-level model (+0.03) and the model explains slightly more of the variance (51.5%, compared to 49.7%). We cannot discount the possibility that this result has happened by chance [p = .39]. For KS2 Mathematics there was a low effect size of +0.07. We cannot discount the possibility that this result has happened by chance [p = .31].
[image:9.595.32.578.426.558.2]For consistency, a two-stage model was also run for the on-treatment pupils. In this test for KS2 Reading there were 4,055 in the model and for KS2 Mathematics there were also 4,055 in the model. For KS2 Reading there was a low effect size of +0.03. We cannot discount the possibility that this result has happened by chance [p = .63]. For KS2 Mathematics there was a low effect size of +0.06. We cannot discount the possibility that this result has happened by chance [p = .41]. These results are very similar to what was found in the main on-treatment analysis.
Table 8: 2-level analysis of secondary outcome measures
Intervention group Control group
Outcome n
(missing) Mean (SD)
N (missing)
Mean (SD)
n in model (intervention;
control)
Effect (95% CI)
p-value
Post-test
(KS2 Reading)
2,443 (49)
100.63
(9.21)
2,415
(51)
100.54 (9.06)
4,610 (2,309; 2,301)
+0.05 (-0.07, 0.18)
0.39
Post-test
(KS2
Mathematics)
2,445 (47)
102.33 (8.63)
2,414 (52)
101.86 (8.65)
4,611 (2,311; 2,300)
+0.07 (-0.07, 0.20)
Conclusion
The findings in the main report provided some evidence for a small effect of Dialogic Teaching on attainment immediately after the invention concluded. This was most pronounced for English and Science attainment, but there was also a small but significant effect on attainment in Mathematics for FSM pupils.
However, the results presented in this addendum provide no evidence of an effect of the intervention on scores in the Key Stage 2 national curriculum assessments. Findings are robust to the multiple specifications and sensitivity analyses planned. Given the small, but significant, effects observed in the analysis included in the main report, there are several potential interpretations of the current findings. One possibility is that the effect of the intervention decays over time. That is to say that schools may have continued to employ a dialogic teaching approach but over time this approach reduces in effectiveness. An alternative interpretation is that schools have not continued to employ a Dialogic Teaching approach during the period between the end of intervention and the point in time when KS2 tests were administered, thus diluting any of the positive effects reported in the main report.. A third possibility is that the measures used in the main report were more sensitive to effects of this intervention than the KS2 test scores used for the analyses in this report. While the tests used to produce the analyses in the main report (Progress Test in Maths, Progress Test in English, and Progress Test in Science; GL Assessments) have been designed to reflect the new national curriculum and to predict performance in national tests, it is possible that there may be subtle differences that explain the differences in findings.
The main report recommended that, given its complexity, this intervention be tested over a two- to three-year period. The findings reported here reinforce the need for such further research to investigate the potential for a Dialogic Teaching approach to improve pupil learning. It is likely that schools and teachers would need longer-term support (beyond the two terms of this intervention) in order to realise any potential benefits for pupil learning in the long term.
Limitations
The intervention took place during the autumn and spring terms of the 2015/16 school year, while the KS2 assessments were administered in the summer term of the 2016/17 school year. Data were not collected on schools’ use of the dialogic teaching approach between the end of the intervention and the period when KS2 assessments took place. Hence, it is not possible to assess whether these results are due to schools stopping delivery of the intervention and diluting its potential effects.
Key conclusions
1. These analyses provide no definitive evidence that Dialogic Teaching schools made additional progress, measured by attainment in KS2 national tests, when compared with controls. The estimated effects are very small and not statistically significant.
2. No data were available regarding schools’ practices during the four terms between the end
Appendix A: Model covariates
KS2 Reading Intervention Intervention & KS1
Attainment
Pupil Background
b s.e b s.e b s.e
Intervention -0.04 0.67 0.28 0.59 0.28 0.59
KS1 (centred) - - 1.83 0.03 1.82 0.03
EverFSM - - - - -0.76 0.20
Constant 100.97 0.45 100.82 0.40 101.2 0.41
s.e vpc s.e vpc s.e vpc
L 3 var. estimate 5.79 1.36 0.08 4.87 1.07 0.13 4.77 1.05 0.13
L 2 var. estimate 1.0 0.60 0.01 1.06 0.38 0.03 1.02 0.38 0.03
L 1 var. estimate 68.25 1.59 0.91 32.04 0.76 0.85 31.9 0.76 0.85
Total 75.0 38.0 37.7
Total change variance / power
0.0 0.0% 37.0 49.4% 37.3 49.7%
KS2 Maths KS2 KS2 & KS1
Attainment
Pupil Background
b s.e b s.e b s.e
Intervention 0.25 0.71 0.50 0.64 0.50 0.63
KS1 (centred) - - 1.69 0.03 1.67 0.03
EverFSM - - - - -1.05 0.19
Constant 102.35 0.48 102.15 0.43 102.7 0.44
s.e vpc s.e vpc s.e vpc
L 3 var. estimate 7.33 1.51 0.11 6.26 1.20 0.18 6.17 1.18 0.17
L 2 var. estimate 0.2 0.42 0.00 0.23 0.24 0.01 0.20 0.23 0.01
L 1 var. estimate 58.66 1.36 0.89 29.30 0.70 0.82 29.1 0.69 0.82
Total 66.2 35.8 35.4
Total change variance / power
0.01 0.0% 34.4 46.0% 34.8 46.5%
KS2 Reading EverFSM
KS2 KS2 & KS1
Attainment
b s.e b s.e
Intervention -0.07 0.68 0.18 0.61
KS1 (centred) - - 1.77 0.04
EverFSM - - - -
Constant 99.90 0.46 100.42 0.42
s.e vpc s.e vpc
L 3 var. estimate 5.22 1.40 0.07 4.59 1.16 0.12
L 2 var. estimate 0.0 0.00 0.00 0.84 0.59 0.02
L 1 var. estimate 67.54 2.23 0.93 34.14 1.17 0.88
Total 72.8 39.6
Total change variance / power
KS2 Maths EverFSM
KS2 KS2 & KS1
Attainment
b s.e b s.e
Intervention 0.14 0.82 0.34 0.70
KS1 (centred) - - 1.69 0.04
EverFSM - - - -
Constant 101.26 0.56 101.71 0.47
s.e vpc s.e vpc
L 3 var. estimate 9.11 2.04 0.13 6.82 0.70 0.18
L 2 var. estimate 0.0 0.00 0.00 0.21 0.43 0.01
L 1 var. estimate 59.90 1.97 0.87 31.23 1.07 0.82
Total 69.0 38.3
Total change variance / power
0.0 0.0% 30.8 44.6%
Model covariates for 2-level analysis
KS2 Reading Intervention Intervention & KS1
Attainment
Pupil Background
b s.e b s.e b s.e
Intervention 0.18 0.60 0.50 0.58 0.50 0.58
KS1 (centred) - - 1.91 0.03 1.89 0.03
EverFSM - - - - -0.73 0.18
Constant 100.42 0.43 100.7 0.41 101.1 0.42
s.e vpc s.e vpc s.e vpc
L 2 var. estimate 5.53 1.16 0.06 5.81 1.05 0.14 5.74 1.04 0.14
L 1 var. estimate 78.1 1.59 0.93 35.1 0.73 0.86 34.8 0.73 0.86
Total 83.6 40.9 40.6
Total change variance / power
0.01 0.0% 42.8 51.1% 43.0 51.5%
KS2
Mathematics
Intervention Intervention & KS1
Attainment
Pupil Background
b s.e b s.e b s.e
Intervention 0.31 0.66 0.61 0.61 0.61 0.60
KS1 (centred) - - 1.79 0.03 1.77 0.03
EverFSM - - - - -0.97 0.17
Constant 101.8 0.47 102.01 0.43 102.5 0.44
s.e vpc s.e vpc s.e vpc
L 2 var. estimate 7.11 1.36 0.09 6.49 1.15 0.17 6.34 1.14 0.17
L 1 var. estimate 67.1 1.38 0.90 31.6 0.66 0.83 31.4 0.65 0.83
Total 74.2 38.1 37.6
Total change variance / power
Appendix B: Effect Size Worked Example
Referring to Table 3 (Outcomes and Analysis), the main effects model for KS2 Reading shows a coefficient of 0.28 for the intervention group with a standard error of 0.59.
The standard error can be used to calculate 95% confidence intervals for the coefficient:
95% Confidence Interval = Coefficient +/- (1.96 x standard error) = -0.28 +/- (1.96 x 0.59)
Upper limit of confidence interval = 0.28 + 1.156 = + 1.43
Lower limit of confidence interval = 0.28 - 1.156 = -0.87
This tells us that, once random variation is taken into account, the coefficient cannot be confidently distinguished from zero.
The coefficients and confidence intervals can be converted into an effect size by dividing them by the standard deviation. The standard deviation is pooled from the control and intervention group (s=9.13).
For the primary outcome, this is calculated to be s= 9.13
Converting the coefficient and 95% confidence interval limits into effect sizes:
Coefficient / pooled standard deviation = -0.28 / 9.13 = - 0.03
Confidence interval upper limit = +1.43 /9.13 = + 0.16
Confidence interval lower limit = - 0.87 / 9.13 = - 0.10
As reported in the 'Outcomes and Analysis' section:
You may re-use this document/publication (not including logos) free of charge in any format or medium, under the terms of the Open Government Licence v2.0.
To view this licence, visit www.nationalarchives.gov.uk/doc/open-government-licence/version/2
or email: [email protected]
Where we have identified any third party copyright information you will need to obtain permission from the copyright holders concerned. The views expressed in this report are the authors’ and do not necessarily reflect those of the Department for Education.
This document is available for download at www.educationendowmentfoundation.org.uk
The Education Endowment Foundation
9th Floor, Millbank Tower 21–24 Millbank
London
SW1P 4QP