Hate crime in Suffolk : understanding prevalence and
support needs
WONG, Kevin, CHRISTMANN, Kris, MEADOWS, Linda, ALBERTSON, Katherine <http://orcid.org/0000-0001-7708-1775> and SENIOR, Paul
Available from Sheffield Hallam University Research Archive (SHURA) at:
http://shura.shu.ac.uk/10393/
This document is the author deposited version. You are advised to consult the publisher's version if you wish to cite from it.
Published version
WONG, Kevin, CHRISTMANN, Kris, MEADOWS, Linda, ALBERTSON, Katherine and SENIOR, Paul (2013). Hate crime in Suffolk : understanding prevalence and support needs. Project Report. Hallam Centre for Community Justice, Sheffield Hallam University.
Copyright and re-use policy
See http://shura.shu.ac.uk/information.html
Sheffield Hallam University Research Archive
Hate Crime in Suffolk
Understanding prevalence
and support needs
Kevin Wong, Kris Christmann,
Linda Meadows, Katherine
Albertson and Paul Senior
Additional contributors - Michelle Rogerson and
Andrew Newton
Hate Crime in Suffolk
Understanding prevalence and support needs
Kevin Wong, Kris Christmann, Linda Meadows, Katherine Albertson
and Paul Senior
Additional contributors -
Michelle Rogerson and Andrew Newton
ISBN 978-1-84387-362-4
©2013 Sheffield Hallam University
Whilst every effort has been made to ensure that the information contained in this report is accurate and up-to-date, neither the author nor the publisher can accept legal
responsibility or liability for anything done by readers in consequence of any errors or omissions.
All rights reserved. No part of this publication may be reproduced, stored in a retrieval system, or transmitted in any form, or by any means, electronic, mechanical, photocopying, recording or otherwise, without prior written permission of the publishers.
Printed by: The Print Unit, Sheffield Hallam University
Published by:
Hallam Centre for Community Justice Sheffield Hallam University
Unit 10, Science Park Howard Street
Hate Crime in Suffolk
Understanding prevalence
and support needs
Kevin Wong, Kris Christmann, Linda Meadows,
Katherine Albertson and Paul Senior
Additional contributors -
Michelle Rogerson and Andrew Newton
Acknowledgements
The authors would like to thank all the individuals who assisted and contributed to this research, in particular Yvette Gallagher and Kelly Weston, the members of the Suffolk Hate Crime Partnership, Suffolk Police and members of the public.
Special thanks to Nicola Barraclough from the Hallam Centre for Community Justice, Sheffield Hallam University for additional analysis and Helen Young for formatting and proofreading this report.
Enquiries about this report
Contents
Executive Summary ... i
The prevalence of Hate Crime in Suffolk ... i
The reporting and non-reporting of Hate Crime in Suffolk ... ii
The geographical distribution of Hate Crime across Suffolk ... ii
The enforcement and support needs of victims of Hate Crime ... iii
Recommendations ... iv
1. Introduction ... 1
1.1 The research project ... 1
1.2 The local context ... 2
1.3 National context ... 3
1.4 Hate Crime ... 3
1.5 Report structure ... 4
2. Methodology ... 5
2.1 Research components ... 5
2.2 Component One – Literature review and documentary analysis ... 5
2.3 Component Two – Analysis of reported Hate Crime and Unreported Hate Crime ... 5
2.4 Component Three – Survey of communities vulnerable to Hate Crime ... 6
2.5 Component Four – Interviews and focus groups with communities vulnerable to Hate Crime ... 7
2.6 Component Five – Interviews with representative from local agencies ... 7
2.7 Component Six – Workshop with representatives from local agencies ... 7
2.8 Limitations of the methodology ... 8
3. Prevalence of Hate Crime in Suffolk ... 10
3.1 Introduction ... 10
3.2 Overall Hate Crime Trends: Suffolk Police Data ... 10
3.3 Types of Hate Crime Offences occurring in Suffolk ... 11
3.4 Hate Element of Offences (Equality Strands Analysis where there is data) ... 13
3.5 Prejudice Related Incidents Occurring in Suffolk Schools ... 15
3.6 Frequency of Hate Crimes ... 16
3.8 Third party reporting centres ... 18
3.9 Conclusion ... 18
4. Reporting and non-reporting of Hate Crime and barriers to the reporting of Hate Crime ... 20
4.1 Introduction ... 20
4.2 Estimating non reported Hate Crime in Suffolk by equality strand ... 21
4.3 Reporting and non-reporting of Hate Crimes by incident type ... 22
4.4 Reporting of all crime to the police ... 23
4.5 Reasons for non-reporting of Hate Crime to the police ... 24
4.6 Findings on non-reporting of Hate Crime from other studies... 30
4.7 Social context and the reporting of crime ... 33
4.8 Conclusion ... 35
5. The geographical distribution of Hate Crime in Suffolk ... 37
5.1 Introduction ... 37
5.2 Geographical distribution of Hate Crime across Suffolk ... 38
5.3 Geographical distribution of Hate Crime across Suffolk by lower super output areas ... 39
5.4 Hate Crime, deprivation and geographical location ... 43
5.5 The Relationship between the Geography of Hate Crime and Ethnicity .. 43
5.6 Changes over Time in the Spatial Distribution of Hate Crime ... 44
5.7 Modus operandi analysis ... 45
5.8 Conclusion ... 46
6. The enforcement and support needs of victims of Hate Crime ... 48
6.1 Introduction ... 49
6.2 Awareness of support organisations across Suffolk ... 49
6.3 Likelihood of contacting agencies for assistance/support ... 51
6.4 The attributes of organisations which provide services to victims of Hate Crime ... 52
6.5 Communication with individuals about Hate Crime services ... 55
6.6 Anonymous reporting ... 55
6.7 Ways to report Hate Crime... 55
6.8 Expectations of the police in response to Hate Crime ... 58
6.9 The specific needs of vulnerable communities... 61
6.10 Gaps in existing provision ... 62
7. Recommendations ... 64
7.1 Framework for generic Hate Crime Service provision ... 64
7.2 Hate Crime Services Performance Framework ... 65
References ... 68
Appendix 1 - The different service needs of communities vulnerable to Hate Crime ... 77
List of Figures
Figure 3.1: Trends in Recorded Hate Crime and Hate Crime and Incidents by
Quarter Year 2005 – 2012 11
Figure 3.2: Trend Analysis of Suffolk Police Recorded Hate Crimes Data
2005-2012 by Crime Type 12
Figure 3.3: Trend Analysis of Suffolk Police Recorded Hate Crimes Data
2005-2012 by Hate Component 14
Figure 3.4: Prejudice Related Incidents in Suffolk Schools 2009/2010 to
2011/2012 16
Figure 3.5: Comparison of Most Similar Police Forces: Ranked by Rate of Hate Crimes (per 100,000) Stacked by Crime Equality Strand for One
Combined Year (2009 & 2010/2) 18
Figure 4.1: Estimated under-reporting of Hate Crime in Suffolk: Police recorded Hate Crime uplift (2011-12) using published research 22
Figure 4.2: Suffolk Hate Crime Survey: Levels of reporting and non-reporting of
Hate Crimes by incident types 23
Figure 4.3: Suffolk Hate Crime Survey: Reasons for non-reporting of Hate
Crimes to the police by percentage of respondents 29
Figure 5.1: The geographical distribution of Hate Crime across Suffolk
(2005-2012) 38
Figure 5.2: The spatial location of the top twenty LSOA's for Hate Crime in
Suffolk (2005-2012) 41
Figure 5.3: Changes in the geographical Location of Hate Crime between 2005
and 2012 in two year time periods 44
Figure 5.4: Cluster of Hate Crime modus operandi descriptions based on police
data for 2005 to 2012. 46
Figure 6.1: Suffolk Hate Crime Survey – Favoured organisational attributes
(based on response count) 54
Figure 6.2: Suffolk Hate Crime Survey – Options for communicating about Hate
Figure 6.3: Suffolk Hate Crime Survey – Options for reporting Hate Crimes 57
List of Tables
Table 3.1: Suffolk Survey: Hate Crime incident types reported by victims
and witnesses 13
Table 3.2: Suffolk Survey: Frequency of Hate Crimes reported by victims
and witnesses 17
Table 4.1: Factors influencing the reporting of crime to the police: The
effects of social context 34
Table 5.1: Concentrations of Hate Crimes by lower super output area
(2005-2012) 39
Table 5.2: The Top 20 LSOA areas for Hate Crime incidents (2005-2012) 42
Table 6.1: Suffolk Hate Crime Survey - Awareness of organisations that
work with communities vulnerable to Hate Crime 50
Table 6.2: Suffolk Hate Crime Survey – Actions that respondents expected
the police to take in relation to different types of Hate Crimes 58
Table 6.3: Suffolk Constabulary – Referrals for additional Hate Crime
support January to February 2013 61
Table 6.4: A summary of the specific support needs of individuals from
different vulnerable communities 62
Table 7.1: Proposed framework for Hate Crime Service provision 65
Table 7.2: Hate Crime Services Performance Framework 66
Table A1.1: Service planning framework for Hate Crime victims based on
i
Executive Summary
This research project was commissioned by the Suffolk Hate Crime Partnership with funding allocated to them from the Ministry of Justice. The aim of the project was to provide independent evidence of: the prevalence of Hate Crime in Suffolk; and the needs of victims and communities affected by Hate Crime across the victimisation themes of race, allegiance to a faith, sexuality, gender identity and disability.
For this project, Hate Crime1 encompasses both hate incidents and Hate Crimes as
defined by the Association of Chief Police Officers relating to race, faith, sexual orientation, gender identity and disability.
The methodology included: a literature review and documentary analysis; analysis of reported Hate Crime and estimating unreported Hate Crime; survey of communities vulnerable to Hate Crime; interviews and focus groups with individuals from communities vulnerable to Hate Crime; interviews with representatives from local agencies and a workshop with representatives from local agencies. Findings from the survey, interviews, focus group and workshop findings should be treated with caution given the relatively small sample of individuals involved. The quantitative data used in the study was affected by the quality and consistency of recording.
This summary draws together the key findings from the study and three recommendations for local agencies to implement.
The prevalence of Hate Crime in Suffolk
• Suffolk shows the highest rates of police recorded Hate Crime (per 100,000 population) when compared to the other seven police forces in the Most Similar Force Areas group (2009-10 - ACPO data). The fact that incidents of Hate Crime are notoriously under reported suggests that the police and other agencies in Suffolk have encouraged higher reporting levels than comparable police forces.
• There is considerable variability in police recorded Hate Crimes between 2005 and 2012 in Suffolk. The peaks in the third quarter of 2009 and second quarter of 2010 appear to coincide with the establishment of the Suffolk Hate Crime Service and the rapid decline in subsequent quarters with reduced staffing at the Service.
• ‘Insults and harassment' constitutes more than half (53.8 per cent) of all police recorded Hate Crimes, then; 'physical assaults' (22.1 per cent) or ‘property related offences’ (14.2 per cent), based on data from 2005 to 2012.
1
ii
The reporting and non-reporting of Hate Crime in Suffolk
• The Suffolk Hate Crime Survey undertaken for this study shows that non-reporting of Hate Crime in Suffolk varies by incident type from 54 per cent for more serious incidents to 89 per cent for less serious incidents.
• However, the non-reporting of Hate Crime needs to be considered against the context of non-reporting of all crime. The British Crime Survey (2010/11) found that 62 per cent of all volume crimes (such as burglary and vehicle related crime) were not reported to the police.
• Using the British Crime Survey (2006-11) and other studies, it has been
estimated that police recorded Hate Crime for Suffolk is under-estimated by up to 74 per cent. However, this estimate should be treated with caution as the comparably high levels of recorded Hate Crime in Suffolk compared to other similar police force areas indicates that the level of non-reporting may be lower than this estimate may suggest.
• The Suffolk Hate Crime Survey found that the main reasons for non-reporting Hate Crime to the police were: perceived seriousness of the incident; perceived attitude of the police; incidents were a common occurrence and therefore normalised; the efficacy of the police in dealing with incidents and their willingness to act; and fear of reprisal.
• The primary reason given for non-reporting of Hate Crime to the police by the Gypsy Traveller community was their families had talked them out of reporting it.
The geographical distribution of Hate Crime across Suffolk
• Hate Crimes which occurred between 2005 and 2012 were concentrated throughout the urban centres in Suffolk, notably Ipswich, Bury St. Edmunds, Lowestoft, Newmarket and Sudbury.
• 10 per cent of all Hate Crime across Suffolk took place in one lower super output area (LSOA) in Ipswich. LSOA's provide sub-ward geography averaging approximately 1,500 people.2
• Over a third (34 per cent) of all Hate Crime in Suffolk took place in twenty LSOA's which equates to less than 5 per cent of the 426 LSOA's in Suffolk • Hate Crimes tend to occur in LSOA's with multiple deprivation and high crime.
2
iii
The enforcement and support needs of victims of Hate Crime
• Suffolk Hate Crime Survey respondents indicated that the agencies they were most likely to contact to seek assistance with Hate Crime were (in rank order), the police, Ipswich and Suffolk Council for Racial Equality and their Doctor/GP. For those choosing the police and Doctor/GP, the primary reason given was that they had previously received assistance from them in relation to Hate Crime and other matters. For ISCRE, the reason was that they would “understand what I’m going through”.
• The most popular organisational attributes chosen by Suffolk Hate Crime Survey respondents were: understanding the individual’s needs and those of their community; can act quickly; can take action against the perpetrators. • Survey respondents wanted to be informed about Hate Crime Services through
‘traditional’ means such as: leaflets to the home, local newspapers and through community groups and meetings.
• The survey findings suggested a tension between individuals wishing to report Hate Crimes anonymously (i.e. not disclose their identity to the police) and their desire for firm action by the police, which could only occur if their identity was disclosed to the police.
• Survey respondents preferred to report Hate Crime by speaking to someone in person or by telephone rather than by text or email.
• Survey respondents expected the police to catch and convict perpetrators for all Hate Crime although there was a lowered expectation in relation to less serious Hate Crime. This suggests a need by police and other agencies to carefully manage the expectations of victims in relation to outcomes that can be realistically achieved.
• The survey findings indicate there may be an inverse relationship (in
respondents’ expectations of the police) between the police taking firm action and the sensitivity with which they handle the case.
• Victims of Hate Crime have generic support needs, however they also have support needs which are specific to their community group, such as language support for individuals from black and minority ethnic communities; support which recognises that there may not be family support for individuals from lesbian, gay, bisexual and transgendered communities; and that for people with disabilities, perpetrators are commonly women and someone close to them, such as a carer and/or family member.
• Agency interview findings indicate that there is a need to develop an integrated Hate Crime service provision which plays to the strengths of different agencies. • Agency interview findings supported by survey, interview and focus group
findings suggests the need to streamline the provision of services to victims by providing a case management/case co-ordination function to broker
iv
Recommendations
It is recommended that the Suffolk Hate Crime Partnership work with its public, private and voluntary and community sector partners to:
1. Implement a framework for generic Hate Crime Service provision which covers the following stages in the Hate Crime ‘service process’: pre-incident; pre-reporting to the police; reporting to the police; criminal justice system (from a report being taken by the police to the final outcome); post criminal justice system (i.e. after the final outcome)
2. Agree appropriate performance metrics which all the agencies involved in delivering Hate Crime services in Suffolk should adopt to achieve the following key objectives:
• Increase the awareness of Hate Crime in the community as a whole.
• Encourage and support victims of Hate Crime in making an informed decision about reporting.
• Provide effective support to victims throughout the criminal justice process. • Establish a common and consistent reporting process and procedure for
reporting across all agencies.
• Establish a single consistent approach to the case management of a Hate Crime cases based on complexity of the victims needs
• Pilot an effective counselling service for victims of Hate Crime • Establish effective and consistent partnership working
• Establish an effective buddies scheme
• Increase understanding of Hate Crime amongst children and young people
1
1.
Introduction
1.1
The research project
This research project was commissioned by the Suffolk Hate Crime Partnership with funding allocated to them from the Ministry of Justice. The aim of the project was to provide independent evidence of:
• The prevalence of Hate Crime in Suffolk • The needs of victims
• The support needs of communities affected by Hate Crime
For this project, Hate Crime3 encompasses both hate incidents and Hate Crimes as
defined by the Association of Chief Police Officers relating to race, faith, sexual orientation, gender identity and disability.
A Hate Incident is: ‘Any incident, which may or may not constitute a criminal offence, which is perceived by the victim or any other person, as being motivated by prejudice or hate.’
A Hate Crime is: ‘Any hate incident, which constitutes a criminal offence, perceived by the victim or any other person, as being motivated by prejudice or hate.’
The objectives of the project were to:
• Identify the prevalence of Hate Crime (as prescribed for this project) in Suffolk, including reported and non-reported Hate Crime
• Identify the barriers to the reporting of Hate Crime
• Understand the support needs of victims, witnesses, their families and communities
• Make recommendations to address the identified needs of victims, witnesses, their families and communities; and under reporting
• Propose success criteria for services
As prescribed in the research specification the five Hate Crime themes which have been examined in this study are:
• Racial victimisation
• Victimisation resulting from allegiance to a faith community • Victimisation arising from sexual orientation
• Victimisation due to gender identity
• Victimisation because of disability (including, mental, physical and learning difficulties)
The intended audience for this research report are:
• Decision makers in Suffolk including commissioners
3
2
• Decision makers in statutory, voluntary and community sectors including housing providers
• Private sector organisations, in particular in relation to the impact of Hate Crime on business
The key purpose of this report is to identify key operational issues which can be taken forward by local agencies in Suffolk to improve the delivery of Hate Crime services to victims and communities which are vulnerable to Hate Crime.
1.2
The local context
There are four key organisations which are leading the development of services to address Hate Crime in Suffolk.
Suffolk Hate Crime Partnership
The Partnership is hosted by Ipswich and Suffolk Council for Racial Equality (ISCRE) and comprises representation from the following agencies:
• Avenues Group4 (formerly known as Optua) • JIMAS5
• Victim Support
• Suffolk Lesbian, Gay, Bisexual and Transgender (LGBT) Network6 • OneVoice4Travellers7
• Suffolk Constabulary8
• The Suffolk Hate Crime Service
Suffolk Hate Crime Service
Following a public consultation process, ‘Talk about Telling,’ in June 2009, Suffolk Constabulary and Suffolk County Council worked collaboratively to develop the Suffolk Hate Crime Service. The Suffolk Hate Crime Service was set up in 2009 and is jointly funded by Suffolk Constabulary and Suffolk County Council. Co-location of the Suffolk Hate Crime service team took take place in early 2010.
Suffolk Constabulary
Work on Hate Crime within Suffolk Constabulary is guided by the Diversity Team and is operationalized through the neighbourhood policing teams.
Suffolk County Council
The county council supported the establishment of the Suffolk Hate Crime Service and encouraged the engagement of other agencies in tackling Hate Crime across the county.
4
A user-led Disability charity
5
A National Muslim charity set up to benefit all sectors of the community
6
Comprising of 4 groups: Men’s, Women’s, Transgender and LikeMinds addressing Mental Health issues
7
A regional charity representing the Gypsy Traveller Community
8
3
1.3
National context
In March 2012 the coalition government produced a new three year action plan for Hate Crime, ‘Challenge it, Report it, Stop it: The Government’s Plan to Tackle Hate Crime’. Contained within is an explicit commitment to improving the reporting and recording of Hate Crimes as well as improving victim’s access to support services. The coalition government clearly envisions that having better quality information will lead to
improvements in the current strategic and operational response to Hate Crime. The other key shift is to place greater emphasis upon local communities (including professionals and the voluntary sector) in taking the lead to tackle all Hate Crime in all its forms, with central government providing the strategic lead in this effort. This renewed focus on localism as a key component in tackling Hate Crime has implications for the future provision of services in Suffolk, as it does elsewhere in England and Wales.
1.4
Hate Crime
Hate Crimes occur against individuals or certain stigmatised groups because the
perpetrator harbours a prejudice, dislike, distrust or hatred towards that group. Often the victim will be a stranger to the perpetrator, and is usually selected on an arbitrary basis. Hate Crimes have their roots in normative, individual and societal attitudes and ideologies that can lead to intimidation, bullying, physical assault, property damage, rape and in extreme cases, murder.
Hate and bias crimes are deemed to be particularly pernicious because they can victimise not only individuals but entire communities. In doing so they are deemed to constitute a greater wrong and the offender judged of greater culpability, than otherwise motivated crimes. Furthermore, the normalisation of violence against a stigmatised group is both a pre-existing condition and an effect of that violence. Hence the conditions that exist in order for a Hate Crime to be identified create an environment which in turn is sustained by each event of Hate Crime. This can have a ripple effect, with Hate Crime also having the potential to incite community unrest and provoke retaliatory crimes (so called ‘secondary effects’).
Hate and bias crime can also be seen as constituting special concern for the criminal justice system when one considers the potential consequences of Hate Crimes for
members of victimised groups. When people are targeted because of their race, ethnicity, religion, national origin, sexual orientation or disability, they are likely to experience a range of negative emotions that engender greater psychological distress and over a longer duration from those experiencing non-biased criminal victimisation.9
There may also be an ‘attribution error’ effect in operation by victims. There is evidence to suggest that because of the processes of attribution in operation, victims are susceptible to attributing intent to harm on to all members of the perpetrators social group.10 Victims fear their attackers – who are rarely apprehended – along with fearing those they do not know
9
Craig-Henderson, K & Sloan, RL. (2003) After the Hate: Helping Psychologists Help Victims of Racist Hate Crime,
Clinical Psychology Science and Practice 10, (4), pp481-90.
10
4
but who resemble their assailants. This can have tangible and destabilising consequences such as making unwanted changes to their lives, (i.e. changing their job or moving out of the area entirely) after the ordeal.11
The above arguments demonstrate that the impacts of Hate Crime can extend well beyond the initial victim to their wider community. Those members who learn that a person was targeted because of their similar social category can also experience a number of negative reactions including fear, anger and despair,12 broadening the harm caused.
Nevertheless, there remain some ambiguities among social scientists and commentators as to which members of particular social groups are victimised by Hate Crimes the most (and whether the Hate Crime category should be extended to include women). What makes these, as with so many other debates in this area difficult to adjudicate are the notoriously low levels of Hate Crime reporting by victims. The Police estimate most racist and religious Hate Crime, and as much as 90 per cent of homophobic crime, goes
unreported.13 Furthermore, for those that do report incidents, victims are likely to exist on a ‘continuum of engagement with different agencies’. These are of course well known difficulties, and findings from this research provide further exploration of these issues.
1.5
Report structure
The qualitative and quantitative findings from the research have been drawn together from the research activities (detailed in Chapter 2 Methodology) and themed according to the research objectives detailed in 1.1. Chapter 3 examines the prevalence of Hate Crime in Suffolk based on recorded crime and other data. Chapter 4 considers the reporting and non-reporting of Hate Crime and barriers to reporting. Chapter 5, identifies the
geographical distribution of Hate Crime. Chapter 6 focusses on the needs of Hate Crime victims in Suffolk. Chapter 7 makes recommendations based on the findings including proposed “success criteria for services”.
11
Craig-Henderson, K & Sloan, RL. (2003) p485.
12
Ibid.
13
5
2.
Methodology
2.1
Research components
The research was comprised of six components:
• Component One – Literature review and documentary analysis
• Component Two – Analysis of reported Hate Crime and estimating unreported Hate Crime
• Component Three – Survey of communities vulnerable to Hate Crime. Component Four – Interviews and focus groups with individuals from communities vulnerable to Hate Crime.
• Component Five – Interviews with representatives from local agencies • Component Six – Workshop with representatives from local agencies
The fieldwork was conducted between November 2012 and March 2013.
2.2
Component One – Literature review and documentary analysis
This review has drawn evidence from a range of knowledge areas, including, criminology, social and organisational psychology, sociology, law and health related disciplines. The literature review covers research studies conducted in the United Kingdom, United States and other Western countries. The findings therefore need to be carefully considered for their applicability to Hate Crime victims in Suffolk.
A standard methodology was used in reviewing the literature. Search terms were devised and refined and searched using a number of key online databases (National Criminal Justice Reference Service (NCJRS); International Bibliography of the Social Sciences (IBSS); Sociological Abstracts; Social Science Abstracts (SocialSciAbs); Psychology Information (PsychInfo). As we wanted to look beyond the academic literature to identify relevant practitioner research and research undertaken by campaign and interest groups, there was an explicit focus upon website searches for research publications and any ‘grey literature’. The latter was searched using; the System for Information on Grey Literature (SIGLE) database; Index of conference proceedings; and Theses and dissertation
searches. In addition, hand searches were also made to good effect of bibliographies from key authored papers and reports. Studies were included in the review if they were
deemed relevant to the key research questions and objectives. The literature is also very current, with many items being published in the last five years.
2.3
Component Two – Analysis of reported Hate Crime and Unreported Hate
Crime
6
purposes of comparison, ACPO Hate Crime data across Most Similar Force Areas over a 2 year period. Hate Crime report information was not available to the research team from any of the twenty two Third Party Reporting Centres14.
Successive sweeps of the British Crime Survey (BCS) (2006-2011) now renamed The Crime Survey for England and Wales were used to estimate Hate Crime victimisation in Suffolk, and across different demographic groups.
2.4
Component Three – Survey of communities vulnerable to Hate Crime
The survey (hereafter referred to as the Suffolk Hate Crime Survey) was made available in a paper format to agencies involved in the Suffolk Hate Crime Partnership who distributed this to members of vulnerable communities. In addition, the survey was available for individuals to complete online. The online survey was promoted to vulnerable
communities by agencies involved in the Suffolk Hate Crime Partnership
194 questionnaires were partially or fully completed. 136 were completed as paper copies, 58 were entered directly on-line. In summary the demographic breakdown of respondents were as follows:
• Gender: 193 responses; 1 answer was missing. Slightly more females (53 per
cent) than males (46 per cent) completed the survey. 2 respondents (1 per cent) preferred not to say what their gender was.
• Gender identity: 174 responses. 90 per cent of respondents did not have a
different gender identity to that assigned to them at birth. 7 per cent respondents did have a different gender identity.
• Age: 192 responses. Individuals aged 25-34 and 35-44 constituted the largest
proportion of respondents (55 from each group). Those aged 65 or older made up the smallest group (11).
• Ethnicity: The largest number of respondents (72 or 39 per cent) were from the
White ethnic group (defined as White English; White Scottish; White Irish; White Northern Irish). Gypsy and Traveller respondents made up the second largest group.
• Faith: Just over one third of respondents identified as being Christians. The
second largest group were of Muslim faith (27 per cent). 20 per cent of respondents identified themselves as having no religious beliefs.
The survey was completed by respondents between the 7th January and 28th February 2013.
14
7
2.5
Component Four – Interviews and focus groups with communities
vulnerable to Hate Crime
Research participants were recruited by members of the Hate Crime Partnership based on the following criteria:
• Drawn from the vulnerable communities
• Had experience of Hate Crime as either victims, witnesses, or family members of victims
In total 40 participants were involved between (January and March 2013) comprising:
• 11 from black and minority ethnic communities • 18 from faith communities
• 6 from people with disabilities and/or representing people with disabilities
• 3 from individuals where sexual orientation was likely to be the primary cause of Hate Crime victimisation
• 2 from transgendered communities
2.6
Component Five – Interviews with representative from local agencies
Agency representatives were sampled based on their involvement in providing services to Hate Crime victims and in some cases on their involvement in providing more general support services to specific communities vulnerable to Hate Crime. These agencies were identified by the Hate Crime Partnership.
Interviews were undertaken with the following agencies:
• Suffolk Hate Crime Partnership • Suffolk Hate Crime Service • Victim Support
• Suffolk County Council • Suffolk Constabulary • ISCRE
• Avenues Group
• One Voice for Travellers • JIMAS
• Suffolk LGB and T Network
2.7
Component Six – Workshop with representatives from local agencies
A workshop was held on 20th March with 25 participants from the following public and voluntary sector agencies:
• Avenues Group (formerly known as Optua)15 • JIMAS16
15
8
• Victim Support
• OneVoice4Travellers17 • Suffolk Constabulary
• Suffolk Hate Crime Service • Suffolk Hate Crime Partnership
• Ipswich and Suffolk Council for Racial Equality • Enable Support Services
• The Befriending scheme
• Western Suffolk Community Safety Partnership • Mid Suffolk District Council
• Suffolk County Council • Genesis Orwell Mencap • Leading Lives
• Bangladeshi Support Centre
• Suffolk Inter-faith Resource (SIFRE) • Suffolk Coastal District Council • Ipswich Borough Council • Terence Higgins Trust
2.8
Limitations of the methodology
Throughout the literature review there was some variation in the quality of the evidence base and concerns over the robustness and representativeness of some material, particularly those survey designs being reliant on convenience samples. There is also a plethora of vague and often interchangeable terminology (‘abuse’, ‘violence’, ‘harassment’) which are ill-defined terms that encompass a wide range of phenomena (Moran, 2006). It should also be remembered that research undertaken by campaigning groups needs to be read with a degree of caution, as groups may privilege pursuing their own political cause at the expense of what can be legitimately derived from the findings.
A number of data quality issues were identified with the Suffolk Police data after
discussions with the Senior Performance Analyst and the Diversity Manager at Suffolk Constabulary. These are principally one of recording inaccuracy which may have led to the over-recording of some types of flagged Hate Crime by Officers. Other limitations are detailed along with the findings.
The estimate of the under-reporting of Hate Crime in Suffolk needs to be treated with caution. No standard methodology for estimating this was uncovered in the literature review. Details of the methodology employed for this can be obtained from the research team.
The survey, interviews and focus groups with individuals from vulnerable communities were affected by the following:
16
A National Muslim charity set up to benefit all sectors of the community
17
9
• Sampling of community respondents – The recruitment process (using local
agencies) and promotion of the survey and the purposive sampling of interviewees and focus group participants was intended to ensure
representation from the five communities most vulnerable to Hate Crime as set out in the research specification. It is likely that the individuals who participated had a higher level of contact and involvement with local agencies.
• Experience of community respondents to the survey, community interviews
and focus groups. As with all qualitative research, the data gathered was dependent on the availability and the willingness of individuals to participate. Therefore those who participated may have had more experience of Hate Crime and may have been more positive or negative about the experience of services in the way in which they dealt with Hate Crime. In addition the small number of interviewees/focus group attendees may have captured limited experiences of enforcement and support services.
The interviews and workshop involving representatives from local agencies were affected by the following:
• Sampling of agency respondents – The sampling of interviewees and
workshops participants was intended to ensure representation from agencies involved in providing Hate Crime services and agencies involved in providing more generic support and assistance to those communities which were most vulnerable to Hate Crime.
• Experience of agency respondents – Those agencies directly involved in
10
3.
Prevalence of Hate Crime in Suffolk
Key findings
• There is considerable variability in police recorded Hate Crimes between 2005 and 2012 in Suffolk. The peaks in the third quarter of 2009 and second quarter of 2010 and appear to coincide with the establishment of the Suffolk Hate Crime Service and the rapid decline in subsequent quarters with reduced staffing at the Service.
• ‘Insults and harassment' constitutes more than half (53.8 per cent) of all police recorded Hate Crimes, then; ‘physical assault’s (22.1 per cent) or ‘property related offences’ (14.2 per cent), based on data from 2005 to 2012.
• The Suffolk Hate Crime Partnership became operational in June 2011 in a period coinciding with an upward trend in reporting, but numbers decline sharply during the next quarter and next 6 months, recovering somewhat third quarter of 2012.
• No data has been recorded from third party reporting centres across Suffolk in order to minimise the administrative burden on the mainly small voluntary and community sector agencies.
• Suffolk shows the highest rates of police recorded Hate Crime (per 100,000 population) when compared to the other seven police forces in the Most Similar Force Areas group (2009-10 - ACPO data).
3.1
Introduction
This chapter presents findings on the prevalence of Hate Crime in Suffolk examining:
• Overall Hate Crime Trends based on police recorded crime data.
• The types of Hate Crime offences/incidents taking place in Suffolk based on police recorded crime data and survey responses from victims and witnesses. • The extent of Hate Crimes directed at vulnerable communities based on the five
equality strands of: race; faith; sexuality; transgendered; disability; using police recorded crime data and incidents recorded by Suffolk schools for three of these five equality strands.
• Frequency of Hate Crimes based on data from the Suffolk Hate Crime Survey. • A comparison of police recorded Hate Crimes in Suffolk with incidents recorded
by forces in the Most Similar Group.
3.2
Overall Hate Crime Trends: Suffolk Police Data
Examining Hate Crime over time (from 2005 and into 2012) there were 4,030 (77 per cent) recorded Hate Crimes, and 1,196 Hate Crime incidents (nearly 23 per cent). These
11
Figure 3.1: Trends in Recorded Hate Crime and Hate Crime and Incidents by Quarter Year 2005 – 2012
There is considerable variability in the trend line for Hate Crimes, and Hate Crimes peak in the second quarter of 2009 (n=227) and the second quarter of 2010 (n=226) with both calendar years seeing the highest percentage of reported offences (17.2 per cent and 17.6 per cent respectively compared to an average of 12 per cent over the other three
remaining calendar years) after which rapid declines can be observed in the ensuing quarters, whereupon the number stabilise.
The Suffolk Hate Crime Partnership became operational in early June 2011, a period which coincides with an upward trend in reporting of Hate Crimes/incidents, although numbers decline quite sharply in the next quarter and over the next 6 months, only to recover somewhat in the third quarter of 2012. However, the numbers reported during this period are lower than those during the peak periods detailed above, i.e. before the
Partnership commenced.
The current trend in Hate Crimes during the third quarter of 2012 is an increase in reported offences and incidents.
3.3
Types of Hate Crime Offences occurring in Suffolk
Figure 3.2 shows the number of reported types of Hate Crimes, over the full 30 quarters for which there was data. These have been derived for purposes of analysis by
12
Figure 3.2: Trend Analysis of Suffolk Police Recorded Hate Crimes Data 2005-2012 by Crime Type
The most common type of Hate Crime takes the form of 'insults and harassment' which constitutes more than half of (53.8 per cent; n=2167) of all police recorded Hate Crimes in Suffolk (over the total period for which data is available).
Numbers of 'insults and harassment' are at their lowest during the beginning of 2006, but increase by a third (38.7 per cent; n=+91) from 2008 to 2009, increase again the following year (19 per cent in 2010) and fall back by a similar amount (21 per cent n=-82) from 2010 to 2011.
The remaining bulk of Hate Crime is constituted by some form of physical assaults (22.1 per cent; n=889) or property related offences/vandalism (14.2 per cent; n=570). Property related offences show continued rises from 2007 (taken as a calendar year) by over 34.5 per cent; n=+19) from 2007 to 2008, and again by a similar figure (30 per cent; n=+22) into the ensuing year. The third quarter of 2008 sees the steepest rise and decline again in late 2009, after which prevalence shows some stability, with a modest fall (nearly 8 per cent; n+-8) 2010 to 2011, although numbers remain small.
13 The remaining four categorised Hate Crime types (‘Threat of violence’; ‘Sexual offences’; ‘Robbery/theft from person’; and ‘Other’) constitute some 10 per cent of overall Hate Crime.
Threats of violence (2 per cent of all Hate Crime) were far rarer than categorised physical assaults and categorised insults and harassment.
There were marked increases in Hate related sexual offences, with a quarterly rise during 2008 (n=+22) from the preceding quarter year although this is skewed by very small figures. These three quarters (2008 Q4 and 2009 Q1, Q2) constitute a spike in prevalence and see n=76 categorised sexual crimes occurring with numbers falling back sharply in the third quarter of 2009 (with the total for the remaining two quarters being n=7). The number of categorised sexual offences fluctuates after this period with smaller rises in 2010, but remaining higher overall than the very low numbers reported in 2006 and 2007.
[image:26.595.61.533.424.588.2]The identification of Hate Crime incident types by respondents to the Suffolk Hate Crime Survey (undertaken for this research project) are detailed in Table 3.1. This mirrors the distribution of recorded Hate Crime by incident type: inappropriate humour and non-physical abuse was most common (58 per cent and 49 per cent for victims and witnesses respectively); followed by physical abuse (23 per cent and 27 per cent for victims and witnesses respectively) then property related offences (22 per cent for victims and witnesses).
Table 3.1: Suffolk Survey: Hate Crime incident types reported by victims and witnesses
Incident type Been a victim Been a witness
Inappropriate humour 58% (86 of 149) 49% (73 of 149)
Non physical abuse (e.g. verbal assault, abuse by social media, text)
54% (81 of 151) 41% (62 of 151)
Physical abuse or violence 23% (31 of 137) 27% (37 of 137)
Damage to home or property 22% (32 of 146) 22% (32 of 146)
Theft/robbery 21% (30 of 143) 13% (19 of 143)
Other discrimination 28% (33 of 118) 17% (20 of 143)
3.4
Hate Element of Offences (Equality Strands Analysis where there is data)
Hate Crimes are also categorised by the manner of the hate element directed at a
particular victim group as well as the type of offence, so for instance, a threat of violence made against a person because of their disability would be categorised as a 'disabilist Hate Crime'.
14
racial and religious aggravated offences (displayed as the turquoise line and making up the bulk of Hate Crime) denote specific Home Office 'list' offences (i.e. racially or
religiously aggravated harassment etc.) whereas the other trend lines in Figure 3.3 refer to 'flagged offences', being offences which have a hate element (i.e. a theft motivated by religious hatred for instance) which do not constitute one of the racially or religiously aggravated offences but do still constitute a Hate Crime. These 'flagged' offences are recorded according to the hate component, which can be racial, faith based, or one of the other remaining equality strands. Consequently Figure 3.4 displays two slightly different types of data. These have been treated separately for analysis at the equality strand level.
The largest proportion of offences (over 61 per cent; n=2517) are recorded as 'racially or religiously aggravated offences'.
[image:27.595.57.532.373.690.2]Disabilist reported offences account for over 13 per cent (n=531) of overall offences but see very considerable increases (900 per cent) from 2007 to 2008, admittedly from a low level of 4, rising to 40. The following year sees the largest yearly increase in actual numbers flagged disabilist crimes (n=+109) equating to a 277 per cent on the previous year. The last two calendar years show a see-sawing, with a near 19 per cent decrease in 2009 – 2010 (n=-28) followed by a similar level rise in 2010-2011 (n=+19) with generally reduced quarterly numbers in 2012.
Figure 3.3: Trend Analysis of Suffolk Police Recorded Hate Crimes Data 2005-2012 by Hate Component
15 are relatively small). Thus there is an increase of n=+34 flagged sexual orientation crimes (equating to a 90 per cent increase) between 2007 and 2008, and increase more modestly the following year (41 per cent; n=+29) before seeing a similar level reduction in numbers (by over 19 per cent; n=-19).
There is evidence that both these types of hate offences have been inaccurately reported and consequently over-recorded by Suffolk Police, although the extent of this inaccuracy remains unknown.
Hate Crimes flagged as 'racist' constitute just over 10 per cent (n=414) of all Hate Crime in Suffolk, but need to be seen within the context of its larger category of Race and
Religiously aggravated offences.
The remaining faith and also transgender Hate Crimes account for under 3 per cent (n=47 and n=59 respectively) of the total. There are small rises in numbers of reported cases during the fourth quarter of 2008 for both transgender and faith Hate Crime, and the second quarter in 2009 for faith Hate Crime and first quarter in 2012 for transgender, although these figures remain small.
3.5
Prejudice Related Incidents Occurring in Suffolk Schools
'Prejudice related incidents' occurring within Schools in Suffolk aggregates incidents of prejudiced related harassment and includes behaviour such as teasing and bullying, (verbal, written, or cyber) physical intimidation or coercion, extortion, theft/damage of property where 'there is perceived to be, either wholly or partly, a motive, which is racist, disability related or homophobic'.18 As with Hate incidents more generally, these do not necessarily constitute criminal offences, and when taking place within the Suffolk school system are handled in accordance with the individual schools Behaviour, Attendance and Anti-bullying policies and/or Equal Opportunities policy. The exception to this is where both the alleged perpetrator and victim are staff members, then the County's Procedure for Dealing with Complaints of Harassment and Bullying are followed.
Figure 3.4 displays all reported racist, homophobic and disabilist incidents over a three year period (from 2009/10 to 2011/12).19
18
Suffolk County Council (2009) Dealing with Prejudice Related Incidents in Schools Local Authority Advice and Guidance p6-7.
19
16
Figure 3.4: Prejudice Related Incidents in Suffolk Schools 2009/2010 to 2011/2012
'Prejudice related incidents' occurring within Schools in Suffolk are overwhelmingly (81 per cent; n=1515) racist in nature, with a smaller number (nearly 15 per cent; n=276) being homophobic, and a smaller number still (4 per cent; n=76) being disabilist.
Over a 3 year period (2009-2012) there has been a considerable reduction in recorded racist incidents, with the biggest fall in 2009/10 to 2010/11 of 146 per cent (n=-217) followed by a 128 per cent (n=-103) fall in 2011-12.
The research team have been advised by Suffolk Hate Crime Partnership that there was a change in the guidelines given to Suffolk schools, removing the earlier mandatory
requirement that all schools had to record hate prejudiced incidents occurring within their schools. Interviews with agency representatives indicated that this practice is now
voluntary. This reporting practice change occurred around the same time and provides the most likely explanation for the significant reductions in racial prejudice related incidents and homophobic incidents from 2009 onwards rather than a reduction in prevalence.
The overwhelming majority of prejudiced incident types are verbal in nature (88.7 per cent in 2010/11 rising to and over 95 per cent in 2011/12).
3.6
Frequency of Hate Crimes
It was not possible to assess the frequency of Hate Crimes reported to the police due to the way in which incidents are recorded.
17 per cent of all respondents (22 of 142) had experienced Hate Crime on six or more
[image:30.595.56.535.167.330.2]occasions. A detailed breakdown of frequency is provided in Table 3.2.
Table 3.2: Suffolk Survey: Frequency of Hate Crimes reported by victims and witnesses
Frequency Response percentage Response count
Once only 33% 43
2-3 times 28% 39
4-5 times 12% 17
More than 6 times 16% 22
Don’t know 15% 21
Total 100 142
3.7
Comparison of Recorded Hate Crime in Suffolk compared to Most Similar
Groups Police force areas (MSG’s)
One means of measuring the extent of recorded Hate Crime in Suffolk (and arguably the performance of the police and local agencies in encouraging and promoting Hate Crime reporting) is to compare levels of Hate Crime reporting for Suffolk constabulary with other similar police force areas. The Most Similar Groups Police force areas (MSG’s) allow fair and meaningful comparisons to be made between forces.20 In undertaking this analysis Suffolk police force is compared with seven other forces across five types of Hate Crime.
Examining the total extent of Hate Crime for two years of consecutive data (2009 to 2010) Suffolk has the second highest level of police recorded Hate Crime (after the West Mercia force) when compared to its Most Similar Groups Police force areas (MSG’s).
When the population sizes within each of the eight MSG force areas, were factored into this assessment, a different distribution emerged. Figure 3.5 shows the respective rates (per 100,000 population) for Hate Crimes reported to ACPO for the MSG forces. These are displayed ranked (here by highest racial offences) stacked with the rates of Hate Crime for each of the equality strands (with data labels where appropriate).
This shows that the Suffolk Constabulary has more police reported Hate Crime per
100,000 of its population than any of the other comparable forces. When comparing these totals across the entire eight MSG forces, Suffolk has 21.7 per cent of reported Hate Crime
20
18
[image:31.595.59.533.141.468.2](across the MSG force areas) followed by West Mercia at 17.2 per cent, and Warwickshire at 12.2 per cent, whilst the Cheshire has the lowest amount of reported Hate Crime (6.2 per cent). The fact that incidents of Hate Crime are notoriously under reported suggests that police and other agencies in Suffolk have encouraged higher reporting levels than their Most Similar Group Forces.
Figure 3.5: Comparison of Most Similar Police Forces: Ranked by Rate of Hate Crimes (per 100,000) Stacked by Crime Equality Strand for One Combined Year (2009 & 2010/2)
3.8
Third party reporting centres
Hate Crime report information was not available to the research team from any of the twenty two third party reporting centres across Suffolk. Agency interviewees indicated that this was in order to minimise the administrative burden on the mainly small voluntary and community sector (VCS) agencies which were acting as third party reporting centres.
Following the discussions which took place at the stakeholder workshop, this arrangement is being reviewed.
3.9
Conclusion
19 this data has shortcomings and provides only a partial lens in understanding the true extent of Hate Crime occurring in Suffolk. At the same time one creditable way of reading the data is that Suffolk appears to be doing better than other similar force areas in learning about Hate Crimes, which is certainly encouraging. However, more needs to be done to improve reporting and data collection in the most expeditious and feasible way. Whilst the solution to this is certainly complex, this exercise will no doubt be assisted when a new IT system (Project Athena) is adopted by Suffolk police. This will overcome some existing limitations of the current IT system (including being able to identify repeat victimisation and cross border repeats) and hence help inform policy at the local level.
Examining police recorded Hate Crime by the different equality strands has shown some sharp fluctuations in victimisation and reporting. What is not known is the extent to which this reflects actual prevalence of incidents or changes in reporting behaviour due to some agency intervention, although likely the latter is most pertinent.
Perhaps the other key message coming from the data analysis is that the wide range of infrastructure in terms of the statutory and community agencies policies and procedures can facilitate or impede the reporting and recording of Hate Crime. Suffolk Hate Crime Partnership became operational in early June 2011, which coincides with an upward trend in reporting of hate incidents. There is other anecdotal evidence that the agencies work on the ground has resulted in increased reporting, and that when these activities have slowed or ceased, so to have the respondent reporting levels. This is because these agencies can bring to bear a host of 'social influence variables' (Greenburg & Ruback, 1992) which can positively influence reporting behaviour, including reporting those less serious
offences such as insults and harassment which traditionally suffer some of the highest levels of under reporting.
20
4.
Reporting and non-reporting of Hate Crime and barriers to the
reporting of Hate Crime
Key findings
• Police recorded Hate Crime for Suffolk is under-estimated by up to 74 per cent. However, this estimate should be treated with caution as the comparably high levels of recorded Hate Crime in Suffolk compared to other similar police force areas indicates that the level of non-reporting may be lower than this estimate may suggest.
• Survey findings show that non-reporting of Hate Crime in Suffolk varies by incident type from 54 per cent for more serious incidents to 89 per cent for less serious incidents.
• The non-reporting of Hate Crime needs to be considered against the context of non-reporting of all crime. The British Crime Survey (2010/11) found that 62 per cent of all volume crimes were not reported to the police.
• The Suffolk Hate Crime Survey found that the main reasons for non-reporting Hate Crime to the police were: perceived seriousness of the incident; perceived attitude of the police; incidents were a common occurrence and therefore normalised; the efficacy of the police in dealing with incidents and their willingness to act; and fear of reprisal.
• The primary reason given for non-reporting of Hate Crime to the police by the Gypsy Traveller community was their families had talked them out of reporting it. • National studies undertaken in the UK show that perceived seriousness of the
incident and the attitude of the police and satisfaction with the response of the police and criminal justice agencies (in particular past experiences were important factors in influencing reporting/non-reporting of Hate Crime. • The circumstances of individual victims, immediate social context (families,
friends, local agencies) and wider social context (at a regional and national level) embodied by Government and social norms, have a critical impact on the decision making process of whether or not to report Crime and Hate Crime.
4.1
Introduction
This chapter provides the following:
• An estimate of non-reported Hate Crime in Suffolk by equality strand • An assessment of non-reported Hate Crime by incident type
• An identification of the reasons for the non-reporting of Hate Crime based on findings from the Suffolk Hate Crime survey illustrated by interview and focus group data with individuals from vulnerable communities
• An examination of the main issues relating to non-reporting of Hate Crime based on studies identified through the literature review, set within the context of non-reporting of all crime
• A framework which draws together the critical factors influencing the
21
4.2
Estimating non reported Hate Crime in Suffolk by equality strand
The following data sources and studies (based on the literature review undertaken by the research team) were used to estimate non-reported Hate Crime to the police based on equality strand:
• Race and Faith (The Crime Survey for England and Wales 2006-11) • Disability - Disability Rights Commission Scotland
• Sexual orientation - Stonewall, 2008 • Transgender - Metropolitan Police, 2009
In summary, the estimate of non-reported Hate Crime by equality strand has been made by calculating an uplift to the police recorded Hate Crime data for 2011/12 based on the published sources of Hate Crimes known and not known to the police. This is detailed in Figure 4.1. It should be noted that there is variation in the level of Hate Crimes known and not known by the police based on equality strand.
Using the estimates for these equality strands (contact the research team for more details) and with a number of caveats, police recorded Hate Crime for Suffolk could be under-estimating the figure by up to 74 per cent.
However, this estimate should be treated with caution as the comparably high levels of recorded Hate Crime in Suffolk compared to other similar police force areas (see section 3.7) indicates that the level of non-reporting may be lower than this estimate may suggest. It has not been possible to account for this.
In addition this estimate is based on the following broad assumptions:
• The source data from the published studies are representative of the country as a whole
22
Figure 4.1: Estimated under-reporting of Hate Crime in Suffolk: Police recorded Hate Crime uplift (2011-12) using published research
4.3
Reporting and non-reporting of Hate Crimes by incident type
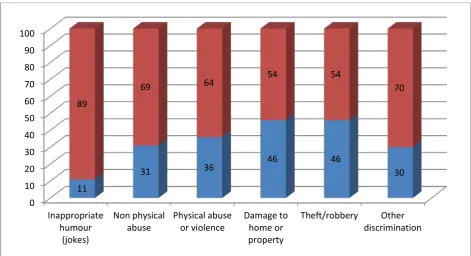
The level of reporting and non-reporting of Hate Crime to the police by incident type is detailed in Figure 4.2. This is based on responses to the Suffolk Hate Crime Survey from victims and witnesses of Hate Crime. Levels of reporting and non-reporting range from: 46 per cent reported and 54 per cent non-reported for more serious incidents of damage to the home or property and theft/robbery; to 10 per cent reported and 89 per cent non-reported for incidents of inappropriate humour. However, it should be noted that 30 per cent of victims and witnesses had also reported ‘other discrimination’ to the police, something outside of their remit.
995
642
207 261
39 346
41
144 78
8 0
200 400 600 800 1000 1200 1400 1600
Racist Faith Disability Sexual Orientation Transgender
23
Figure 4.2: Suffolk Hate Crime Survey: Levels of reporting and non-reporting of Hate Crimes by incident types
4.4
Reporting of all crime to the police
Any consideration of non-reporting of Hate Crime needs to be seen within the wider
context of low levels of reporting of volume crime more generally. It remains the case that much volume crime goes unreported. For instance, the 2010/11 British Crime Survey (BCS) findings suggest that only 38 per cent of volume crime incidents21 were reported to the police. Conversely, 62 per cent of incidents of comparable crime did not come to their attention. This represents a worsening situation from the previous 2009/10 BCS sweep, where the police came to know about 43 per cent of incidents. However, it should be remembered that these discrepancies may not simply reflect trends in reporting rates, but also police recording practices and variation within the BCS sample (Flately et al 2010:47).
What the BCS does consistently show is that the likelihood of reporting a crime varies considerably by the type of offence. Reporting rates were relatively low for crimes such as assault with minor injury or no injury, vandalism and theft from the person with only about a third of incidents being reported to the police, whereas theft of vehicles and incidents of burglary (accruing loss) were most likely to be reported (96 per cent and 82 per cent respectively). In these last cases victims are incentivised to report the incident in order to recover losses through insurance claims (requiring a crime number) which no doubt explains the higher level of reporting.
21
This refers to comparable volume crime which is a subset of crimes (such as vandalism, burglary, vehicle-related theft, bicycle theft, theft from the person, wounding, robbery, assault with minor injury and assault without injury) rather than all list offences.
0 10 20 30 40 50 60 70 80 90 100 Inappropriate humour (jokes) Non physical abuse Physical abuse or violence Damage to home or property Theft/robbery Other discrimination 11
31 36
46 46
30 89
69 64
54 54
70
24
These BCS findings are supported by other international research studies. An analysis of reasons given for non-reporting to the police in a study by Goudriaan et al22 across 16 industrialised Western nations (including the United Kingdom) also found that assaults and threats were the least frequently reported, with only slightly more than a third being
reported.
4.5
Reasons for non-reporting of Hate Crime to the police
Findings from the Suffolk Hate Crime Survey, community interviews and focus group data have identified that there were six main reasons why victims and witnesses of Hate Crimes did not report incidents to the police. These are detailed below along with illustrative
examples drawn from the free text survey responses and observations drawn from interviews and focus groups with individuals from communities vulnerable to Hate Crime.
Reason 1 - Seriousness of incidents
A third (34 per cent) of survey respondents indicated that the incident was not serious enough for them to report it to the police.
Given that the vast majority of Hate Crime discussed by the interviewees was of low severity, mainly name calling, community interviews and focus groups participants reported that they did not deem the Hate Crime incidents as serious enough to report to the police. This is illustrated by the observations from the following (different) interviewees.
"I would only report to the police if someone was hospitalised or killed"
(Community interview)
"The incident was not significant enough; if it got physical I'd have felt obliged to report it"
(Community interview)
"I would never report anything to the police, there's no point - unless I suppose it was really bad, like really extreme"
(Community interview)
However, some interviewees who had reported a non-serious Hate Crime to the police found it a positive experience.
"I really wanted to emphasise that, although it wasn't the most serious Hate Crime, my experience of reporting it to the police and the follow up I received was really very good and it has given me a lot of confidence"
(Community Interview)
22
25
Reason 2 - Perceived attitude of the police
Almost a third (29 per cent) of survey respondents indicated that the police would not take the report seriously.
This is illustrated by the following response along with a perception that if the respondent was to take action to protect themselves, the police would take action against them.
“It is a waste of time reporting to them [the police], they don’t act and when you take measures to protect yourself, they arrest you and jail you.”
(Survey respondent)
The interview findings also indicate that the attitude of the police is a barrier to reporting.
"When I reported the second time, to a female officer at the station, I was told to 'go home and get on with it'."
(Community interview)
"And the Police Officer that went along, he said, well, 'It is his very first crime, it's like nicking a loaf of bread isn't it?' Well I thought; hang on, what about zero tolerance of crime? If you are sending a message out to a 14 year old, the message is that it really doesn’t matter does it?"
(Community interview)
However, these experiences contrast with those of other interviewees who found that the police had taken the reported Hate Crime seriously.
“I was taken very seriously, especially considering there was no violence. We were not physically harmed and I know that is not a measure of severity, but it also an aggravating factor isn’t it?”
(Community Interview)
"I was really impressed with how they were and that they took it seriously…"
(Community Interview)
Reason 3 - Incidents were a common occurrence
28 per cent of survey respondents indicated that Hate Crime was a common (normalised) event and something that just happens.
This is illustrated by the following account, along with an additional barrier of being unable to identify the perpetrator.
“These are occurrences when people fall over my white cane and then turn and have a go at me. I know this is a mix of their general ignorance and
26
until I am over it. Being sight-impaired, I am not in a position to see who the aggressor is.”
(Survey respondent)
The normalisation and acceptance of Hate Crime as a part of life was confirmed by the interview data as illustrated by the following observation.
"When you have been caring for someone who is special for a long while, well it's 'par-for-the-course'. Sounds sad but true, but you are almost conditioned to learn to live with it"
(Learning disability family carer)
Reason 4 - Efficacy of the police and perceived willingness of the police to act
One in five (20 per cent) of survey respondents indicated that there was nothing that the police could do.
This was supported by many interviewees, some who had previously reported Hate Crime incidents to the police on previous occasions reflected that given their experience, they would not report again, given that they did not see any action taken on the report that was made. This is illustrated by the following observations:
"What would be the point [of reporting Hate Crime again]? They [the police] are not going to do anything"
(Community interview)
"We don't ring the police anymore - they just come out, we may get a victim Support letter now and again, but the police do nothing, so have stopped reporting it"
(Community interview)
"There is no point reporting Hate Crime if nothing happens, it’s a waste of time. All we got were promises"
(Community interview)
These experiences of the perceived willingness of the police to act, contrasts with other interviewees.
"I do think it speaks volumes- that when I reported it to the Police I had confidence that the officer would take it seriously and do a good job. So it's a subjective test really and because of that I would report again and do you know what if it hadn't have been ok, I wouldn't report again, well it would make it harder without confidence in the process"
27 One of the issues identified through the interview data linked to police efficacy was the perceived speed of the police response.
"I believe that even if we rang up to say someone was going to break in - it would take them [the Police] hours to get here anyway."
(Community interview)
This experience contrasted with that of other interviewees.
"They were really good, they sent somebody around, it was a bit late, but they sent somebody round. So the incident happened maybe at 7 o'clock at night and they, maybe came around about 11 o'clock at night"
(Community Interview)
Reason 5 - Fear of reprisal
16 per cent of survey respondents indicated that they