Review Article
Cardiovascular Control during Exercise in
Type 2 Diabetes Mellitus
Simon Green,
1,2Mikel Egaña,
3J. Chris Baldi,
4Regis Lamberts,
5and Judith G. Regensteiner
61School of Science and Health, University of Western Sydney, Sydney, NSW 2751, Australia
2Neuroscience Research Australia, Sydney, NSW 2751, Australia
3Department of Physiology, School of Medicine, Trinity College Dublin, Dublin 1, Ireland
4Department of Medicine, University of Otago, Dunedin, Otago 9054, New Zealand
5Department of Physiology-HeartOtago, University of Otago, Dunedin, Otago 9054, New Zealand
6Division of General Internal Medicine, Center for Women’s Health Research, Department of Medicine, School of Medicine,
University of Colorado, Denver, CO 80210, USA
Correspondence should be addressed to Simon Green; simon.green@uws.edu.au
Received 22 January 2015; Accepted 17 March 2015
Academic Editor: Raffaele Marfella
Copyright © 2015 Simon Green et al. This is an open access article distributed under the Creative Commons Attribution License, which permits unrestricted use, distribution, and reproduction in any medium, provided the original work is properly cited.
Controlled studies of male and female subjects with type 2 diabetes mellitus (DM) of short duration (∼3–5 years) show that DM
reduces peakVȮ 2(L⋅min−1and mL⋅kg−1⋅min−1) by an average of 12–15% and induces a greater slowing of the dynamic response of
pulmonaryVȮ 2during submaximal exercise. These effects occur in individuals less than 60 years of age but are reduced or absent in
older males and are consistently associated with significant increases in the exercise pressor response despite normal resting blood pressure. This exaggerated pressor response, evidence of exertional hypertension in DM, is manifest during moderate submaximal exercise and coincides with a more constrained vasodilation in contracting muscles. Maximum vasodilation during contractions involving single muscle groups is reduced by DM, and the dynamic response of vasodilation during submaximal contractions is
slowed. Such vascular constraint most likely contributes to exertional hypertension, impairs dynamic and peakVȮ 2responses,
and reduces exercise tolerance. There is a need to establish the effect of DM on dynamic aspects of vascular control in skeletal muscle during whole-body exercise and to clarify contributions of altered cardiovascular control and increased arterial stiffness to exertional hypertension.
1. Introduction
Type 2 diabetes mellitus (DM) results in a loss of car-diorespiratory fitness and exercise tolerance and accentuates the blood pressure response during exercise. Understanding the physiological changes underlying these altered exercise responses is important to the design of therapeutic inter-ventions aimed at helping individuals with DM increase their physical activity levels and fitness and reduce their cardiovascular risk [1, 2]. In recent years, reviews have been written about exercise and cardiovascular function in DM [1, 2]. However, none of these reviews interpreted the available evidence within a context of cardiovascular control during exercise, and doing so provides a different insight into mechanisms underlying exercise intolerance and associated cardiovascular consequences of DM.
In this review, we introduce a simplified conceptual model of cardiovascular control during exercise before reviewing the effects of diabetes on time- and intensity-dependent features of cardiovascular control during exercise. In doing so, we also explore the interactions between car-diovascular responses and oxygen uptake (VȮ 2) given the physiological relationships between them and the importance ofVȮ 2 to exercise tolerance, cardiorespiratory fitness, and mortality.
2. Cardiovascular Control during Exercise
The cardiovascular system is “designed” to perfuse cells of all tissues [3]. Each tissue has control over its own perfusion, or blood flow, but this “local” level of control depends upon Volume 2015, Article ID 654204, 11 pages
Mean arterial pressure Arterial stiffness
Systemic cardiovascular control
Cardiac output
Heart rate
Cardiac control
Skeletal muscle
Oxygen uptake, fatigue, and exercise tolerance Stroke volume
Contractility
Systemic arterial resistance
Vascular control
Coronary Muscle Skin Splanchnic Renal
̇
Q = ΔP/R − +
+
+
[image:2.600.132.467.71.255.2]‘‘Local” response
Figure 1: A simple conceptual model of cardiovascular control during exercise with links to oxygen uptake, fatigue, and exercise tolerance. Definitions of terms and description of most interrelationships between variables are described in the main text. The length of bidirectional
arrows indicates the relative ranges of variables: theregulatedvariable, mean arterial pressure, varies through a smaller range thancontrolled
variables such as cardiac output and systemic arterial resistance. Dashed bidirectional arrows indicate interactions between two variables. Arterial stiffness is not considered to be a part of a system of cardiovascular regulation and control, but it is influenced by this system (systemic arterial resistance) and also exerts an independent influence on mean arterial pressure.
a sufficiently high level of arterial pressure maintained by a “central control mechanism” [4, 5]. Local control of blood flow occurs within system-wideregulationof systemic arterial blood pressure. From a systems control perspective, the central regulation of blood pressure is perhaps the most important feature of the cardiovascular system because it enables the local control of blood flow to occur.
A simple, conceptual model of cardiovascular control during dynamic exercise is shown in Figure1. In this model, the regulation of blood pressure during exercise is reflected in the relatively small change in mean arterial pressure (MAP) that occurs across a wide range of work rates [6]. This regulation of MAP is effected through the control of several responses involving the heart (“cardiac control”), blood vessels (“vascular control”), and their combined effects (“systemic cardiovascular control”). Systemic cardiovascular control reflects the interactions between MAP, cardiac out-put (CO), and systemic vascular resistance (SVR). During exercise, cardiac output and SVR can be adjusted across a much larger response range compared with MAP. Cardiac output is controlled through adjustments to heart rate (HR) and stroke volume (SV) and these three variables constitute aspects of cardiac control. Systemic vascular resistance is controlled by vasodilation in some tissues (skeletal muscles, heart, and skin) and vasoconstriction in others (splanchnic region and kidneys), with the net effect being a decline in SVR. The fall in SVR during exercise is immediate, driven largely by “rapid vasodilation” in contracting muscles, which is counterbalanced by a slightly delayed rise in CO so that MAP falls transiently and then rises to a level above the resting value and proportional to the work rate [6–8]. In this way, MAP is effectively regulated through the controlled increase of cardiac output in the presence of a controlled reduction in SVR.
Blood flow through a tissue ( ̇𝑄) is proportional to the perfusion pressure (Δ𝑃) and inversely proportional to the total resistance acting across the tissue vascular bed (𝑅) ( ̇𝑄 =
Δ𝑃/𝑅). Effects of changes in coronary and skeletal muscle blood flow on contractility, SV, and motor output (fatigue, exercise tolerance) are also illustrated, as are interactions between controlled variables (e.g., HR-SV interactions). For simplicity, the model excludes potentially important influ-ences of venous capacitance, compliance, and resistances on perfusion pressure and CO [5] and it does not, for example, distinguish between respiratory and locomotor skeletal mus-cles and interactive or “competitive” effects between them or other vascular beds, such as in the skin [9,10].
3. Effect of Type 2 Diabetes Mellitus on Peak
and Dynamic Responses of Oxygen Uptake
Given the close association between cardiovascular function and pulmonaryVȮ 2, the maximum and dynamic responses of pulmonaryVȮ 2 during exercise provide insight into the scope and speed of cardiovascular control and whether or not they are affected in DM. Maximum or “peak”VȮ 2responses are generally measured at the end of a maximum graded exercise test, and in this review we refer to the “peak” value as the highest value measured during this type of test. Dynamic aspects of VȮ 2 are usually assessed during submaximal exercise at a fixed workload low enough to ensure steady-stateVȮ 2is achieved within 2-3 minutes. TheVȮ 2response during submaximal exercise consists of at least two phases and the time constant of the second phase of pulmonary oxygen uptake (VȮ 2𝜏) reflects an important dynamic aspect of the overall response.
Evidence related to the effects of DM on these peak
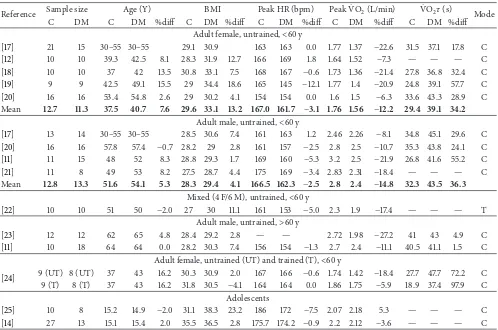
Table 1: Data from multiple studies pertaining to the effects of type 2 diabetes mellitus on peak heart rate (HR), peak oxygen uptake (VȮ 2),
and the time constant of oxygen uptake (VȮ 2𝜏). Mean values are presented and the “Mean” corresponds to the average of the mean values
from each study. “%diff ” is the percentage difference between control and diabetic subjects. C = control subjects. DM = type 2 diabetes mellitus. “Mode” of exercise testing is cycling (C) or treadmill (T).
Reference Sample size Age (Y) BMI Peak HR (bpm) PeakVȮ 2(L/min) VȮ 2𝜏(s) Mode
C DM C DM %diff C DM %diff C DM %diff C DM %diff C DM %diff
Adult female, untrained,<60 y
[17] 21 15 30–55 30–55 29.1 30.9 163 163 0.0 1.77 1.37 −22.6 31.5 37.1 17.8 C
[12] 10 10 39.3 42.5 8.1 28.3 31.9 12.7 166 169 1.8 1.64 1.52 −7.3 — — — C
[18] 10 10 37 42 13.5 30.8 33.1 7.5 168 167 −0.6 1.73 1.36 −21.4 27.8 36.8 32.4 C
[19] 9 9 42.5 49.1 15.5 29 34.4 18.6 165 145 −12.1 1.77 1.4 −20.9 24.8 39.1 57.7 C
[20] 16 16 53.4 54.8 2.6 29 30.2 4.1 154 154 0.0 1.6 1.5 −6.3 33.6 43.3 28.9 C
Mean 12.7 11.3 37.5 40.7 7.6 29.6 33.1 13.2 167.0 161.7 −3.1 1.76 1.56 −12.2 29.4 39.1 34.2
Adult male, untrained,<60 y
[17] 13 14 30–55 30–55 28.5 30.6 7.4 161 163 1.2 2.46 2.26 −8.1 34.8 45.1 29.6 C
[20] 16 16 57.8 57.4 −0.7 28.2 29 2.8 161 157 −2.5 2.8 2.5 −10.7 35.3 43.8 24.1 C
[11] 11 15 48 52 8.3 28.8 29.3 1.7 169 160 −5.3 3.2 2.5 −21.9 26.8 41.6 55.2 C
[21] 11 8 49 53 8.2 27.5 28.7 4.4 175 169 −3.4 2.83 2.31 −18.4 — — — C
Mean 12.8 13.3 51.6 54.1 5.3 28.3 29.4 4.1 166.5 162.3 −2.5 2.8 2.4 −14.8 32.3 43.5 36.3
Mixed (4 F/6 M), untrained,<60 y
[22] 10 10 51 50 −2.0 27 30 11.1 161 153 −5.0 2.3 1.9 −17.4 — — — T
Adult male, untrained,>60 y
[23] 12 12 62 65 4.8 28.4 29.2 2.8 — — 2.72 1.98 −27.2 41 43 4.9 C
[11] 10 18 64 64 0.0 28.2 30.3 7.4 156 154 −1.3 2.7 2.4 −11.1 40.5 41.1 1.5 C
Adult female, untrained (UT) and trained (T),<60 y
[24] 9 (UT) 8 (UT) 37 43 16.2 30.3 30.9 2.0 167 166 −0.6 1.74 1.42 −18.4 27.7 47.7 72.2 C
9 (T) 8 (T) 37 43 16.2 31.8 30.5 −4.1 164 164 0.0 1.86 1.75 −5.9 18.9 37.4 97.9 C
Adolescents
[25] 10 8 15.2 14.9 −2.0 31.1 38.3 23.2 186 172 −7.5 2.07 2.18 5.3 — — — C
[14] 27 13 15.1 15.4 2.0 35.5 36.5 2.8 175.7 174.2 −0.9 2.2 2.12 −3.6 — — — C
as adolescents, is shown in Table 1. The diabetes of these subjects was “uncomplicated” in that they did not have overt cardiovascular dysfunction at rest and, also, the duration of diabetes was limited to 4–6 years. Values of peak VȮ 2 have been expressed in L⋅min−1 rather than normalised to body weight (e.g., mL⋅kg−1⋅min−1) because of the bias introduced by consistently higher body weights (and BMI) of DM compared with control subjects. Most data in Table1 pertains to middle-aged subjects (∼40–60 y) in whom DM consistently reduced peakVȮ 2and increasedVȮ 2𝜏in males and females. The effect of DM was greater forVȮ 2𝜏 (34– 36%) than peak VȮ 2 (12–15%), suggesting a greater level of impairment of the dynamic compared with maximum response. Although exercise tolerance data (i.e., peak power or exercise time) are not shown in Table1, the magnitude of effect of DM on exercise tolerance (∼10–20%) is similar to its effects on peakVȮ 2. More limited data from older subjects (>60 y, males) suggest a similar effect of DM on peakVȮ 2to effects observed in younger men but show thatVȮ 2𝜏is not affected by DM. This differential effect of DM on peakVȮ 2 andVȮ 2𝜏might be attributed to a greater effect of ageing on
̇
VO2𝜏in older individuals that effectively masks the effect of DM onVȮ 2𝜏seen in younger individuals [11].
4. Effect of Diabetes on Cardiovascular
Control during Maximum Graded Exercise
4.1. Blood Pressure. The regulation of MAP during exercise
is central to cardiovascular control (Figure1) and alterations in how it is regulated might be clinically important.
Mea-surements of MAPduringmaximum graded exercise provide
important insight into how diabetes affects the regulation of blood pressure as the workload and cardiovascular strain are progressively increased towards maximum levels.
Two studies assessed arterial blood pressure (manual sphygmomanometry) at rest and during the final stage
of maximum graded exercise in adults with DM (BMI ≈
32 kg⋅m−2) and controls (BMI ≈ 26 kg⋅m−2) [12, 13].
Dif-ferences between studies included sample size (𝑛 = 20
versus 146), age (∼40 versus 54 y), sex (premenopausal women versus older men and women), and exercise mode (treadmill versus cycle ergometer). Despite these differences, resting MAP was similar between DM and controls (2 mmHg difference). By contrast, peak MAP was 10–13 mmHg (𝑃 <
increase in diastolic (9 versus 5 mmHg) and systolic (72 versus 61 mmHg) blood pressures [13]. Similar effects of DM on the maximum exercise pressor response were recently observed in adolescent male and female subjects [14].
4.2. Cardiac Output (CO) and Systemic Arterial Resistance
(SAR). The effect of DM on the maximum exercise pressor
response reflects an altered balance between the maximum rise and fall in CO and SAR (Figure1). Three studies shed light on this [12,15,16] and showed that resting CO is normal in DM but that the peak response is blunted.
The first of these studies by Roy et al. [16] showed that patients with more advanced DM and cardiac autonomic dysfunction had 15–30% lower peak CO than controls. However, interpretation of this study is undermined by inadequate description of the CO technique, lack of data concerning VȮ 2 and power output, as well as substantial differences in resting cardiac output which bias the way in which data were presented (i.e., data were normalised to resting values). More recent studies of males and females with uncomplicated DM show more modest reductions (∼5–
10%) of peak CO, where CO was assessed using the CO2
-rebreathing technique, thermodilution (pulmonary artery), and the direct Fick method [12,15].
Systemic arterial resistance is estimated from MAP and CO measurements. At rest, SAR is normal in male and female subjects with uncomplicated DM [11,12,20]. During maxi-mum graded exercise, the fall in SAR, based on direct Fick measurements of CO, was slightly lower in DM (53%) than controls (60%) [12]. Although this effect was not significant, it is of a magnitude (∼10%) that helps explain the significant effect of DM on the exercise pressor response.
4.3. Heart Rate and Stroke Volume. The blunted rise in
cardiac output during maximum graded exercise in DM must be due to a smaller increase in heart rate and/or stroke volume, and questions arise as to whether this is due to alterations in resting and/or peak responses.
At rest, HR is similar [12, 26] or up to 10% higher in uncomplicated DM [13,27] and SV is comparatively similar [12] or slightly smaller by up to 10% [27] in DM. Given that resting cardiac output is not affected by DM [11,12,19,20], these data suggest that the relative contributions of HR and SV to cardiac output can be altered in diabetes, although this is not always observed. When a reduction in resting SV has been observed, it has been associated with impairments of systolic function (e.g., low peak ejection rate) and diastolic function (e.g., slowed left ventricular filling) and a smaller circulating blood volume [27]. This latter observation is intriguing and, given the importance of blood volume to cardiovascular function during exercise, warrants further investigation.
More consistent evidence pertains to the effect of DM on peak HR (Table1) with an average reduction based on all studies of 2.5–3.1% (Table1). This, combined with higher resting HR, suggests that the scope for raising heart rate during maximum graded exercise is mildly reduced by DM. Data related to peak SV are much more limited and direct
measurements of SV during the final stage of maximum graded exercise suggest a reduction in peak SV of 4% (Fick method) or 10% (thermodilution) [12]. Collectively, these data suggest that peak responses of HR and SV are mildly blunted in DM and that they contribute to reductions in peak CO andVȮ 2.
4.4. Vascular Control. The DM-induced dampening of the
fall in systemic arterial resistance, or rise in systemic vascular conductance, during maximum graded exercise could be due to effects in one or more vascular beds involved in this response (Figure 1). There appears to be no evidence per-taining to these effects during whole-body exercise. However, the dominant influence of vasodilation in contracting skeletal muscle on this systemic response [6] raises the possibility that DM impairs vascular control in contracting muscle. Studies of isolated limb exercise shed light on this effect and insight into vascular control can be inferred from measurements of limb blood flow and, particularly, limb vascular conductance (limb blood flow/MAP).
Kiely et al. [28] studied calf blood flow and vascular conductance responses during maximum graded calf exercise in middle-aged males and females with uncomplicated DM (𝑛 = 44) and controls (𝑛 = 35). Performance on this test (i.e., peak force normalised to MVC) was reduced by 13–16% in DM men and women, similar to the effect of DM observed for whole-body exercise. Resting and peak calf blood flow and vascular conductance were lower in subjects with DM, and the maximum rise in leg vascular conductance (peak− rest) was also lower in males (14%) and females with DM (26%). Although MAP increased by 11–15 mmHg during calf exercise, it was not affected by DM.
Thus, consistent with the effect of DM on the maximum rise in systemic vascular conductance (or decline in SAR) during whole-body exercise, DM appears to blunt the max-imum response of vasodilation during exercise isolated to a small group of lower limb muscles. Potential mechanisms underlying this response are discussed in a later section.
5. Effect of Type 2 Diabetes on
Steady-State Cardiovascular Responses
during Submaximal Exercise
The effects of DM on peak cardiovascular responses during maximum graded exercise raise questions about whether or not these effects begin to appear at lower workloads. Steady-state measurements during submaximal exercise might shed light on this.
5.1. MAP. Kingwell et al. [29] measured femoral arterial
sphygmomanometry) by the fourth minute of moderate exercise (80% ventilatory threshold) was 5–10 mmHg higher in middle-aged and older subjects with DM [11, 20]. These studies demonstrate that DM evokes an increase in the pressor response during moderate exercise that is of a similar magnitude to that observed for the peak response during maximum graded exercise. This suggests that the maximum effect of DM on the pressor response is already evident at moderate workloads.
5.2. Cardiac Output, Heart Rate, and Stroke Volume. Several
studies assessed CO responses during submaximal, steady-state exercise (∼60–70% peakVȮ 2) using gas-rebreathing techniques in middle-aged and older males and females with DM and age- and sex-matched controls [11,15,19,20]. When the exercise-induced increase in CO is normalised to power output (i.e., gain of CO), data from these studies show a consistent lack of effect of DM on this response. Moreover, the gain of the HR or SV responses was similar between DM and controls [11], suggesting that their contributions to the increase in CO were not affected by DM. By contrast, recent evidence of these responses in adolescents suggests that the increases in SV and CO were blunted in DM [14]. Why this outcome differs from studies of adults is not clear, but we note that the resting blood pressure and SAR were∼10% higher than normal in the adolescents with DM, whereas this has not usually been observed in adults.
5.3. Systemic Arterial Resistance (SAR). Simultaneous
mea-surements of MAP and CO soon after the achievement of steady-state (𝑡 = 4min) during moderate exercise show that the fall in SAR [20] and rise in systemic vascular conductance [11] were blunted in middle-aged males and females with DM. Such effects cannot be attributed to the lower power outputs generated by DM subjects, because the gain of the response of systemic vascular conductance was 50% lower in DM than controls at the same relative intensity [11]. This indicates that the underlying vasodilation in contracting muscles was more constrained in DM, suggesting impaired vascular control in DM.
5.4. Limb Blood Flow and Vascular Conductance. Studies of
limb blood flow and vascular conductance (or resistance) during exercise include those which have assessed it during cycle ergometer exercise [29, 30] and isolated contractions involving a single limb [21,28,31].
Kingwell et al. [29] measured blood flow in the right femoral vein (thermodilution) during 25 minutes of supine cycle ergometer exercise (91–97 W, 60% peakVȮ 2) in diabetic and healthy men. Resting limb blood flow was not different between these groups, whereas exercise responses (𝑡= 10– 25 min) were 25% lower in DM. Arterial blood pressures were higher during exercise (but not rest) in DM and, con-sequently, the reported mean value of leg vascular resistance during exercise was 52% higher than control subjects (42.5 versus 27.9 mmHg⋅min−1⋅L−1). These data are consistent with
the effects of DM on SAR during moderate exercise and suggest that the simultaneous decrease in vascular resistance in contracting muscles is blunted in DM.
However, Kingwell et al. pointed out that this finding differed from an earlier finding of a lack of effect of DM on limb blood flow (thermodilution) under very similar exercise conditions [32], but in the upright position, and attributed this effect to differences in fitness levels between the study cohorts. Interpretation of their data should also consider a companion study that involved the same DM and control subjects [30] and provided Fick estimates of “leg” (limb)
̇
VO2. LimbVȮ 2was 15% lower in DM (0.408 L⋅min−1) than controls (0.477 L⋅min−1) despite the similar power output and pulmonaryVȮ 2, suggesting that the lower blood flow in DM is linked to a lower oxygen consumption in those muscles (thigh and leg) “sampled” by thermodilution. In this respect, the powerful hip extensors might contribute more to power output andVȮ 2in DM than controls, and blood flow to these muscles isnotassessed by thermodilution catheters placed in the femoral vein.
Problems related to the control and measurement of a submaximal workload in contracting muscles can be reduced when exercise is limited to single muscle groups. MRI measurements of CO and femoral arterial blood flow were made in eight men with DM and 11 healthy controls while they performed “low-intensity” knee extensor exercise that involved repeated lifting of a 1.5 kg weight at 1 Hz [21]. CO and femoral arterial blood flow increased significantly in both groups, but the exercise value for arterial blood flow (and not CO) was significantly lower in DM. This prompted the suggestion that the muscle hyperaemic response was more constrained in DM and unrelated to the CO response [21]. However, calculations based on their data show that the exercise-inducedchangein these responses was lower in DM for femoral arterial flow (28%) and CO (67%). In the absence of determinations of workload (power output) and the tendency (𝑃 = 0.20) for diabetic men to be shorter than control men, there remains the possibility that the power output of this exercise was relatively less for DM and it helps explain their lower muscle hyperaemic and CO responses.
A more recent study of 79 middle-aged men and women [28] reports data on responses of vascular conductance in calf muscles during low-intensity (30% MVC), intermit-tent contractions of the plantar flexors. Workloads were carefully controlled and not different between DM and control subjects, and calf blood flow was measured using venous occlusion plethysmography [33–35]. Although resting calf blood flow and vascular conductance were lower in DM than controls, exercise-induced changes in leg vas-cular conductance were not significantly lower in women (2.46 versus 3.27 mL⋅min−1⋅mmHg−1) or men (2.58 versus 2.24 mL⋅min−1⋅mmHg−1).
0 20 40 60 80 100 120 140 160 180 Time (s)
Pulmo
n
ar
y o
xyg
en u
p
ta
k
e
Control
1
2
DM
(a)
0 20 40 60 80 100 120 140 160 180
Time (s)
L
im
b
b
lo
o
d
flo
w/vas
cula
r co
nd
uc
ta
nce Control
1
2 3
DM
(b)
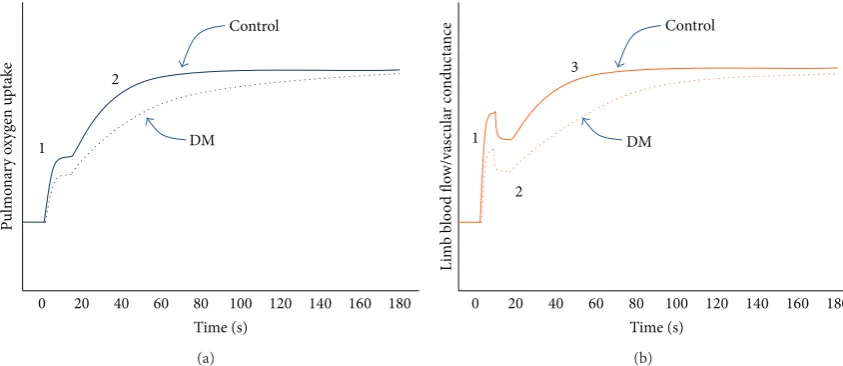
Figure 2: (a) Effect of type 2 diabetes mellitus (DM) on the dynamic response of pulmonary oxygen uptake during submaximal exercise below the ventilatory threshold. DM blunts the cardiodynamic phase (“1”) and slows the rise (increases the time constant) of the primary phase (“2”). Note that a third phase (“slow component”) is observed at higher intensities and can also be observed in a minority of subjects below the ventilatory threshold, but the effect of DM on this phase is not clear. (b) Effect of DM on the dynamic response of limb blood flow and vascular conductance during submaximal contractions (calf muscle). DM blunts the fast growth phase (“1”), has minimal effect on the rapid decay phase (“2”), and slows the rise (increases the time constant) of the slow growth phase (“3”). Note that a fourth phase, a slow decay, is observed in some subjects but it is not shown in this figure and the effect of DM on it is not clear.
6. Effect of Type 2 Diabetes Mellitus on
Dynamic
VO
̇
2and Cardiovascular Responses
during Submaximal Exercise
Steady-state measurements provide little insight into how quicklyVȮ 2 and the cardiovascular system respond at the onset of exercise. Slow adjustments in muscle blood flow and VȮ 2 can result in an altered internal metabolic state (e.g., increased [Pi], [ADP], and [H+]), membrane potential (e.g., increased interstitial [K+] and intracellular [Na+]), and contractility of contracting skeletal myocytes. These effects may result in increased muscle fatigue and blood pressure during submaximal exercise, as well as a reduction in exercise tolerance.
6.1. Oxygen Uptake. Table 1 provides compelling evidence
that DM increases VȮ 2𝜏 in men and women below the
age of∼60 years. This demonstrates that the rate at which the “primary” phase of pulmonary VȮ 2 increases towards its steady-state level is consistently slowed in these subjects with DM. This phase begins ∼15–40 s after exercise onset and is linked closely to oxygen consumption by contracting muscles [36]. Thus, the DM-induced slowing of this primary phase implies impairment of the underlying control of O2 delivery to and/or utilisation of O2by contracting muscles. The control of O2 delivery is dependent on cardiovascular control before and/or during this primary phase.
However, it is worth noting that the dynamic response of
̇
VO2is not comprehensively described by a single parameter (𝜏) of a single phase because pulmonaryVȮ 2during submax-imal exercise exhibits at least two phases, each of which can be described by more than one parameter (e.g., amplitude, time delay, and time constant) (Figure 2(a)). At the onset
of exercise, pulmonaryVȮ 2 rises rapidly within the first 1-2 breaths as a result of the abrupt increase in pulmonary blood flow. Unfortunately, this “cardiodynamic” phase, which precedes the “primary” phase, is often excluded from analysis on the basis that it has little connection with metabolic responses in contracting muscles. The recent observation that the amplitude of this cardiodynamic phase is blunted in DM [11] suggests that it is also affected by diabetes. Given that the increase in pulmonary blood flow (CO) during this phase is coupled with an increased “venous return” that is linked temporally (and probably functionally) to the rapid vasodilation and hyperaemia in contracting muscles [35,37], the DM-induced blunting of this phase points to alterations in dynamic responses of cardiac output and, perhaps more fundamentally, muscle blood flow.
6.2. Cardiac Output. In accordance with the Fick equation
for VȮ 2, the dynamic response of pulmonary VȮ 2 is the product of the dynamic responses of cardiac output ( ̇𝑄) and arterial-venous concentration difference for O2([a-vO2]) across the pulmonary circulation. Insight into the dynamics of these responses requires a temporal resolution of mea-surement similar to that provided through breath-by-breath analysis of pulmonary gas exchange (i.e.,∼2–5 s) which, to our knowledge, has not yet been achieved. Nevertheless, three studies from the same laboratory provide insight into
dynamic responses of CO and [a-vO2] using a more
tem-porally limited technique for assessing CO (SF6 plus N2 O-rebreathing) at 30 s and 240 s into cycle ergometer exercise combined with breath-by-breath measurement of pulmonary
̇
VO2throughout exercise.
These studies involved middle-aged women [19],
[image:6.600.86.508.72.255.2]men [11]. The timing of the first measurement of CO (30 s) was justified on the basis that any contribution of CO to slowing of theVȮ 2response (first and second phase) should be apparent during this period and given that the second phase was assumed to begin at∼20 s into exercise. All three studies showed a significant increase in the time constant of the second phase ofVȮ 2 in middle-aged diabetic subjects compared with controls, but in all cases the initial rise (to 30 s) and final value (240 s) of CO normalised to power output were not lower in DM subjects. These observations suggest that the rate of rise in COper sedoes not contribute to the blunted first phase or slowed second phase of pulmonary
̇
VO2. Moreover, DM did not affect the contributions of HR and SV to these changes in CO.
This normal dynamic response of CO in the presence of slowed pulmonaryVȮ 2dynamics in DM implies an altered dynamic response of pulmonary [a-vO2]. This was looked at more carefully in a recent study [11] which showed a DM-induced increase inVȮ 2𝜏in middle-aged men but not older men. Consistent with this age-dependent effect of DM was a
36%greaterincrease in pulmonary [a-vO2] by 30 s of exercise
in middle-aged DM men and no difference in this response between older DM men and controls. That pulmonary [a-vO2] was calculated from VȮ 2 and CO measurements rather than direct measurements of arterial and venous [O2] means we cannot be certain which of these concentrations is affected by DM. However, the most probable explanation relates to a lower mixed-venous [O2] and a slowed dynamic response of muscle blood flow (see below).
6.3. Mean Arterial Pressure and Systemic Vascular
Resis-tance. In this abovementioned study [11] the gain of CO
(L⋅min−1⋅W−1) during the first 30 s of exercise was similar between younger and older DM men and their age-matched
controls. However, the gain in MAP (mmHg⋅W−1) was
more than twice as great in middle-aged DM men than control subjects which meant that the calculated change in systemic vascular conductance based on changes in CO and MAP was significantly smaller in these diabetic men. This effect of DM was not observed in older men. This suggests that DM dampens the rate of increase in systemic vascular conductance during the initial 30 s of exercise in the presence of a normal response of CO, resulting in a more pronounced rise in arterial blood pressure soon after the onset of exercise.
6.4. Limb Blood Flow and Vascular Conductance. Does DM
slow the dynamic response of vasodilation and rise in vascular conductance in contracting skeletal muscles?
Recent studies of forearm [37] and calf contractions [35, 38] have helped resolve the dynamic response characteristics of limb vascular conductance during submaximal exercise. For calf exercise, the basic structure of the muscle hyperaemic response consists of two growth phases and one decay phase, and sometimes a second decay phase is observed (Figure2(b)). Slowing of the overall hyperaemic response is most likely due to slowing of one or both growth phases and two recent studies shed light on this.
In the first study involving female subjects [31], intermit-tent calf contractions were performed in an upright position, at a high intensity (70% MVC), and calf vascular conductance was described using a biphasic (growth only) function. The amplitude of the fast growth phase was 17% lower (not significant) in DM than controls, and the time constant of the slow growth phase of calf vascular conductance was three times higher in DM (𝜏 = 66versus 22 s). In a more recent
study of middle-aged men and women (total𝑛 = 69), the
dynamic response of calf vascular conductance was assessed during low-intensity (30% MVC) and high-intensity (70% MVC) contractions in the supine position, and this response was fitted to a more complex function which accounted for the presence of decay phases [28]. There was no effect of DM on any dynamic response characteristic of calf vascular conductance during low-intensity exercise, but for more intense contractions there was a significant reduction in the amplitude of the fast growth phase in DM men (21%) and women (49%) and a significant increase in the time constant of the slow growth phase in DM men (𝜏 = 29versus 14 s) and women (𝜏 = 44versus 18 s). In both of these studies, the MAP responses during exercise were unaffected by DM. These studies show that the control of vasodilation and muscle blood flow during more intense contractions of human lower limb muscles is impaired in DM and that fast and slow growth phases of the hyperaemic response are affected.
7. Mechanisms of Impaired Vascular
Control in Diabetes
This review shows that diabetes slows the dynamic response and blunts the maximum response of vasodilation in con-tracting human skeletal muscle. How this effect occurs is not clear. There is an extensive literature on DM and its effects on the vasculature as it relates to, for example, endothelial dysfunction [39], skeletal muscle in the resting state [40], and the impact of exercise training [41]. However, there is a poorer understanding of the effects of DM on vascular control during exercise.
Physiological control of vasodilation in contracting skele-tal muscle is complex and involves mechanisms of mechani-cal, neural, endothelial, metabolic, and humoral origin. In the context of DM, there has been a tendency to equate vascular dysfunction with “endothelial dysfunction” [1, 2, 29] sup-ported by evidence that DM impairs endothelial-dependent vasodilation inrestinghuman limbs [29,42]. However, DM also impairs endothelial-independent vasodilation [43] in
resting limbs and this points to the potential importance of
vascular smooth muscle and other mechanisms contributing to impaired vascular control in contracting skeletal muscle.
vasodilation during muscle contractions [45,46]. This latter effect is attributed to either an increased vascular constraint, for example, by noradrenaline [47], and/or impaired coordi-nation of ascending vasodilation from terminal to upstream arterioles and feed arteries involving intercellular coupling via gap junctions in endothelialandvascular smooth muscle cells [46, 48]. Such effects might contribute to the slowed dynamic response of muscle hyperaemia (vasodilation) in DM. In addition, animal models of diabetes studies reveal structural changes, such as arteriolar and capillary rarefac-tion, which on their own help explain the blunted maximal vasodilation in these models [49] and might help explain the effect of DM on maximal vasodilation during exercise in humans.
8. Synthesis: Cardiovascular Contributions
to Impaired Pulmonary
VO
̇
2, Exercise
Intolerance, and Exertional Hypertension
in Type 2 Diabetes Mellitus
There is compelling evidence that DM impairs the peak
and dynamic responses of pulmonary VȮ 2 (Table 1) in
younger individuals with DM. Evidence of functional cou-pling betweenVȮ 2 assessed “at the lung” and contracting skeletal muscles [36, 50, 51] implicates the latter in effects of diabetes on pulmonary VȮ 2. Recent studies provide insight into the cardiovascular contributions to these effects, although interpretation of pulmonary measurements is com-plicated by variable delays, lags, and alterations in regional arterial and venous blood flows which affect the extent of
temporal coupling between pulmonary and muscle VȮ 2
responses and their underlying Fick determinants (VȮ 2 =
̇𝑄 × [a-vO2]).
The effect of DM on peak VȮ 2 (∼12–15%) can be
attributed to a reduced peak CO and pulmonary [a-vO2]. At least half of this effect on peakVȮ 2can probably be attributed to a reduced peak CO (∼5–10%) [12, 15], heart rate (∼3%), and stroke volume (∼5%). The remaining effect appears to be linked to [a-vO2] which has been observed to be 20% lower in DM [15], although an effect has not always been observed [12]. Further studies are required to clarify the contributions of CO and [a-vO2] to the effect of DM on peakVȮ 2and, given this uncertainty, underlying mechanisms can only be speculated upon.
The reduction in peak HR might involve mechanisms involved in limiting maximum pacemaker rate, but we think this is unlikely and perhaps better reflects the reduced peak workload and other mechanisms which limit it (see below). Any reduction in peak SV might be linked to reduced cardiac contractility, greater afterload (high MAP), and/or lower preload linked to reduced muscle blood flow, venous return, and/or ventricular filling. Some of these effects might be linked to the lower circulating blood volume in DM, but more evidence is required to substantiate this effect on blood volume. The lower pulmonary [a-vO2] presumably reflects a greater mixed-venous [O2] and lower extraction of O2 in skeletal muscle. Impaired vascular control in skeletal muscle might underpin many of these effects, as outlined below in
a more integrated interpretation of effects of DM on peakand
dynamic responses of pulmonaryVȮ 2.
Compared with the effect of DM on peakVȮ 2, there is a larger effect of DM onVȮ 2𝜏 in middle-aged individuals but no effect is observed in older subjects (Table 1). This effect is associated with a greater increase in pulmonary [a-vO2] relative to VȮ 2 and CO which, in turn, reflects a lower mixed-venous [O2] and points to greater degree of perfusion-limited O2 exchange in contracting muscles [3]. Human studies and experimental models of prediabetes and diabetes provide strong evidence of impaired vasodilation in contracting skeletal muscle that is targeted at the arteriolar
network. As mitochondrial consumption of O2 begins to
rise in contracting myocytes, slowing of the vasodilation and increase in blood flow means that O2flux between capillary blood and these myocytes becomes more “flow-limited” [3], capillary PO2 will fall to a greater extent [52], and mixed-venous [O2] will be lower. Under such conditions the control
of the rise in muscle and pulmonary VȮ 2 depends more
heavily on perfusive (“O2delivery”) as opposed to diffusive (“O2utilisation”) processes and helps explain how vascular impairment might increase pulmonary [a-vO2] and VȮ 2𝜏 during submaximal exercise in DM.
How might these diabetes-induced changes in dynamic responses during submaximal exercise relate to impaired peak responses during maximal graded exercise? One pos-sibility relates to the powerful and reversible effects of perfusion on muscle contractility [53–55] at moderate and higher workloads. Acute reductions in muscle perfusion induced by body tilting lead quickly to increased muscle fatigability duringsubmaximalcontractions at forces above 30% MVC [33,56]. Similar manoeuvres during knee extensor exercise and cycle ergometer exercise slow the rise in muscle blood flow and pulmonaryVȮ 2[57,58] and, during cycling, increase electromyographic activity in thigh and leg muscles at high submaximal intensities and reduce peak heart rate, power output, and VȮ 2 by 10–20% [58–60]. Thus, slowed
dynamic responses of pulmonary VȮ 2 observed in DM
during more intense submaximal exercise (>80% VT) [18, 19] linked to increased vascular constraint in contracting muscles might reduce muscle contractility, necessitate an increased motor drive (central command) to maintain the required power output, and ultimately diminish the peak workload and heart rate achieved during a maximum graded test. In this way the slowed dynamic responses of muscle blood flow andVȮ 2during submaximal exercise contribute to the reduced peak HR,VȮ 2, and exercise tolerance. The paradoxical blunting of peak [a-vO2] might reflect an altered balance of vascular resistances and blood flows in contracting (lower flow, lower venous O2) and noncontracting tissue (higher flow, higher venous O2) in the presence of an elevated mean arterial pressure and/or a reduced mass of contracting muscle.
in DM reflects altered cardiovascular control or is simply a function of increased arterial stiffness. Increased central command and afferent input from skeletal muscles and peripheral chemoreceptors during submaximal exercise are thought to increase the operating point for blood pressure during graded exercise [6]. Whether or not such input is increased and contributes to exertional hypertension in DM is not known, but the coincidental timing of the blunted muscle hyperaemic response and increased blood pressure during the initial 30 s of exercise raises the possibility that impaired vascular control in muscle alters neural input to brainstem areas involved in cardiovascular control. It seems equally possible that the increased pressor response is due to a rapid increase in arterial inflow (i.e., CO) into a stiffer arterial system during the early period of exercise. Further investigation is required to clarify these possibilities.
9. Future Directions
Alterations to the dynamic response of hyperaemia in con-tracting muscle might be a central mechanism underlying the effects of DM on dynamic and peak responses of pulmonary
̇
VO2, exercise tolerance, and exertional hypertension during whole-body exercise. However, there is a paucity of data about dynamic responses of muscle hyperaemia during whole-body exercise and mechanisms underlying the impaired response observed during single-limb exercise. Although there is evidence of “endothelial dysfunction” in resting limbs in DM, this should not imply that it affects the control of muscle hyperaemia during exercise given the greater complexity and multiplicity of mechanisms involved. Further research is required to understand how DM impairs vascular control in contracting human muscle. Recent evidence of increased muscle sympathetic nerve activity in subjects with metabolic syndrome [61] and blunting of rapid vasodilation during calf muscle contractions in healthy subjects by activation of this response [62] suggests just one line of investigation into DM and vascular control in human skeletal muscle.
With respect to whole-body exercise, there is a lack of data about regional blood flows (in addition to contracting skeletal muscle) required to better understand how DM alters pulmonaryVȮ 2 and its Fick determinants. Assessment of dynamic responses of cardiac output, muscle blood flow, and other regional blood flows during whole-body exercise is technically challenging, and there is a need to improve the accuracy and temporal resolution of the required techniques to reveal more subtle aspects of these responses identified during single-limb exercise. Overcoming these technical lim-itations should help resolve underlying causes of exertional hypertension and clarify the relative influences of arterial stiffness and altered cardiovascular control. Simpler experi-ments might focus on clarifying the time-course of arterial pressure and cardiac output combined with assessment of the pressure waveform to establish the “dynamics” of the hypertensive response and identify the contribution of arte-rial stiffness to it. Finally, these cardiovascular consequences of DM need effective treatments given the cardiovascular risk and problem of physical inactivity associated with diabetes
and obesity. Such treatments include exercise training, diet, and pharmacotherapy, and to our knowledge the effect of such treatments on cardiovascular control during exercise has received little attention in the literature and represents a fertile area for future research.
Conflict of Interests
The authors declare that there is no conflict of interests regarding the publication of this paper.
References
[1] J. G. Regensteiner, “Type 2 diabetes mellitus and cardiovascular
exercise performance,” Reviews in Endocrine and Metabolic
Disorders, vol. 5, no. 3, pp. 269–276, 2004.
[2] J. E. B. Reusch, M. Bridenstine, and J. G. Regensteiner, “Type
2 diabetes mellitus and exercise impairment,” Reviews in
Endocrine and Metabolic Disorders, vol. 14, no. 1, pp. 77–86, 2013.
[3] J. R. Levick, An Introduction to Cardiovascular Physiology,
Arnold Publishers, London, UK, 4th edition, 2003.
[4] R. M. Berne and M. N. Levy,Cardiovascular Physiology, Mosby,
St. Louis, Mo, USA, 8th edition, 2001.
[5] J. V. Tyberg, “How changes in venous capacitance modulate
cardiac output,”Pfl¨ugers Archiv, vol. 445, no. 1, pp. 10–17, 2002.
[6] L. B. Rowell,Human Cardiovascular Control, Oxford University
Press, New York, NY, USA, 1993.
[7] R. L. H. Sprangers, K. H. Wesseling, A. L. T. Imholz, B. P. M. Impholz, and W. Wieling, “Initial blood pressure fall on stand up and exercise explained by changes in total peripheral
resistance,”Journal of Applied Physiology, vol. 70, no. 2, pp. 523–
530, 1991.
[8] W. Wieling, M. P. M. Harms, A. D. J. Ten Harkel, J. J. Van Lieshout, and R. L. H. Sprangers, “Circulatory response evoked
by a 3 s bout of dynamic leg exercise in humans,”The Journal of
Physiology, vol. 494, no. 2, pp. 601–611, 1996.
[9] J. A. Dempsey, M. Amann, L. M. Romer, and J. D. Miller, “Respiratory system determinants of peripheral fatigue and
endurance performance,”Medicine and Science in Sports and
Exercise, vol. 40, no. 3, pp. 457–461, 2008.
[10] J. Gonz´alez-Alonso, J. A. L. Calbet, and B. Nielsen, “Muscle blood flow is reduced with dehydration during prolonged
exercise in humans,”The Journal of Physiology, vol. 513, no. 3,
pp. 895–905, 1998.
[11] E. O’Connor, S. Green, C. Kiely, D. O’Shea, and M. Ega˜na, “Differential effects of age and type 2 diabetes on dynamic versus peak response of pulmonary oxygen uptake during
exercise,”Journal of Applied Physiology, 2015.
[12] J. G. Regensteiner, T. A. Bauer, J. E. B. Reusch et al., “Cardiac dysfunction during exercise in uncomplicated type 2 diabetes,” Medicine & Science in Sports & Exercise, vol. 41, no. 5, pp. 977– 984, 2009.
[13] J. A. Scott, J. S. Coombes, J. B. Prins, R. L. Leano, T. H. Marwick, and J. E. Sharman, “Patients with type 2 diabetes have exaggerated brachial and central exercise blood pressure:
rela-tion to left ventricular relative wall thickness,”American Journal
of Hypertension, vol. 21, no. 6, pp. 715–721, 2008.
[14] T. E. Pinto, S. Gusso, P. L. Hofman et al., “Systolic and dia-stolic abnormalities reduce the cardiac response to exercise in
adolescents with type 2 diabetes,”Diabetes Care, vol. 37, no. 5,
[15] J. C. Baldi, J. L. Aoina, H. C. Oxenham, W. Bagg, and R.
N. Doughty, “Reduced exercise arteriovenous O2difference in
Type 2 diabetes,”Journal of Applied Physiology, vol. 94, no. 3, pp.
1033–1038, 2003.
[16] T. M. Roy, H. R. Petterson, H. L. Snider et al., “Autonomic influence on cardiovascular performance in diabetic subjects,” The American Journal of Medicine, vol. 87, no. 4, pp. 382–388, 1989.
[17] J. G. Regensteiner, T. A. Bauer, A. G. Huebschmann et al., “Sex differences in the effects of type 2 diabetes on exercise
performance,”Medicine & Science in Sports & Exercise, vol. 47,
no. 1, pp. 58–65, 2015.
[18] J. G. Regensteiner, T. A. Bauer, J. E. B. Reusch et al., “Abnormal oxygen uptake kinetic responses in women with type II diabetes mellitus,”Journal of Applied Physiology, vol. 85, no. 1, pp. 310–317, 1998.
[19] O. MacAnaney, J. Malone, S. Warmington, D. O’Shea, S. Green, and M. Egana, “Cardiac output responses are not related to the
slowed oxygen uptake kinetics in type 2 diabetes,”Medicine and
Science in Sports and Exercise, vol. 43, no. 6, pp. 935–942, 2011. [20] E. O’Connor, C. Kiely, D. O’Shea, S. Green, and M. Egana,
“Similar level of impairment in exercise tolerance and VO2
kinetics in middle aged men and women,”American Journal of
Physiology—Regulatory and Integrative Physiology, vol. 303, pp. R70–R76, 2012.
[21] S. Lalande, S. Gusso, P. L. Hofman, and J. C. Baldi, “Reduced leg blood flow during submaximal exercise in type 2 diabetes,” Medicine & Science in Sports & Exercise, vol. 40, no. 4, pp. 612– 617, 2008.
[22] J. G. Regensteiner, J. Sippel, E. T. McFarling, E. E. Wolfel, and W. R. Hiatt, “Effects of non-insulin dependent diabetes on oxygen
consumption during treadmill exercise,”Medicine & Science in
Sports & Exercise, vol. 27, no. 5, pp. 661–667, 1995.
[23] D. P. Wilkerson, D. C. Poole, A. M. Jones et al., “Older type 2 diabetic males do not exhibit abnormal pulmonary oxygen uptake and muscle oxygen utilization dynamics during
sub-maximal cycling exercise,”American Journal of Physiology—
Regulatory Integrative and Comparative Physiology, vol. 300, no. 3, pp. R685–R692, 2011.
[24] S. L. Brandenburg, J. E. B. Reusch, T. A. Bauer, B. W. Jeffers, W. R. Hiatt, and J. G. Regensteiner, “Effects of exercise training on oxygen uptake kinetic responses in women with type 2
diabetes,”Diabetes Care, vol. 22, no. 10, pp. 1640–1646, 1999.
[25] S. Gusso, P. Hofman, S. Lalande, W. Cutfield, E. Robinson, and J. C. Baldi, “Impaired stroke volume and aerobic capacity in female adolescents with type 1 and type 2 diabetes mellitus,” Diabetologia, vol. 51, no. 7, pp. 1317–1320, 2008.
[26] J. C. Baldi, J. L. Aoina, G. A. Whalley et al., “The effect of type
2 diabetes on diastolic function,”Medicine and Science in Sports
and Exercise, vol. 38, no. 8, pp. 1384–1388, 2006.
[27] S. Lalande, P. L. Hofman, and J. C. Baldi, “Effect of reduced total blood volume on left ventricular volumes and kinetics in type 2
diabetes,”Acta Physiologica, vol. 199, no. 1, pp. 23–30, 2010.
[28] C. Kiely, E. O’Connor, D. O’Shea, S. Green, and M. Egana, “Hemodynamic responses during graded and constant-load plantar flexion exercise in middle-aged men and women with
type 2 diabetes,”Journal of Applied Physiology, vol. 117, no. 7, pp.
755–764, 2014.
[29] B. A. Kingwell, M. Formosa, M. Muhlmann, S. J. Bradley, and G. K. McConell, “Type 2 diabetic individuals have impaired
leg blood flow responses to exercise: role of
endothelium-dependent vasodilation,”Diabetes Care, vol. 26, no. 3, pp. 899–
904, 2003.
[30] B. A. Kingwell, M. Formosa, M. Muhlmann, S. J. Bradley, and G. K. McConell, “Nitric oxide synthase inhibition reduces glucose uptake during exercise in individuals with type 2 diabetes more
than in control subjects,”Diabetes, vol. 51, no. 8, pp. 2572–2580,
2002.
[31] O. MacAnaney, H. Reilly, D. O’Shea, M. Ega˜na, and S. Green, “Effect of type 2 diabetes on the dynamic response
characteris-tics of leg vascular conductance during exercise,”Diabetes and
Vascular Disease Research, vol. 8, no. 1, pp. 12–21, 2011. [32] I. K. Martin, A. Katz, and J. Wahren, “Splanchnic and muscle
metabolism during exercise in NIDDM patients,”The American
Journal of Physiology—Endocrinology and Metabolism, vol. 269, no. 3, pp. E583–E590, 1995.
[33] M. Ega˜na and S. Green, “Effect of body tilt on calf muscle
performance and blood flow in humans,”Journal of Applied
Physiology, vol. 98, no. 6, pp. 2249–2258, 2005.
[34] S. Green, R. Thorp, E. J. Reeder, J. Donnelly, and G. Fordy, “Venous occlusion plethysmography versus doppler ultrasound in the assessment of leg blood flow during calf exercise,” European Journal of Applied Physiology, vol. 111, no. 8, pp. 1889– 1900, 2011.
[35] E. J. Reeder and S. Green, “Dynamic response characteristics of hyperaemia in the human calf muscle: effect of exercise intensity
and relation to electromyographic activity,”European Journal of
Applied Physiology, vol. 112, no. 12, pp. 3997–4013, 2012. [36] B. Grassi, D. C. Poole, R. S. Richardson, D. R. Knight, B. K.
Erickson, and P. D. Wagner, “Muscle O2 uptake kinetics in
humans: implications for metabolic control,”Journal of Applied
Physiology, vol. 80, no. 3, pp. 988–998, 1996.
[37] N. R. Saunders, K. E. Pyke, and M. E. Tschakovsky, “Dynamic response characteristics of local muscle blood flow regulatory
mechanisms in human forearm exercise,” Journal of Applied
Physiology, vol. 98, no. 4, pp. 1286–1296, 2005.
[38] J. Donnelly and S. Green, “Effect of hypoxia on the dynamic response of hyperaemia in the contracting human calf muscle,” Experimental Physiology, vol. 98, no. 1, pp. 81–93, 2013. [39] W. Bakker, E. C. Eringa, P. Sipkema, and V. W. M. Van
Hinsbergh, “Endothelial dysfunction and diabetes: Roles of
hyperglycemia, impaired insulin signaling and obesity,”Cell and
Tissue Research, vol. 335, no. 1, pp. 165–189, 2009.
[40] E. J. Barrett and S. Rattigan, “Muscle perfusion: its measurement
and role in metabolic regulation,”Diabetes, vol. 61, no. 11, pp.
2661–2668, 2012.
[41] M. A. Delbin and A. J. Trask, “The diabetic vasculature: phys-iological mechanisms of dysfunction and influence of aerobic
exercise training in animal models,”Life Sciences, vol. 102, no. 1,
pp. 1–9, 2014.
[42] A. Avogaro, M. Albiero, L. Menegazzo, S. de Kreutzenberg, and G. P. Fadini, “Endothelial dysfunction in diabetes: the role of
reparatory mechanisms,”Diabetes Care, vol. 34, supplement 2,
pp. S285–S290, 2011.
[43] G. E. McVeigh, G. M. Brennan, G. D. Johnston et al., “Impaired endothelium-dependent and independent vasodila-tion in patients with Type 2 (non-insulin-dependent) diabetes
mellitus,”Diabetologia, vol. 35, no. 8, pp. 771–776, 1992.
diabetes and hypertension,” American Journal of Physiology: Heart and Circulatory Physiology, vol. 294, no. 4, pp. H1840– H1850, 2008.
[45] N. M. Novielli, B. K. Al-Khazraji, P. J. Medeiros, D. Goldman, and D. N. Jackson, “Pre-diabetes augments neuropeptide Y(1)-and alpha(1)-receptor control of basal hindlimb vascular tone
in young ZDF rats,”PLoS ONE, vol. 7, no. 10, Article ID e46659,
2012.
[46] N. M. Novielli and D. N. Jackson, “Contraction-evoked vasodi-lation and functional hyperaemia are compromised in
branch-ing skeletal muscle arterioles of young pre-diabetic mice,”Acta
Physiologica, vol. 211, no. 2, pp. 371–384, 2014.
[47] S. J. Haug and S. S. Segal, “Sympathetic neural inhibition of conducted vasodilatation along hamster feed arteries:
comple-mentary effects of𝛼1- and𝛼2-adrenoreceptor activation,”The
Journal of Physiology, vol. 563, no. 2, pp. 541–555, 2005. [48] J. W. G. E. Van Teeffelen and S. S. Segal, “Interaction between
sympathetic nerve activation and muscle fibre contraction in
resistance vessels of hamster retractor muscle,”The Journal of
Physiology, vol. 550, no. 2, pp. 563–574, 2003.
[49] W. L. Sexton, “Skeletal muscle vascular transport capacity in
diabetic rats,”Diabetes, vol. 43, no. 2, pp. 225–231, 1994.
[50] D. C. Poole, “Role of exercising muscle in slow component of
VO2,”Medicine and Science in Sports and Exercise, vol. 26, no.
11, pp. 1335–1340, 1994.
[51] H. B. Rossiter, S. A. Ward, V. L. Doyle, F. A. Howe, J. R. Griffiths,
and B. J. Whipp, “Inferences from pulmonary O2uptake with
respect to intramuscular [phosphocreatine] kinetics during
moderate exercise in humans,”The Journal of Physiology, vol.
518, no. 3, pp. 921–932, 1999.
[52] B. J. Behnke, C. A. Kindig, P. McDonough, D. C. Poole, and W. L. Sexton, “Dynamics of microvascular oxygen pressure during rest-contraction transition in skeletal muscle of diabetic
rats,”American Journal of Physiology—Heart and Circulatory
Physiology, vol. 283, no. 3, pp. H926–H932, 2002.
[53] R. Fitzpatrick, J. L. Taylor, and D. I. McCloskey, “Effects of arterial perfusion pressure on force production in working
human hand muscles,”Journal of Physiology, vol. 495, no. 3, pp.
885–891, 1996.
[54] L. Hirvonen and R. R. Sonnenschein, “Relation between blood
flow and contraction force in active skeletal muscle,”Circulation
Research, vol. 10, pp. 94–104, 1962.
[55] S. F. Hobbs and D. I. McCloskey, “Effects of blood pressure on
force production in cat and human muscle,”Journal of Applied
Physiology, vol. 63, no. 2, pp. 834–839, 1987.
[56] M. Ega˜na and S. Green, “Intensity-dependent effect of body tilt
angle on calf muscle fatigue in humans,”European Journal of
Applied Physiology, vol. 99, no. 1, pp. 1–9, 2007.
[57] M. J. Macdonald, J. K. Shoemaker, M. E. Tschakovsky, and R. L. Hughson, “Alveolar oxygen uptake and femoral artery blood flow dynamics in upright and supine leg exercise in humans,” Journal of Applied Physiology, vol. 85, no. 5, pp. 1622–1628, 1998. [58] M. Ega˜na, K. Ryan, S. A. Warmington, and S. Green, “Effect of body tilt angle on fatigue and EMG activities in lower limbs during cycling,”European Journal of Applied Physiology, vol. 108, no. 4, pp. 649–656, 2010.
[59] M. Ega˜na, S. Green, E. J. Garrigan, and S. Warmington, “Effect of posture on high-intensity constant-load cycling performance
in men and women,”European Journal of Applied Physiology,
vol. 96, no. 1, pp. 1–9, 2006.
[60] M. Ega˜na, S. Smith, and S. Green, “Revisiting the effect of posture on high-intensity constant-load cycling performance in
men and women,”European Journal of Applied Physiology, vol.
99, no. 5, pp. 495–501, 2007.
[61] J. K. Limberg, B. J. Morgan, J. J. Sebranek, L. T. Proctor, M. W. Eldridge, and W. G. Schrage, “Neural control of blood flow
during exercise in human metabolic syndrome,”Experimental
Physiology, vol. 99, no. 9, pp. 1191–1202, 2014.
[62] S. Green and E. Cameron, “Interactive effect of acute sympa-thetic activation and exercise intensity on the dynamic response characteristics of vascular conductance in the human calf
Submit your manuscripts at
http://www.hindawi.com
Stem Cells
International
Hindawi Publishing Corporation
http://www.hindawi.com Volume 2014
Hindawi Publishing Corporation
http://www.hindawi.com Volume 2014 INFLAMMATION
Hindawi Publishing Corporation
http://www.hindawi.com Volume 2014
Behavioural
Neurology
Endocrinology
International Journal of Hindawi Publishing Corporationhttp://www.hindawi.com Volume 2014 Hindawi Publishing Corporation
http://www.hindawi.com Volume 2014
Disease Markers
Hindawi Publishing Corporation
http://www.hindawi.com Volume 2014
BioMed
Research International
Oncology
Journal ofHindawi Publishing Corporation
http://www.hindawi.com Volume 2014
Hindawi Publishing Corporation
http://www.hindawi.com Volume 2014
Oxidative Medicine and Cellular Longevity Hindawi Publishing Corporation
http://www.hindawi.com Volume 2014
PPAR Research
The Scientific
World Journal
Hindawi Publishing Corporation
http://www.hindawi.com Volume 2014
Immunology Research
Hindawi Publishing Corporation
http://www.hindawi.com Volume 2014
Journal of
Obesity
Journal ofHindawi Publishing Corporation
http://www.hindawi.com Volume 2014
Hindawi Publishing Corporation
http://www.hindawi.com Volume 2014
Computational and Mathematical Methods in Medicine
Ophthalmology
Journal ofHindawi Publishing Corporation
http://www.hindawi.com Volume 2014
Diabetes Research
Journal ofHindawi Publishing Corporation
http://www.hindawi.com Volume 2014
Hindawi Publishing Corporation
http://www.hindawi.com Volume 2014
Research and Treatment
AIDS
Hindawi Publishing Corporationhttp://www.hindawi.com Volume 2014
Gastroenterology Research and Practice
Hindawi Publishing Corporation
http://www.hindawi.com Volume 2014
Parkinson’s
Disease
Evidence-Based Complementary and Alternative Medicine
Volume 2014