Dorothy Watson, Joanne Banks and Seán Lyons
July
201
5
Educational and Employment
Experiences of People with a
Disability in Ireland: An Analysis
of the National Disability Survey
RESEARCH SERIES
Educational and Employment
Experiences of People with a
Disability in Ireland: An
Analysis of the National
Disability Survey
FINAL REPORT
RESEARCH SERIES
NUMBER 41
July
2015
Dorothy Watson, Joanne Banks and Seán Lyons
Available to download from www.esri.ie
The ESRI
The Economic Research Institute was founded in Dublin in 1960, with the assistance of a grant from the Ford Foundation of New York. In 1966 the remit of the Institute was expanded to include social research, resulting in the Institute being renamed the Economic and Social Research Institute (ESRI). In 2010 the Institute entered into a strategic research alliance with Trinity College Dublin, while retaining its status as an independent research institute.
The ESRI is governed by an independent Council which acts as the board of the Institute with responsibility for guaranteeing its independence and integrity. The Institute’s research strategy is determined by the Council in association with the Director and staff. The research agenda seeks to contribute to three overarching and interconnected goals, namely, economic growth, social progress and environmental sustainability. The Institute’s research is disseminated through international and national peer reviewed journals and books, in reports and books published directly by the Institute itself and in the Institute’s working paper series. Researchers are responsible for the accuracy of their research. All ESRI books and reports are peer reviewed and these publications and the ESRI’s working papers can be downloaded from the ESRI website at www.esri.ie
The Authors
Dorothy Watson is an Associate Research Professor at the Economic and Social Research Institute and Adjunct Professor at the Department of Sociology, Trinity College Dublin. She is joint co-ordinator of research on equality and social inclusion at the ESRI.
Joanne Banks is a Research Analyst at the Economic and Social Research Institute. Her research focuses mainly on the school experiences for children with disability and special educational needs and the ways in which these students are supported in mainstream schools.
Seán Lyons is an Associate Research Professor at the Economic and Social Research Institute (ESRI) in Dublin and holds an adjunct position at Trinity College Dublin (TCD). He specialises in applied microeconomics, with a particular focus on policy modelling and regulated sectors.
Acknowledgements
Table of Contents
EXECUTIVE SUMMARY ... IX
CHAPTER 1 INTRODUCTION ... 1
1.1 Introduction ... 1
1.2 Existing Research ... 2
1.2.1 Disability and Labour Market Outcomes ... 2
1.2.2 Disability and Education ... 4
1.2.3 Consequences of Educational and Labour Market Disadvantage ... 5
1.3 An Overview of Disability Policy and Legislation ... 5
1.3.1 The Focus of Disability Policy ... 5
1.3.2 Equality Legislation ... 6
1.3.3 Services for People with a Disability ... 6
1.3.4 Non-Governmental Organisations Providing Services ... 9
1.4 Data and Methodology of this Report ... 10
1.4.1 The National Disability Survey ... 10
1.4.2 Analysis Methodology ... 12
1.5 Outline of Report ... 14
CHAPTER 2 DISABILITY AND EDUCATION ... 15
2.1 Introduction ... 15
2.2 People Affected by Disability during Education ... 16
2.3 Model for Leaving School Sooner Than Desired ... 19
2.4 Impact of Leaving School Sooner than Desired on Educational Attainment ... 22
2.5 Summary... 24
CHAPTER 3 27IMPACT OF EARLY-ONSET DISABILITY ON LABOUR MARKET OUTCOMES ... 27
3.1 Introduction ... 27
3.2 Employment and Interest in Employment ... 27
3.3 Leaving Employment Because of Disability ... 34
3.4 Summary... 39
CHAPTER 4 FACILITATING PARTICIPATION ... 41
4.1 Introduction ... 41
4.2 Devices and Services Used or Needed ... 42
4.3 Characteristics Associated with Unmet Needs... 46
4.4 Unmet Needs and Employment ... 50
4.5 Self-Reported Requirements in Order to be Able to Work ... 53
4.6 Self-Reported Requirement for a Wage Subsidy ... 54
4.7 Summary... 57
CHAPTER 5 CONCLUSIONS AND POLICY IMPLICATIONS ... 59
5.1 Introduction ... 59
5.2 Disability and Education ... 59
5.3 Disability and Employment ... 61
iv
|
E d u ca tio n al an d E mp loy m en t E xp e ri en c e s o f Peo p l e wi th a Di s ab i lity in Ir e lan d5.5 Policy Implications ... 65
5.5.1 Implications for Educational Policy ... 65
5.5.2 Implications for Lifelong Education and Training ... 66
5.5.3 Facilitating Employment of People with a Disability ... 67
5.5.4 Role of Employers ... 67
5.5.5 Financial Support for the Costs associated with Disability ... 68
5.5.6 Service Needs of People with a Disability ... 69
5.5.7 Summary of Policy Implications ... 69
L
IST OFT
ABLESTable 1.1 Distinguishing Between Learning and Intellectual Disability ... 11
Table 2.1 Education of People With and Without a Disability ... 15
Table 2.2 Whether Affected by Disability while in School by Gender, Age Group and Main Type of Disability ... 17
Table 2.3 Percentage Completing Second Level and Percentage with Each Level of Difficulty by Age Cohort ... 19
Table 2.4 Adjusted Percentage Affected During School Years and (of those Affected During School Years) Adjusted Percentage who Left School Sooner Than Desired ... 20
Table 2.5 Odds Ratios for Completing Upper Second Level or Third Level Versus Leaving School Sooner Than This ... 23
Table 3.1 Percentage at Work or Interested in Work by Gender, Age, Education and Main Disability ... 28
Table 3.2 Adjusted Percentage of Working-age people with a Disability in Employment ... 30
Table 3.3 Adjusted Percentage of Working-age people with a Disability Interested in Work if Circumstances were Right ... 33
Table 3.4 Percentage of People with a Disability Who Never Worked, Left Work or are Currently at Work ... 34
Table 3.5 Interest in Work by Whether Never Worked, Left Job because of Disability or Left Job for Another Reason ... 36
Table 3.6 Adjusted Percentage who Never Worked and who Left Work Because of Disability ... 37
Table 4.1 Devices and Services Used or Needed by People with Mobility and Dexterity Disability ... 43
Table 4.2 Devices and Services Used or Needed by People with EPMH Disability ... 44
Table 4.3 Devices and Services Used or Needed by People with Pain Disability ... 45
Table 4.4 Devices and Services Used or Needed by People with Intellectual Disability ... 45
Table 4.5 Factors Associated with Unmet Needs for Devices or Services Among Working-age People with Different Disability Types (OLS Regression Coefficients) ... 47
Table 4.6 Factors Associated with Use of Devices or Services Among Working-Age People with Different Disability Types (Regression Coefficients) ... 49
Table 4.7 Odds of Being Outside Employment vs. in Employment Among People with Different Types Of Disability Oriented To Work ... 51
Table 4.8 Percentage Requiring Services or Modifications in Order to Take Up Employment ... 53
Table 4.9 Odds Ratios for Needing a Wage Subsidy ... 55
vi
|
E d u ca tio n al an d E mp loy m en t E xp e ri en c e s o f Peo p l e wi th a Di s ab i lity in Ir e lan dTable A2.1 Odds Ratios for Education Models (1) Being Affected by Disability While in School Years and (2) Whether Left School Sooner than Desired, Conditional on Being Affected During School Years ... 74 Table A3.1 Odds Ratios for Being in Employment vs. Not in Employment (Logistic
Regression) ... 75 Table A3.2 Odds Ratios for Being in Interested vs. Not Interested in Employment Among
Those Not in Employment ... 76 Table A3.3 Odds Ratios for Having Never Worked or Having Left Work Because of
Disability or for Another Reason (versus Being Currently at Work) ... 77 Table A4.1 Tetrachoric Correlation Coefficients Among Requirements for Employment ... 78 Table A4.2 Polyserial Correlation Coefficients Among Requirements for Employment and
Glossary
ADHD Attention Deficit Hyperactivity Disorder AME Average Marginal Effect
ASD Autistic Spectrum Disorder BMW Border Midlands West BTEI Back to Education Initiative CSO Central Statistics Office
DARE Disability Access Route to Education DES Department of Education and Skills
EPMH Emotional, Psychological and Mental Health
EPSEN Education for Persons with Special Educational Needs ETBs Education and Training Boards
EU-SILC European Union, using Survey of Income and Living Conditions GAM General Allocation Model
GP General Practitioner HSE Health Service Executive
NCSE National Council for Special Education NDA National Disability Authority
NDS National Disability Survey NLN National Learning Network OLS Ordinary Least Squares PAS Personal Advocacy Service PLC Post Leaving Certificate
QNHS Quarterly National Household Survey SEN Special Educational Needs
Executive Summary
BACKGROUND
Employment is a crucial issue for people with a disability because it has a strong bearing on their economic well-being. People with a disability are more likely than the general population to be poor and depend on social welfare payments for their income. An important reason for their economic disadvantage is the difficulty they have in gaining employment or retaining employment. For policy makers to help improve well-being of people with a disability, it is vital that they understand the factors that help or hinder people with a disability who wish to gain employment, including the extent to which education plays a role in that process.
To help address some of these questions, this report draws on the rich data from the National Disability Survey (NDS) to examine the education and employment circumstances of people with a disability in Ireland. The NDS is a unique resource because of its large sample size and the in-depth information it contains. It allows us to examine how access to services or aids might have an impact on the capacity of disabled people to take up employment. Having examined these issues, we consider how policies may help address the barriers to employment identified in the analysis.
DATA AND METHODS USED
The study drew on the 2006 National Disability Survey (NDS), which included over 7,000 people of working age with a disability. The NDS contains detailed information about nine different types of disability (seeing, hearing, speech, mobility and dexterity, remembering and concentrating, intellectual or learning, emotional, psychological and mental health, pain and breathing) and on several aspects of the person’s life, including whether they were affected by their disability while in school or college or later, their work situation and their need for services and supports. We used statistical models to examine the impact of disability on educational and labour market experiences and outcomes, taking other socioeconomic factors into account where possible (e.g. type of disability, age group, gender, marital status and region).
DISABILITY AND EDUCATION
x
|
E d u cat ion a l an d E m p l oym en t E xp er i en c e s of Peo p l e wi th a Di s ab i lity in Ir e lan dat risk of poorer academic outcomes (Humphrey et al., 2013), so that they have fewer educational qualifications than non-disabled people when they leave school. This leads to a double disadvantage, where economic prospects are reduced both by disability status and by lower levels of education (NDA 2012). Most disability is acquired during the life course rather than being present at birth. Consequently, most people with a disability were not yet affected by the disability in their school years. Just 30 per cent of working-age people with a disability were affected by the disability while in education; 17 per cent of them missed some time in school because of their disability and 15 per cent left school sooner than they would have liked. Those with an intellectual or learning disability were far more likely to have been affected during their school years (92 per cent and 80 per cent, respectively).
Because disability can reduce the likelihood of staying in education, people who were already affected by a disability during their school years were less likely to complete second-level education than those whose disability emerged later. The level of educational achievement was even lower for people with intellectual or learning disability. Further detail on this analysis is shown in Chapter 2, Section 2.4.
DISABILITY AND EMPLOYMENT
Most people with a disability have worked in the past or are currently working. While only 29 per cent of our (working age) sample was currently in employment, a further 56 per cent had worked at some point in the past. In addition, nearly half of those not currently in employment said they would be interested in working if the circumstances were right. Men and women with a disability were equally likely to have been in employment at some point in the past and were equally likely to have left employment because of a disability. However, women were more likely to have left for other reasons, so that fewer women with a disability were currently in employment. This analysis is developed in Chapter 3.
Likelihood of Working
One surprising result was that, having taken account of all these characteristics, we found that those who had been affected by their disability during their school years were slightly more likely to be currently at work than those whose disability had emerged later. We had expected that people who had a disability for longer would find it harder to gain employment, but the data indicate a more complex picture. This suggests that people whose disability emerges later in life are likely to face particular challenges in remaining in employment or finding suitable employment.
Interest in Working among Those Not Currently Employed
There was a strong overlap between the characteristics of people currently at work and those who would be interested in work. Of those with a disability and not currently at work, younger adults showed particularly high interest in working. Interest was also higher among adults with third-level education, those with lower levels of difficulty associated with their disability, and among married men. Not surprisingly, the level of current interest in work was higher among those who worked in the past compared to those who never worked.
‘Labour Market Exclusion’
We use the term ‘labour market exclusion’ to refer to the situation of those who have never been in employment or have left a job because of a disability. This group is of particular concern for policy makers, because of the difficulties they are likely to face in gaining employment. Our results showed that the greatest level of labour market exclusion is experienced by those with bad health, bad stamina or with emotional, psychological and mental health (EPMH) disability. The level of exclusion was lowest among those with third-level education and those with a hearing disability.
Within the group experiencing labour market exclusion, we could identify a subgroup for whom the main challenge was in getting the first job (younger adults, people with intellectual or speech disability, people affected during their school years). Another subgroup suffering exclusion consisted of people who had left work because of their disability: older adults, people with an EPMH disability, pain disability and those with health or stamina problems. These challenges will require different policy responses.
FACTORS FACILITATING EMPLOYMENT
xii
|
E d u cat ion a l an d E mp loy m en t E xp e ri en c e s o f Peo p l e wi th a Di s ab i lity in Ir e lan dpain and intellectual disability. Nearly nine out of ten working-age people with a disability has at least one of these types of disability.
The services that were most frequently used by people with disability included physiotherapy (mobility and dexterity), psychiatric and counselling services (EPMH disability), pain management (pain) and psychology services (intellectual disability). The devices identified included walking aids (mobility and dexterity), heated massage or muscle stimulation devices (pain) and educational technology (intellectual disability).
Unmet Needs – Services or Aids
Some people with a disability may require services or aids to make it possible for them to take up employment. Findings show that unmet needs for services or devices may be a barrier to employment, but their significance as a barrier varied by type of disability. We found that unmet needs were associated with non-employment for people with mobility and dexterity disability and those with pain disability, but not for people with EPMH or intellectual disability. This might be because the kinds of services or aids involved differ in terms of their significance in facilitating employment.
Unmet Needs – Working Conditions and Wage Subsidies
We also examined a number of general supports people reported that they needed (or would need) in order to be able to work. These included: flexible work arrangements such as reduced hours (46 per cent); modified job tasks (29 per cent); accessibility modifications (32 per cent); and a wage subsidy (24 per cent). The need for flexible working arrangements was correlated with the need for a wage subsidy.
LIMITATIONS OF OUR ANALYSIS DUE TO AVAILABLE DATA
We do not have information about how individuals’ circumstances changed over time, or in relation to changes in their disability status. Information on preferences toward working, level of difficulty and the nature of the person’s need for services and devices all relate to the same point in time. When modelling these relationships we have tried to disentangle overlapping factors as far as possible. Nevertheless, in the absence of data showing how individuals’ situations changed over time, we must be cautious about drawing strong conclusions about which causes were most important in driving the effects we seek to analyse.
POLICY IMPLICATIONS
There are several policy implications arising from the findings in this report. The main ones concern (i) enabling people to remain in education, (ii) life-long education and training, (iii) support services and aids, (iv) the role of the employer, and (v) the need for income support.
Helping People Complete Their Education
Since we know that school engagement is crucial to helping people stay in education, the tendency for students with a disability to dislike school clearly needs to be addressed. A broadening of the curriculum is likely to be helpful, including greater availability of programmes such as the Junior Cycle Schools Programme and Leaving Certificate Applied Programme. The introduction of a Level 2 award under the proposed reform of the Junior Cycle should enhance the school experiences for young people with special needs for whom the traditional Junior Certificate is unsuitable. In addition, access programmes such as Disability Access Route to Education (DARE) could encourage greater numbers of these students to pursue education beyond second level.
In order to better understand the role played by factors such as stigma, health, stamina, accessibility and the suitability of the curriculum, further research is needed. The in-depth information on the lives of children available in the
Growing Up in Ireland Survey offers an opportunity to investigate these issues further.
Adult Education and Training
xiv
|
E d u c ati on al an d E m p loy m en t E xp eri en c e s o f P eo p l e wi th a Di s ab i lit y in I r elan ddisability, the high proportion leaving a job because of their disability suggests that at least a proportion of this group will need retraining for a different line of work. The recent focus by the National Council for Special Education on the needs of adult learners with a disability is likely to be very important in this regard (DES 2012).
Employment Support Services
The findings reported here from the National Disability Survey were based on data collected in 2006, before the start of the recession. The challenge of finding the first job is likely to be particularly acute for people with a disability in the context of the current high youth unemployment. The employment support services which are now the responsibility of the Department of Social Protection are likely to be especially important to this group.
Employers and Working Conditions
The results in Chapter 4 suggest that flexible working conditions, such as reduced hours, are important in enabling people with a disability to take up employment. Other requirements include modified job tasks or accessibility-related aids for people with mobility and dexterity or pain disability. There is clearly a role for employers here. Policy makers can facilitate this process by providing information on international models of good practice in making reasonable accommodation to support people with disabilities in employment. The advantage for employers is a widening of the pool of potential workers from which employers might draw. Public policy can contribute by alleviating some of the perceived risk and uncertainty involved through schemes such as the Wage Subsidy Scheme (WSS) for employers.
Aids, Supports and Services
There is also a role for public policy to act to bridge the gap between the person’s required level of income and what they are able to earn. Some form of supplemental income is likely to be particularly important to people with lower levels of education.
Chapter 1
Introduction
1.1 INTRODUCTION
The focus of this report is on the barriers and facilitators to employment experienced by people with a disability at different life stages. The 2004 National Disability Strategy sets out a programme of co-ordinated actions across government departments to support the equal participation of people with a disability in Irish society. Participation in employment is one particularly important area. This research provides new information to inform the further development of policy on this topic.
It is widely recognised that being in employment plays a crucial role in preventing poverty and in enabling poor households to move out of poverty (ILO, 2005; Caputo, 1991; OECD 1998, 2004, 2009). However, Irish and international research consistently shows that people with a disability are less likely to participate in the labour market and when they do so, are more likely to be unemployed. In explaining these labour market patterns, it is important to note that education plays a role: children and young people with disabilities also face considerable barriers in engaging in school (Douglas et al., 2012) and are more likely to be ‘at risk’ academically compared to their peers (Humphrey et al., 2013). Since the risk of poverty is higher for people with a disability (Gannon and Nolan, 2005), strategies to address their levels of income and resources are of particular significance for them. We draw on the research microdata file from the National Disability Survey to address the following research questions:
1. How many people with a disability were affected while still in school and either left before they would have liked or experienced significant absences? What are the barriers and facilitators to people with a disability remaining in the educational system?
2. How significant is early-onset (during school years) disability in limiting people’s participation in employment? Given that most disability is acquired during the life course, what are the barriers and facilitators to people remaining in employment after the onset of disability?
2
|
E d u cat ion a l an d E mp l oy m en t E xp er i en c e s of Peo p l e wi th a Di s ab i lity in Ir e lan daids and ease of access to them differ by socioeconomic factors such as age group, level of education, social support and type of disability?
This study focuses on working-age (age 18 to 64) adults with a disability. It adds to previous research by bringing together the data on educational and work experience in order to inform policy in both these areas. This will fill gaps in our existing knowledge regarding the factors influencing the skills/competencies which people with a disability bring to the labour market, and those which influence access to the labour market.
In this chapter, we examine what we have learned from existing research about the experiences of people with a disability in the labour market and in the educational system and the consequences for them. We then provide an overview of disability policy and services in Ireland before describing the data and methodology in this report. We end this chapter with an outline of how the analysis is organised in subsequent chapters.
1.2 EXISTING RESEARCH
1.2.1 Disability and Labour Market Outcomes
Existing research in Ireland and internationally has shown that people with a disability are less likely to participate in the labour market and when they do so, are more likely to be unemployed. Figures from the Central Statistics Office’s 2010 Quarterly National Household Survey (QNHS) show that 36 per cent of working-age people with a disability participated in the labour market in 2010 compared to 77 per cent of those without a disability and 22 per cent were unemployed, compared to 16 per cent of those without a disability (Watson et al., 2013). When they are employed, people with a disability are more likely to be working part-time (Greve, 2009; Watson et al., 2013). There is also a substantial demand for employment among working-age people with a disability who are not in a job at present: results from the 2006 National Disability Survey indicate that over one-third (37 per cent) would be interested in work if the circumstances were right (CSO, 2010, Table 2.19; Watson and Nolan, 2011).
or ramps. Human support, technical aids and communication aids are also identified as enabling employment. Structurally, this research points to elements in work organisation in enabling people with a disability to work, particularly given the greater numbers of adults with a disability working part-time hours compared to the general population.
Statistics from the European Union, using Survey of Income and Living Conditions (EU-SILC) data for 2007, suggest that labour market participation by people with a disability in Europe is about 20 per cent lower than for the general population (Eichhorst et al., 2010, p. 7). Care is needed in interpreting differences between survey findings cross-nationally. There is a great deal of variability across countries in the prevalence of disability, even when a harmonised measure is used (Gannon and Nolan, 2004; Applica, CESEP and Alphametrics, 2007; Eichhorst et al., 2010). Part of this variation may be associated with the use of different thresholds by people in each country in deciding whether to describe themselves as being limited in their activities. Adopting different thresholds may be associated with the desire to work, concern with stigmatisation, eligibility for benefits or cultural understandings of disability (Eichhorst et al., 2010, p. 17). Differences in benefit structures and cultural understandings of disability will also affect international comparisons. Even within a country, there may be similar differences between groups that affect the measured prevalence of disability. For instance, Applica, CESEP and Alphametrics (2007, p. 145) suggest that older adults, adults at work and married adults tend to use higher thresholds (i.e. are less likely to report having a disability) than younger adults, those outside the labour market and those who are single, divorced or separated.
Based on EU-SILC data for 2009, the percentage of people reporting activity limitations was highest in Finland (24.8 per cent), was also well above average in Germany, Denmark and the Netherlands (23 to 24 per cent) and was below 10 per cent in Greece, Malta, Bulgaria and Cyprus (Grammenos, 2011).
4
|
E d u cat ion a l an d E mp l oy m en t E xp er i en c e s of Peo p l e wi th a Di s ab i lity in Ir e lan dactivity limitation who are employed in Ireland is among the lowest. This suggests that, even if we take account of cultural differences in the understanding of activity limitation, the employment rate of people with a disability is low in Ireland by European standards. The impact of the recession is likely to have reduced the employment rate among people with a disability even further as their unemployment levels soared in line with the general rise in unemployment (Watson et al., 2010).
1.2.2 Disability and Education
Internationally and in Ireland, the adoption of inclusive education frameworks have been broadly welcomed. The most notable impact of this shift in policy is that children with disabilities and special educational needs (SEN)1 are increasingly educated alongside their peers in mainstream schools. As the profile of mainstream education changes, research has sought to establish the number of children with special educational needs and examine the nature and profile of this group of students. In line with prevalence estimates internationally (Van der Veen et al., 2010; Hills et al., 2010), findings in Ireland for 2007-2008 show that one-in-four children have special educational needs. In terms of social profile, children from disadvantaged backgrounds, particularly boys, are more likely to be identified with special educational need in schools (Banks and McCoy 2011). It is widely recognised that education is a key influence on life chances including job prospects, earnings and risk of poverty. Research shows, however, that children with disabilities and special educational needs face considerable barriers in engaging in school (Douglas et al., 2012) and are more likely to dislike school (McCoy and Banks 2012). Academically, these students are greatly at risk of poorer academic outcomes (Humphrey et al., 2013). People with disabilities have fewer education qualifications than non-disabled people when they leave school. This leads to a double disadvantage, where economic prospects are reduced both by disability status and by lower levels of education (NDA 2012). As a result, research consistently shows that young people with disabilities have poorer post-school outcomes (e.g. independent living, employment and attendance in further education) compared to their non-disabled peers (Bouck 2012).
Until recently, our knowledge of the school experiences for children and young people with disabilities in Ireland has been limited. In recent years, research has highlighted, however, that children with disabilities/SEN in mainstream schools are more likely to report not liking school than their peers (McCoy and Banks, 2012). School engagement is accepted as a key factor in student retention at school and school completion. Other studies have highlighted that the majority of students with disabilities/SEN do not require specific supports to follow the
1
curriculum or take exams (Banks et al., 2015) but where they do they generally require additional personnel such as special needs assistants. Although supports are essential for some students with disabilities/SEN, Banks et al., (2015) point to the importance of school climate and ethos in creating an inclusive environment in supporting students with disabilities/SEN (amongst other students) as they navigate the education system. In particular, this research highlights the increased level of difficulty for students with disabilities/SEN in post-primary education where there is a greater exam focus.
Figures from 2004 and 2010 for Ireland confirm that though there have been improvements in levels of education generally, the levels of education remain lower for people with a disability. In 2010, the percentages completing second-level or Post Leaving Certificate (PLC) education had increased to 29 per cent among people with a disability from 25 per cent in 2004, and the percentage completing third-level education had increased to 19 per cent from 12 per cent. However, the percentage completing third-level education remained at about half the corresponding figure among people without a disability (38 per cent) (Watson et al., 2013, p. 15).
1.2.3 Consequences of Educational and Labour Market Disadvantage
The consequences of educational and labour market disadvantage are a high level of dependence on social transfers and increased risk of poverty and material deprivation. Analyses by Watson and Maître (2013) showed that adults with a disability in 2011 depended on social transfers for just over half of their income. In the same year, the income poverty rate among people with a disability was 45 per cent compared to 13 per cent of people without a disability. Basic deprivation is an indicator that captures an ability to afford basic goods and services such as food, clothing, home heating, furniture and a basic social life. The level of basic deprivation had increased across the board as a result of the recession and in 2011 it was 39 per cent among people with a disability and 24 per cent among those without a disability (McGinnity et al., 2013).
1.3 AN OVERVIEW OF DISABILITY POLICY AND LEGISLATION
1.3.1 The Focus of Disability Policy
6
|
E d u cat ion a l an d E mp l oy m en t E xp er i en c e s of Peo p l e wi th a Di s ab i lity in Ir e lan dDisability policy is broad in scope and includes equality legislation as well a range of services and supports provided by state and non-governmental organisations. A key element of current policy is the 2004 National Disability Strategy which set out a programme of co-ordinated actions across government departments to support the equal participation of people with a disability in Irish society. This was to be achieved through a combination of legislation, institutional arrangements and services to support and reinforce equal participation for people with disabilities. The main legislative instruments resulting from the strategy have been the following:
The Disability Act 2005 established a statutory basis for an independent assessment of health and social service needs for people with a disability. Part V of the Act sets a 3 per cent target of employees with disabilities for government departments, public bodies and their agencies. The Act includes a series of sectoral plans in relation to the provision of services for people with specified disabilities.
The Education for Persons with Special Educational Needs (EPSEN) Act 2004 made provision for the education of people with special educational needs.
The Citizens Information Act 2007 included a commitment to implement a Personal Advocacy Service (PAS) for people with a disability.
1.3.2 Equality Legislation
Equality legislation covers employment and the provision of goods and services. The Employment Equality Acts 1998–2011 prohibit employers from discriminating against a person because they have a disability. The Acts state that the employer shall take appropriate measures, where needed in a particular case, to enable a person who has a disability to have access to employment, to participate or advance in employment and to undergo training. The employer is obliged to take these measures, unless they would impose a disproportionate burden on the employer.
The Equal Status Acts 2000–2011 require public and private providers of goods and services not to discriminate on the basis of disability and to accommodate the needs of people with disabilities through making reasonable changes in what they do and how they do it (provided the cost is no more than nominal), where, without these changes, it would be very difficult or impossible for people with disabilities to obtain those goods or services.
1.3.3 Services for People with a Disability
responsible for equality legislation. The Department of Social Protection provides social insurance payments to people with disabilities, as well as administering the Supported Employment Scheme and other work schemes. The Department of Health is responsible for policy related to the provision of services, including day services.
The Health Service Executive (HSE) is responsible for and provides a range of services for people with intellectual, physical and sensory disabilities or autism. These services include basic health services as well as assessment, rehabilitation, income maintenance, community care and residential care.
In recent years the National Council for Special Education (NCSE) has taken over responsibility from the Department of Education and Skills for allocating resources for students with disabilities/SEN in mainstream schools. To date a combination of funding models has been used which includes school- and individual student-level funding depending on the severity of needs of the student. Up to 2005 the Department of Education and Skills individually resourced all students with disabilities/SEN through an individual application system. In that year, the general allocation model (GAM) was introduced at school level to target students with disabilities categorised as ‘high incidence’ (borderline-mild general learning disabilities and specific learning disabilities such as dyslexia). The introduction of block grant funding to schools significantly reduced the administrative burden on the Department of Education and Skills at the time and coincided with new legislation (under the Education for Persons with Special Educational Needs (EPSEN) Act, 2004) which specified for the first time that, where possible, students with disabilities/SEN should be educated alongside their peers in mainstream settings. In 2012, a similar model was introduced at post-primary by the NCSE who, by that time, had taken over responsibility for resourcing students with disabilities/SEN at primary and primary. Operating alongside the throughput models at both primary and post-primary however, the resource model remains for students with ‘low incidence’ or less common disabilities, in respect of whom the school is individually allocated funding based on the nature and type of disability. In 2013 however the Minster for Education formed a working group to evaluate the existing funding models for special education.
8
|
E d u cat ion a l an d E mp l oy m en t E xp er i en c e s of Peo p l e wi th a Di s ab i lity in Ir e lan deducational outcomes. The group proposed that resource teachers be allocated based on two components; school educational profile, and a baseline component provided to every mainstream school to support inclusion, prevention of learning difficulties, and early intervention. The school educational profile would be based on three elements: students with complex special educational needs, percentages of students performing below a certain threshold on standardised test results, and the social context of a school including gender (NCSE, 2014). On leaving school there are a range of services available for young people with disabilities wishing to enter the labour market or further education and training. These include employment support provided by the Department of Social Protection for people with disabilities to facilitate labour market entry and retention through its local employment service offices and Intreo centres. For those with a disability who need assistance finding a job or taking up paid employment, a service known as ‘EmployAbility’ (formerly the Supported Employment Service) provides supports and services. Services include ‘on-the-job’ supports such as a job coach and are provided by sponsor organisations on behalf of the Department of Social Protection.
1.3.4 Non-Governmental Organisations Providing Services
Most disability services in Ireland are provided by the voluntary or non‐profit sector with grant aid from the HSE. In 2009 a total of 280 service providers/ agencies were funded by the HSE to provide services, or received grants towards the cost of their services (Keogh, 2011). The sector is extremely diverse, ranging from small single‐focus groups to large organisations employing several hundreds of people. Disability services cover a wide range of provision, including residential and respite services, medical and clinical therapies, day services, work and employment services, assisted living/personal assistant services, home support and the provision of aids and appliances. Information, advocacy and support services are often provided by agencies or bodies with expertise in particular conditions. There are approximately 72 medium to large non‐statutory service providers each receiving over €1 million in funding (Keogh, 2011).
1.4.4 Income Supports
Income supports for people with a disability are administered by the Department of Social Protection. The main long-term weekly benefits are Disability Allowance and Invalidity Pension. Both are long-term payments available to people up to the age of 65 who qualify on disability grounds. Disability Allowance is a means tested social assistance payment while Invalidity Pension is not means tested but is linked to past social insurance contributions. The Occupational Injuries Benefit Scheme is another set of payments that applies to work related injuries and illnesses.
The traditional income support model for people with a disability assumed that they would not be able to work at all. In recent years, however, there has been an increasing move towards the use of income supports to enable people with a disability to find or remain in employment. The Partial Capacity Benefit (PCB) is available to people who have been receiving a disability-related social protection payment for at least six months. It enables a person who has a reduced capacity to work (assessed by Medical Assessors of the Department) to return to work or self-employment and continue to receive a payment from the Department of Social Protection. Individuals may return to Invalidity Pension if, for example, their employment ceases or they cannot continue to work.
10
|
E d u cat ion al a n d E m p loy m en t E xp eri en c e s o f P eo p l e wi th a Di s ab i lit y in I r elan dIn recognition of the fact that some disabilities may reduce the productivity of an employee, there is a Wage Subsidy Scheme that offers financial support for employers who employ certain people with disabilities on a full-time basis (21 hours or more). This enables the employer to make up a shortfall in productivity that may arise from some types of disability. The employee in respect of whom the grant assistance is claimed is entitled to the same conditions of employment as other employees.
1.4 DATA AND METHODOLOGY OF THIS REPORT
1.4.1 The National Disability Survey
This report builds on the existing studies to address the research questions outlined at the beginning of this chapter. The data for the research come from the 2006 National Disability Survey (NDS), with key variables matched onto the NDS data file from Census 2006. The NDS was a landmark in terms of in-depth information about people with disabilities in Ireland and provides a basis for the examination of the living and working circumstances and needs of people with disabilities (CSO 2008, 2010). The survey was designed as a follow-up to the 2006 Census and includes 12,661 people with a disability. The model of disability underlying the NDS is the ‘biopsychosocial model’ advocated by the World Health Organisation (WHO, 2001). In this model, disability is understood in terms of how the individual interacts with the physical and social environment (NESC, 2009). In other words, in order to understand what people are able to do, we need to take account of the resources available to them and the barriers placed before them in their environment as well as their own physical, mental and emotional resources. Accordingly, in the National Disability Survey, information is gathered both on the person’s condition, on the environment in which they live and the implications of both for their capacity to participate in education, employment, family, social and political life. In order to be considered as having a disability, the condition must limit the person’s capacity to act in some way. For most of the types of disability covered in the survey, the person is considered as having a disability if the condition limited them at least ‘a moderate amount’. In the case of emotional, psychological and mental health (EPMH) disability, and learning or intellectual disability, the person is regarded as having a disability if the condition limits them even ‘just a little’. This was done in order to be as inclusive as possible in recording these types of disability where stigma may discourage people from acknowledging the presence of the condition or difficulty.
college, their work situation and their need for services and supports. The main relevant questions from the NDS are shown in Appendix Table A1.1.
The NDS contains detailed information about nine different types of disability (seeing, hearing, speech, mobility and dexterity, remembering and concentrating, intellectual or learning, EPMH, pain and breathing). Most people with a disability have more than one type, with the average being 2.6 of these different types (CSO, 2008, p. 15). In the analysis in Chapters 2 and 3 we include an indicator of the person’s main disability type. The ‘main disability’ is based on asking people with more than one of the nine different types of disability which they considered to be the main one. In the analysis reported here, we also distinguish between people with learning disability (such as dyslexia) only or ADHD only and those whose main disability includes an intellectual disability or autistic spectrum disorder, as shown in Table 1.1. We anticipate that the distinction may be important in terms of educational and labour market outcomes. Although ADHD and learning disability are distinct from one another, there are too few cases to separate those with each of these only (i.e. in the absence of intellectual disability).
TABLE 1.1 Distinguishing Between Learning and Intellectual Disability
% of Total with Learning or Intellectual Disability
%
N cases
1. Intellectual disability only 19 282
2. Autism or Autistic Spectrum Disorder only <3 <50
3. Intellectual and ASD disability 4 51
4. Learning disability or ADHD only 22 307
5. Learning/ADHD and Intellectual disability 32 479
6. Learning/ADHD and ASD disability <3 <50
7. Learning/ADHD and Intellectual and ASD disability 20 328
Total 100 1,485
Learning Disability or ADHD (4) 21.9 307
Intellectual disability or Autism Spectrum Disorder
(1,2,3,5,6,or 7) 78.1 1,178
Source: National Disability Survey 2006, analysis by authors.
Note: People with a disability age 18-64.
12
|
E d u cat ion al a n d E m p loy m en t E xp eri en c e s o f P eo p l e wi th a Di s ab i lit y in I r elan dIn Chapter 4 we conduct separate analyses for subgroups of people with each of four major disability types (mobility and dexterity; emotional, psychological and mental health; pain and intellectual disability). For the purpose of the subgroup analyses, we include all persons with each type of disability, not just those identifying that type and their main disability.
BOX 1 A Note on Imputation of Missing Information
Approximately 18 per cent of working-age people with a disability were not asked certain employment questions because of a routing problem following the question on whether they were affected by disability before age 65 (variable s701_age). The answer should be yes in all cases where the person with a disability is under age 64, but some answered ‘no’, and were routed out of the employment questions.
We have been able to use other information (such as main economic status from the Census) to impute key variables such as whether the person ever worked and their status with respect to being at work, interested in work or not interested in work. These key variables have been imputed for all but about 6 per cent of the relevant sample. Present status from the census was used to identify those currently at work; those describing themselves as unemployed were treated as interested in work. If the person was seeking their first job, they were presumed not to have worked in the past while those describing themselves as retired were presumed to have worked in the past and to be ‘not interested’ in a job.
Of the 6 per cent still ‘missing’ on the variable for whether they were interested in work, 34 per cent describe their main status as ‘looking after home and family and 58 percent have a main status ‘unable to work because of illness or disability’. It seems likely, therefore, that the majority of this group would not be interested in work, at least in the short term.
This also affects the analysis in Chapter 4 on general requirements the person has in order to be able to work, such as a wage subsidy or flexible working arrangements. Those answering that they were not affected by their disability before the age of 65 were also routed out of this set of items, even though they might have been under age 65 at the time of the interview. The percentage missing on the work requirement items was higher for those at work (34 per cent), those with hearing disability (35 per cent) and those with third-level education (23 per cent). It is likely that this group is less limited (or consider themselves less limited) by their disability, so they are probably less likely to require special services or modifications in order to take up employment.
1.4.2 Analysis Methodology
The statistical analysis allows us to take account of individual differences (such as in gender, age, type and severity of disability, and age of onset) in addressing the research questions.
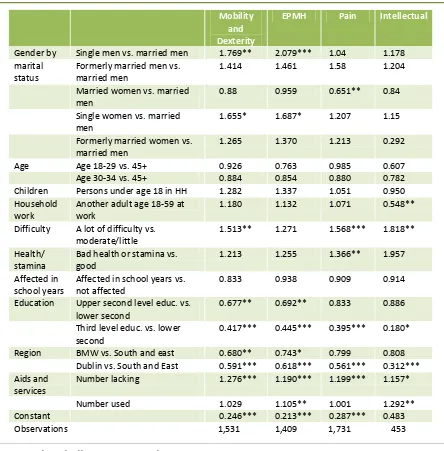
As part of this analysis, we consider the factors associated with different levels of self-reported needs and unmet needs for aids specific to each type of disability. The goal here is twofold: (a) to assess the extent to which non-employment is associated with unmet needs for aids and (b) to assess the extent to which other individual resources (such as education) are associated with being able to obtain the required aids. Since most of the aids are specific to one type of disability, we examine these by counting the number used and the number lacked.
The purpose of the statistical models is to disentangle the influences of different related factors. For instance, people who have a disability during their school years may leave school sooner. The statistical model allows us to separate the impact of having a disability from the impact of have a lower level of education. Most of the models deal with outcomes that are categorical, such as whether or not the person was affected by having a disability during their school years. We use logistic regression, a well-established method for carrying out multiple regression analysis on models with categorical outcomes. One disadvantage of this approach is that it is somewhat more difficult to explain the results of logistic regressions than simpler regression techniques. In order to facilitate the interpretation of the results, we use the models to estimate the percentage of people likely to have the characteristic of interest, with other factors held constant. For example, we use the models to calculate the percentage of males and females we would expect to have been influenced while at school, if males and females were similar in terms of their current age, type of disability and region of residence. We refer to these as ‘adjusted percentages’ to distinguish them from the observed percentages. The adjusted percentage is the percentage we would expect if the other characteristics in the model were held constant.2 Because the data refer to a particular point in time, many of the patterns we report are associations and we cannot be certain of the direction of causation. In many instances we can use information on timing to inform insights about the direction. For example, it is reasonable to expect that education was completed before the person made a decision on whether to enter the labour market, for instance, and we know when the person was first affected by the disability. However, when discussing the association between unmet need for services and being outside of employment we are less certain about the direction of causation.
2
14
|
E d u cat ion al a n d E m p loy m en t E xp eri en c e s o f P eo p l e wi th a Di s ab i lit y in I r elan dFor example, people with a disability who are not in employment may be more likely to report that there are some aids or devices that they need but do not have. This might be because a lack of access to aids and devices acts as a barrier to entering employment, or it might be because people with a disability who are not in employment have more difficulty in affording the aids and devices they need. Our strategy is to control for as many as possible of the potentially confounding factors such as the person’s health, stamina and the difficulty associated with the disability – factors which may both increase the need for services and reduce the probability of employment. Nevertheless, in the absence of longitudinal data, caution is needed in drawing inferences about the direction of causation.
1.5 OUTLINE OF REPORT
In the next chapter we focus on the educational experiences of working-age adults with a disability, including the numbers affected by disability during their school or college years and the impact this had on the highest level of education completed.
In Chapter 3 we turn to a consideration of the labour market experiences of people with a disability and the way in which employment status is, in turn, influenced by educational experiences. We examine unmet demand for employment among people with a disability as well as type of exclusion from employment. For some people with a disability, the main challenge is getting into the labour market in the first place, while for others the challenge is to retain the link to employment after onset of a disability.
In Chapter 4 we consider the issue of use of and need for aids and devices specific to each of four major types of disability (mobility and dexterity; emotional, psychological and mental health; pain and intellectual disability). Nearly nine out of ten working-age adults with a disability has one of these types of disability. We examine factors associated with use of these services/aids, unmet need for services/aids and the extent to which an unmet need may be linked to non-participation in employment, controlling for severity of the disability, health, stamina and a range of other factors. We also consider the issue of whether a wage subsidy may be needed in order to enable working-age adults with a disability to participate in employment.
Chapter 2
Disability and Education
2.1 INTRODUCTION
In this chapter we focus on the first research question, which concerns the extent to which people with a disability were affected by their disability while in school or college. As well as descriptive tables, we present the results of a statistical model to investigate which groups of people with a disability are most likely to have left school sooner than they would have liked and a statistical model to investigate the consequences for educational attainment.
Previous Irish research has shown that people with a disability have lower levels of education than people without a disability, but there is a general increase in levels of education both for people with a disability and for people without a disability over time (Watson et al., 2013). Table 2.1 shows the educational profile of the working-age population by presence of disability in 2004 and 2010. In 2004, 61 per cent of people with a disability had less than full second-level education, compared with 31 per cent of people without a disability; 25 per cent of people with a disability had completed second-level or post-Leaving Certificate (PLC) education, and a further 12 per cent had completed third-level education. In 2010 the percentages completing second-level or PLC education had increased to 29 per cent and the percentage completing third-level education had increased to 19 per cent. The percentage completing third-level education remained less than half the rate of third-level completion among people without a disability (38 per cent) in 2010 (Watson et al., 2013).
TABLE 2.1 Education of People With and Without a Disability
2004 No Disability
%
2004 Has a Disability
%
2010 No Disability
%
2010 Has a Disability
%
Less than full second-level 31 61 22 50
Higher second-level to PLC 36 25 37 29
Third-level 30 12 38 19
Not stated 2 2 3 3
100 100 100 100
16
|
E d u cat ion al a n d E m p loy m en t E xp eri en c e s o f P eo p l e wi th a Di s ab i lit y in I r elan d2.2 PEOPLE AFFECTED BY DISABILITY DURING EDUCATION
We now turn to the National Disability Survey and begin by providing an overview of the proportion of working-age people with a disability who were affected by disability during the time they were in school or college and the impact this had on educational absences and leaving school sooner than desired. Figure 2.1 shows that disability during the school years affected 30 per cent of working-age people with a disability. More than two thirds of these were first affected before starting school or in primary school.
FIGURE 2.1 Whether Affected by Disability while in School, when First Affected, Educational Absences and whether Finished School Sooner than Desired
Source: National Disability Survey 2006, analysis by authors. People with a disability age 18-64.
Over half of those affected during their school years had educational absences over the course of their educational career, with most having absences lasting over 12 months. Expressed as a percentage of working-age people with a disability, this amounts to about one in six who lost some time in school or college because of a disability and nearly one in ten missing a year of more of education. 30% 13% 9% 3% 2% 2% 1% 13% 4% 4% 9% 15% 15%
0% 5% 10% 15% 20% 25% 30%
Affected while in school
Before school age
Primary
Lower secondary
Upper secondary
Third level or PLC
Other
None
Less than 3 months
3 to 12 months
Over 12 months
Fifteen per cent of working-age people with a disability – or half of those affected while still in education – left school sooner than they would have liked because of the disability. These figures show that the impact of disability on education was an important barrier to participation for a minority of working-age people with a disability, with about one in seven leaving school sooner than they would have liked.
Table 2.2 shows the profile of working-age people with a disability (last column) in terms of gender, age group and main type of disability and the percentage of each group affected by their disability during their education.
Turning first to the profile of working-age people with a disability, we see that they are fairly evenly divided between males and females. In terms of age group, more than half are over age 45 but a substantial proportion (nearly one quarter) are under 35. The most common types of main disability are pain (25 per cent), mobility and dexterity (22 per cent) and emotional, psychological and mental health disability (EPMH, 20 per cent). Fewer than one in ten identify each of the following as their main disability: seeing, hearing, speech, remembering and concentrating and breathing disability.
TABLE 2.2 Whether Affected by Disability while in School by Gender, Age Group and Main Type of Disability Yes,
Affected %
Not Affected
%
Total %
% of Population
Gender Male 31 69 100 51
Female 28 72 100 49
Age group 18-34 61 39 100 24
35-44 31 69 100 20
45-54 23 77 100 25
55-64 10 90 100 30
Main Disability Seeing 31 69 100 4
Hearing 35 65 100 6
Speech 64 36 100 1
Mobility and Dexterity 18 82 100 22
Remembering and Concentrating 43 57 100 4
Learning disability 80 20 100 1
Intellectual disability 92 8 100 9
Emotional, Psychological and Mental Health
33 67 100 20
Pain 11 89 100 25
Breathing 20 80 100 8
Total 30 70 100 100
[image:34.595.82.518.420.733.2]18
|
E d u cat ion al a n d E m p loy m en t E xp eri en c e s o f P eo p l e wi th a Di s ab i lit y in I r elan dAbout one per cent of working-age people with a disability identify learning disability as their main type without also having an intellectual disability or an autistic spectrum disorder (ASD). Nine per cent identify intellectual disability or more rarely autistic spectrum disorder as their main disability. This group is made up primarily of people who have an intellectual disability either alone (24 per cent) or combined with difficulty in learning or combined with ASD (75 per cent). Only 1 per cent have ASD but no other intellectual or learning problems.
Working-age men with a disability are slightly more likely than their female counterparts to have been affected by the disability while in school (31 per cent vs. 28 per cent). We know that most disability is acquired over the life-course rather than being present from birth or childhood (Watson and Nolan, 2011). As a result, older people with a disability are more likely to have acquired the disability at some point after leaving school. As we might expect, therefore, the younger working-age people with a disability are more likely to have been affected while in school (61 per cent of 18-34 year olds vs. 10 per cent of those over 55).
People with certain types of main disability are more likely to have been affected by disability while in school, especially intellectual disability (92 per cent), learning disability (80 per cent) and speech disability (64 per cent). The figure is 43 per cent for those whose main disability is remembering and concentrating and 20 per cent of those whose main disability is associated with breathing difficulties. Roughly one-third of those with seeing, hearing or EPMH disability were affected while in education. People whose main disability is pain are least likely to have been affected by it while in education (11 per cent).
Table 2.3 shows some further detail by age group. In spite of the fact that younger adults with a disability are more likely to have been affected while in school, they are also more likely to have completed second-level education. This is, at least in part, due to the general increase in the percentage of young people completing second level which has been rising since the 1960s.
TABLE 2.3 Percentage Completing Second Level and Percentage with Each Level of Difficulty by Age Cohort
Age 18-34 %
Age 35-44 %
Age 45-54 %
Age 55-64 %
Education Did not complete second level 50 58 66 76
Completed second level 50 42 34 24
Total 100 100 100 100
Difficulty Moderate or a little 45 39 36 33
A lot or cannot do certain things 55 61 64 67
Total 100 100 100 100
Source: National Disability Survey 2006, analysis by authors.
Note: People with a disability age 18-64.
2.3 MODEL FOR LEAVING SCHOOL SOONER THAN DESIRED
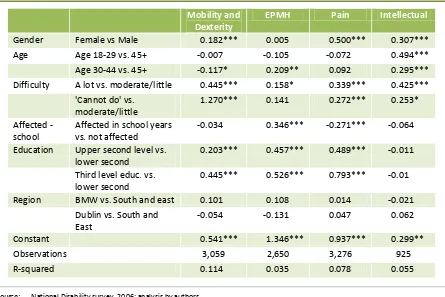
Which groups of working-age people with a disability are most likely to have left school sooner than they would have liked? We answer this question by running two statistical models: one for whether affected while in school and one for leaving school sooner than desired, conditional on being affected while in school. The independent variables are gender, type of disability, current age and region, and level of difficulty associated with the disability. The logit models are shown in Appendix Table A2.1. Table 2.4 shows the adjusted percentage in each group that would have been affected while in school, controlling for other characteristics, and the adjusted percentage (of those affected during the school years) leaving school sooner than they would have liked.3 The adjusted percentage is the percentage we would expect if the other characteristics in the model were held constant. The adjusted percentage will differ from the overall figures in Table 2.2 to the extent that the compositions of the groups differ. For instance, we saw in Table 2.2 that males are slightly more likely than females to have been affected by the disability during the school years. When we control for type of disability, however, we see that the gender difference is not statistically significant.
Turning first to whether the person was affected by disability during the school years, the adjusted figures are shown in the first column of Table 2.4. As noted above, there is no significant gender difference in this respect when we control for type of disability. In terms of age group, younger adults with a disability are more likely to have been affected while in school, mainly because they have less time post-school in which the disability may emerge. Turning to disability type, we see that those with an intellectual disability (85 per cent) or learning disability (75 per cent) are more likely to have been affected by the disability while in
3 [image:36.595.73.524.94.239.2]
20
|
E d u cat ion al a n d E m p loy m en t E xp eri en c e s o f P eo p l e wi th a Di s ab i lit y in I r elan dschool (with other factors held constant), followed by those with a speech disability (56 per cent). Compared to the reference category of people with a mobility and dexterity disability (adjusted value of 18 per cent affected while in school), the percentage is also significantly higher for those with seeing, hearing, remembering and concentrating and emotional, psychological and mental health disabilities (all in the range from 32 to 39 per cent). The percentage estimated by the model is significantly lower for those with pain disability (at 12 per cent) and is slightly higher for those with breathing disability (24 per cent).
Those with a greater current level of difficulty associated with the disability are more likely to have been affected while in school, with adjusted figures of 40 per cent for those who cannot do some things at all and 30 per cent for those with ‘a lot’ of difficulty compared to 26 per cent for those with a moderate level of difficulty or ‘just a little’ difficulty.
TABLE 2.4 Adjusted Percentage Affected During School Years and (of those Affected During School Years) Adjusted Percentage who Left School Sooner Than Desired
Model 1: Affected in School Years
%
Model 2:
If affected in School Years, Left Sooner Than Desired
%
Gender Male (Ref.) 29 53
Female n.s. 46
Age 18-29 55 41
30-44 34 n.s.
45+ (Ref.) 21 57
Main disability Seeing 32 n.s.
Hearing 38 n.s.
Speech 56 n.s.
Mobility and dexterity (Ref). 18 44
Remembering and
concentrating 40 n.s.
Learning 75 n.s.
Intellectual 85 n.s.
EPMH 33 64
Pain 12 n.s.
Breathing 24 n.s.
Difficulty Moderate or a little (Ref) 26 43
A lot 30 54
Cannot do some things 40 52
Region Border, Midlands and West n.s. n.s.
Dublin n.s. 44
South and East (Ref.) 29 52
Source: National Disability Survey 2006, analysis by authors. See Appendix Table A2.1 for model odds ratios.
The differences by region are not statistically significant. The Border, Midlands and West (BMW) region does not differ from Dublin or from the South and East in terms of the adjusted percentage affected by the disability during the school years.
The second