Abstract—This paper describes a method of modeling and
simulation photovoltaic (PV) module that implemented in MATLAB. Each solar cell technology comes with unique temperature coefficients. These temperature coefficients are important and the temperature of the solar cell has direct influence on the power output of a solar PV module. Once the temperature a solar module operates increases, the power output of the solar module will decrease. Crystalline solar cells are the main cell technology and usually come with a temperature coefficient of the maximum output power of about -0.5% / degree Celsius. The rated power as generally indicated on the module’s label is measured at 25 degrees Celsius, and with any temperature increase above 25°C you have to take into account power losses of 1% for every 2°C increase. Most installed solar modules in sunny countries easily reach higher temperatures than 25°C. In fact, temperatures of 40°C and above are easily reached. Solar cell performance decreases with increasing temperature, fundamentally owing to increased internal carrier recombination rates, caused by increased carrier concentrations. The operating temperature plays a key role in the photovoltaic conversion process
Index Terms— Photovoltaic, MATLAB, Modeling, temperature coefficient, efficiency, PV module, PV characteristic
I. INTRODUCTION
he development of solar cell technology begins with the 1839 research of French physicist. The first genuine solar cell was built around 1883 by Charles Fritts, who used junctions formed by coating selenium (a semiconductor) with an extremely thin layer of gold. So the photovoltaic is a high-technology approach to converting sunlight directly into electrical energy.
The electricity is direct current and can be used that way, converted to alternating current or stored for later use. Conceptually, in its simplest form a photovoltaic device is a solar-powered battery that's only consumable is the light that fuels it. There are no moving parts, operation is environmentally benign, and if the device is correctly encapsulated against the environment, there is nothing to wear out, because sunlight is universally available, photovoltaic devices have many additional benefits that make them usable and acceptable to all inhabitants of our planet. Photovoltaic systems are modular, and so their electrical power output can be engineered for virtually any application, from low-powered consumer uses-wristwatches, calculators
Manuscript received March 16, 2018; revised April 14, 2018 this work was supported in part by the King Saud University Department of Electrical Engineering Collage of Engineering.
B. Almashary A. King Saud University Department of Electrical Engineering Collage of Engineering P.O.Box 800 Riyadh 11421 Saudi
and small battery chargers-to energy-significant requirements such as generating power at electric utility central station. Moreover, incremental power additions are easily accommodated in photovoltaic systems, unlike more conventional approaches such as fossil or nuclear fuel, which require multi megawatt plants to be economically feasible. [1] The open-circuit voltage, VOC, is the maximum voltage available from a solar cell, and this occurs at zero current. The open-circuit voltage corresponds to the amount of forward bias on the solar cell due to the bias of the solar cell junction with the light-generated current. The open-circuit voltage is shown on the IV curve fig.4.
II. ADVANTAGESOFPHOTOVOLTAICCELL
A. Review of Solar cells
Solar cells are long lasting sources of energy which can be used almost anywhere. They are particularly useful where there is no national grid and also where there are no people such as remote site water pumping or in space. Fig. 1 shows the one of the photovoltaic array.
Fig .1Photovoltaic array in houses
Solar cells provide cost effective solutions to energy problems in places where there is no mains electricity. Solar cells are also totally silent and non-polluting. As they have no moving parts they require little maintenance and have a long lifetime. Compared to other renewable sources they also possess many advantages; wind and water power rely on turbines which are noisy, expensive and liable to breaking down [2]. Most installed solar modules in sunny countries easily reach higher temperatures than 25°C. In fact, temperatures of 40°C and above are easily reached. Solar cell performance decreases with increasing temperature,
Arabia (corresponding: fax: +966114676757; e-mail: balmashary @ ksu.edu.sa,) and Ahmed Telba. Is in the Electrical Engineering Department, Collage of Engineering King Saud University, Saudi Arabia (e-mail: [email protected]).
Effect of High Temperature to Output Power of
Solar Cell
B. Almashary and Ahmed Telba
Member, IAENG, Senior Member, IEEE
[image:1.595.314.559.437.569.2]
fundamentally owing to increased internal carrier recombination rates, caused by increased carrier concentrations. The operating temperature plays a key role in the photovoltaic conversion process. The climate of Kingdom of Saudi Arabia is generally hot and dry, characterized by extremely hot and dry summers with very large diurnal temperature ranges and moderately cold winters this case had been studies in this paper.
III. DISADVANTAGES OF PHOTOVOLTAIC CELL The main disadvantage of solar energy is the initial cost. Most types of solar cell require large areas of land to achieve average efficiency. Air pollution and weather can also have a large effect on the efficiency of the cells. The silicon used is also very expensive and the problem of nocturnal down times means solar cells can only ever generate during the daytime. Solar energy is currently thought to cost about twice as much as traditional sources (coal, oil etc.). Obviously, as fossil fuel reserves become depleted, their cost will rise until a point is reached where solar cells become an economically viable source of energy. When this occurs, massive investment will be able to further increase their efficiency and lower their cost [2].
III. SOLARRADIATION
Solar radiation is the electromagnetic radiation emitted by the Sun. Solar radiation interacts with the Earth’s
atmosphere to create three types of irradiance at ground-level:
Direct Radiation: solar radiation available directly from the sun.
Diffuse Radiation: scattered solar radiation available from the entire sky, but not including the direct radiation.
Global Radiation: it is the total radiation
[image:2.595.313.522.308.447.2]consisting of direct radiation and diffuse radiation. Solar radiation can be represented as a total for the year (kWh/m2) or commonly on an average daily basis for a given month annually (kWh/m2-day). Regional scale satellite-based maps and initial ground-based solar resource monitoring data indicate that Saudi Arabia possesses a huge potential for solar energy. Table (2) shows the radiation incident on a horizontal surface (W/m2-day) in Riyadh [3]. TABLE I
The average daily radiation in Riyadh
A. Why Solar Energy Now in Saudi Arabia
Solar energy has become a clean source of electricity. The cost of installing these systems is already within reach of the middle class. In marginal areas, the cost of producing electricity from renewable sources is lower than
conventional electricity because of the savings in the construction of infrastructure and laying of cables. Now the power of any house, irrigation system or network of streets can be provided through the sun and completely dispensed with government electricity. Figure 6 shows the sun radiation map over the world it’s appear that Saudi Arabia in high sun radiation as shown in table 1.
B. The climate of KSA
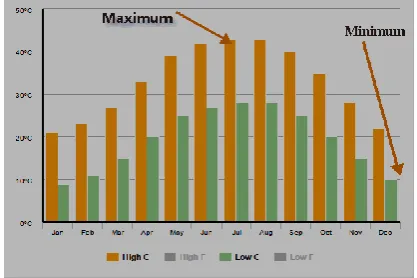
The climate of KSA is generally hot and dry, characterized by extremely hot and dry summers with very large diurnal temperature ranges and moderately cold winters [3].
Fig 2. Mean monthly temperatures of the KSA
As shown in figure.3 Electricity consumption depends mainly on the temperature of the day as shown by graph for Riyadh, Sept. 09, 2006 [4-5].
III. CHARACTERIZATION OF SOLAR CELL
In this Section the behavior of the calculated equivalents circuits is analyzed. The aim is to check if the calculated circuit models reproduce the experimental data of the solar panels included in the manufacturer’s datasheet. In order to produce results, the equivalent circuits of the solar panels have been modeled using Simulink Matlab as shown in figures.5-6. Obviously, the mentioned circuits are characterized by the parameters already calculated. As shown in Figures 5 and 7 and 9. Several simulations have been performed at different irradiation levels, calculating the I-V curve in each case. The results there are included in Figures 6–9.PV cells can be modeled as a current source in parallel with a diode as shown in figure 3 is the simple model of solar cell. When there is no light the PV cell behaves like a diode. As the intensity of incident light increases, current generated by the PV cell increases [6-9]:
The total current I is equal to the difference between the current Iph generated by PV effect and the diode current
[image:2.595.46.221.613.779.2]
𝐼 = 𝐼𝑆(exp (
𝑞𝑉
𝐾𝑇) − 1) − 𝐼𝐿 (1)
Fig .3 models of the most commonly used PV cell
The open-circuit voltage decreases with temperature because of the temperature dependence of I0. The equation for I0 from one side of a p-n junction is given by;
C. Short circuit current in solar cell
The Short circuit current in solar cell is given by equation 2 As:
𝐼𝑆𝐶= 〈𝐼𝑆⌈exp (
𝑞𝑉
𝐾𝑇) − 1⌉ − 𝐼𝐿〉 at V=0 (2)
And the open circuit voltage given by equation 3
𝑉𝑂𝐶=
𝑘𝑇
𝑞 𝑙𝑛 ( 𝐼𝐿
𝐼𝑆+ 1) (3)
From equation 2 and 3 the open circuit voltage and Short circuit current in solar cell is highly dependent of the temperature.
𝐼 = 〈𝐼𝐿− 𝐼𝑆⌈exp (
𝑞𝑉+𝐼𝑅𝑆
𝑛𝑘𝑇 ) − 𝑉+𝐼𝑅𝑆
𝑅𝑆𝐻⌉〉 (4)
In the above equation, many of the parameters have some temperature dependence, but the most significant effect is due to the intrinsic carrier concentration, ni. The intrinsic carrier concentration depends on the band gap energy (with lower band gaps giving a higher intrinsic carrier
concentration), and on the energy which the carriers have (with higher temperatures giving higher intrinsic carrier concentrations). The equation for the intrinsic carrier concentration is [6];
(5)
From equation for the intrinsic carrier concentration the carrier is highly depends of temperatures.
While equation 4 is the effect of series Rs and parallel shunt RSH resistance to the total current of the cell, all these values attached in panel data sheet[7].
IV. MATHEMATICAL MODEL OF SOLAR CELL
All semiconductor devices are sensitive to temperature. Increases in temperature reduce the band gap of a semiconductor, thereby effecting most of the semiconductor material parameters. The decrease in the band gap of a semiconductor with increasing temperature increasing the energy of the electrons in the material. Lower energy needed to break the bond. In the bond model of a semiconductor band gap, reduction in the bond energy also reduces the band gap. Therefore increasing the temperature reduces the band gap. In a solar cell, the parameter most affected by an increase in temperature is the open-circuit voltage. The impact of increasing temperature shown in figure.3.
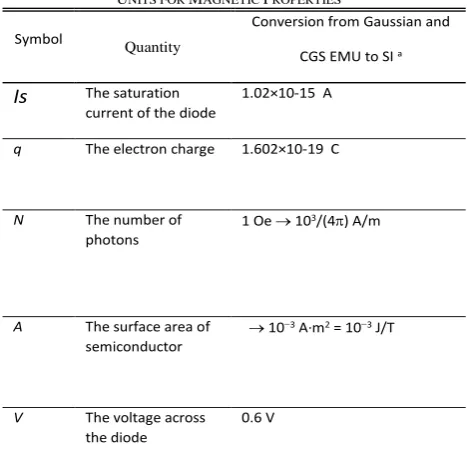
TABLEII
UNITS FOR MAGNETIC PROPERTIES
Symbol
Quantity
Conversion from Gaussian and
CGS EMU to SI a
Is The saturation current of the diode
1.02×10⁻¹⁵ A
q The electron charge 1.602×10⁻¹⁹ C
N The number of photons
1 Oe 103/(4) A/m
A The surface area of semiconductor
103 A·m2 = 103 J/T
V The voltage across the diode
[image:3.595.57.240.61.219.2]0.6 V
[image:3.595.309.543.156.388.2] [image:3.595.310.544.614.754.2]Fig. 3 are the models of the most commonly used PV cell: Current source parallel with one diodes. A single-diode model [9-11] has four components: photo-current source, diode parallel to source, series of resistor Rs, and shunt resistor Rsh. There are another model using two-diode model: [12-13] it’s used for accurate calculation.
Fig .5 The Simulink model of photovoltaic cell
The simulation representing equations to calculate the effect temperature on IV characteristics of a solar cell using Simulink model (Tc and ILG) is shown in Fig.6.
The power produced by the cell in Watts can be easily calculated along the I-V sweep by the equation P=IV [14]. At the ISC and VOC points, the power will be zero and the maximum value for power will occur between the two. The voltage and current at this maximum power point are denoted as VMPP and IMPP respectively experimental measurements of the sweep in shown in fig. 7.
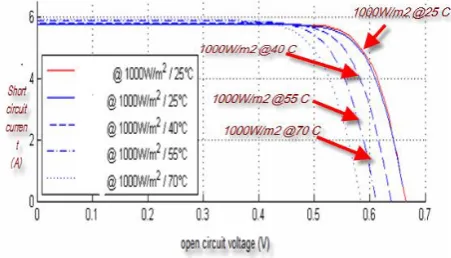
[image:4.595.323.550.250.435.2]In this Section the behavior of the calculated equivalents circuits is analyzed. The aim is to check if the calculated circuit models reproduce the experimental data of the solar panels included in the manufacturer’s datasheet. In order to produce results, the equivalent circuits of the solar panels have been modeled using Simulink Matlab as shown in figures 5,6 Obviously, the mentioned circuits are characterized by the parameters already calculated in experimental results . Several simulation have been performed at different temperature and irradiation levels, calculating the output voltage curve in each case. The results thereof are included in Figures 7.As shown in figure .8 Measured I_V curve of the of photovoltaic panel for maximum power PMPP it’s the actual power can be delivered from the panel and the effect of temperature .
Fig. 8 Simulated I-V curve of different illumination of Solar cell at 25o C
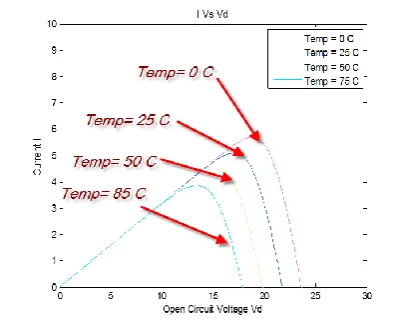
[image:4.595.72.266.388.496.2]As shown introduction high temperature reduce the open circuit voltage and output current should be the same. And in figure .10 simulated output voltage of solar module during the day and the effect of high temperature appear for the output voltage. The seeped voltage measured using automatic load in sunlight on day .In figure. 9 the simulation of the cell in Matlab and the I-V characteristic curve of the cell calculated at different illumination of Solar cell at 25o C.
Fig .9 Simulated PV-cell open circuit voltage and short circuit current at different temperature
Irsh Ilg
Id
2 Icell
1 Tc
Sum2
Sum
Saturation
u/rsh Fcn1 rs*u
Fcn Calculation of Iph, Tc
Calculation of Id
1 0.01s+1 1st order filter 3
Vcell 2 Ta 1 G
Fig6 the simulation of (ILG) equation
2 Jph
1 Tc
Sum1
1000 STC radiation
Product2 4.92
Iscr
It*(u-Tr) Fcn Calculation of Tc
2 Ta
[image:4.595.322.548.572.701.2]1 G
V. CONCLUSION
Its important points can be summarized as follows: Solar energy is a very precious gift from God that human being ever had, and we can make benefit from it by converting solar energy into electricity. Photovoltaic solar energy is clean (does not make environmental pollution), safe and is almost free maintenances. The maximum conversion efficiency of solar cells observed in laboratory has exceeded 24%. In this paper detailed simulation of the photovoltaic cell connected with boost converter is carried out by using SIMULINK software that come with MATLAB program. The results from simulation show that the effect of the irradiance on the output power of photovoltaic solar cell. When the irradiance increases; the output power from the cell increases and vice versa. And effect of high temperature is studded in Saudi Arabia and the effeminacy of the cell effect by increasing the temperature as shown in simulation the measured values at all sun rise on day light and the effect of the high temperature of the output voltage of the cell as shown in the simulated figures.
Acknowledgment
The Authors would like to thank the College of Engineering King Saud University, Kingdom of Saudi Arabia for their support.
References
[1] Aminzadeh, F.; Pindado, S. How has Spain become a leader in the wind
energy industry during the last decade? (An analysis of influential factors on the development of wind energy in Spain). In Proceedings of the EWEA Annual Event, Brussels, Belgium, 14–17 March 2011.
[2] Razykov, T.M.; Ferekides, C.S.; Morel, D.; Stefanakos, E.; Ullal, H.S.;
Upadhyaya, H.M. Solar photovoltaic electricity: Current status and future prospects. Sol. Energy 2011, 85, 1580–1608.
[3] UNECE. 2008. Climate Change and Rising Oil Prices: Why Energy
Efficiency in Housing is Crucial?
http://www.unece.org/press/pr2008/08env_p13e.htm. (Accessed April 10, 2013)
[4] [4] Naif.M.A. In: Energy Efficiency Potential in the Building Sector,
The Saudi International Advanced Materials Technologies Conference 2012, KACST, Kingdom of Saudi Arabia, December 3 - 4, 2012
[5] Regulatory Aspects for the Promotion of Renewable Energies and
Energy Conservation in Saudi Arabia, ECRA. http://bit.ly/12PIOkL (accessed April 12, 2013)
[6] De Blas, M.; Torres, J.; Prieto, E.; arc a, A. Selecting a suitable
model for characterizing photovoltaic devices. Renew. Energy 2002, 25, 371–380.
[7] Carrero, C.; Rodríguez, J.; Ramírez, D.; Platero, C. Simple
estimation of PV modules loss resistances for low error modelling. Renew. Energy 2010, 35, 1103–1108.
[8] 14. Zhu, X.-G.; Fu, Z.-H.; Long, X.-M. Sensitivity analysis and
more accurate solution of photovoltaic solar cell parameters. Sol. Energy 2011, 85, 393–403.
[9] Baras, A., Bamhair, W., Alkhoshi, Y., Alodan, M., Engel-Cox, J., 2012.
Opportunities and challenges of solar energy in Saudi Arabia. In: World Renewable Energy Forum, WREF 2012, Including World Renewable Energy Congress XII and Colorado Renewable Energy Society (CRES) Annual Conference, vol. 6, pp. 4721–4726.
[10] Ma, J.; Man, K.L.; Ting, T.O.; Zhang, N.; Guan, S.-U.; Wong, P.W.H.
Approximate single-diode photovoltaic model for efficient I-V characteristics estimation. Sci. World J. 2013, 2013, 230471:1– 230471:7.
[11] Wolf, M.;Rauschenbach, H. Series resistance effects on solar
cell measurements. Adv. Energy Convers. 1963, 3, 455–479.
[12] Van Dyk, E.E.; Meyer, E.L. Analysis of the effect of parasitic
resistances on the performance of photovoltaic modules. Renew. Energy 2004, 29, 333–344.
[13] De Blas, M.; Torres, J.; Prieto, E.; arc a, A. Selecting a suitable model
for characterizing photovoltaic devices. Renew. Energy 2002, 25, 371– 380.
[14] Kennerud, K.L. Analysis of Performance Degradation in CdS Solar
[image:5.595.67.267.67.231.2]Cells. IEEE Trans. Aerosp. Electron. Syst. 1969, AES-5, 912–917. Fig. 10. Simulated effect of temperature to output