1
Basal-Plane Functionalization of
Chemically-Exfoliated Molybdenum Disulfide by Diazonium
Salts
Kathrin C. Knirsch,1 Nina C. Berner,2,3 Hannah C. Nerl,3,4 Clotilde S. Cucinotta,2,4 Zahra
Gholamvand,2,4 Niall McEvoy,2,3 Zhenxing Wang,5,6 Irena Abramovic,1 Philipp Vecera,1 Marcus
Halik,5 Stefano Sanvito,2,4 Georg S. Duesberg,2,3 Valeria Nicolosi,2,3,4 Frank Hauke,1 Andreas Hirsch,1 Jonathan N. Coleman,2,4 and Claudia Backes2,4,*
1Chair of Organic Chemistry II and Institute of Advanced Materials and Processes (ZMP),
Friedrich-Alexander-Universität Erlangen-Nürnberg (FAU), Henkestr. 42, 91054 Erlangen,
Germany.
2Centre for Research on Adaptive Nanostructures and Nanodevices (CRANN), Trinity College
Dublin, Dublin 2, Ireland.
3School of Chemistry, Trinity College Dublin, Dublin 2, Ireland.
4School of Physics, Trinity College Dublin, Dublin 2, Ireland.
5Organic Materials & Devices (OMD), Institute of Polymer Materials,
Friedrich-Alexander-Universität Erlangen-Nürnberg (FAU), Martensstraße 7, 91058 Erlangen, Germany.
6Advanced Microelectronic Center Aachen (AMICA), AMO GmbH, Otto-Blumenthal-Straße 25,
2 KEYWORDS
Transition Metal Dichalcogenides, Layered Materials, Molybdenum Disulfide, Covalent
Functionalization, Basal-plane, Chemical Exfoliation, 1T-polytype
ABSTRACT
Although transition metal dichalcogenides such as MoS2 have been recognized as highly potent
two-dimensional nanomaterials, general methods to chemically functionalize them are scarce.
Herein we demonstrate a functionalization route that results in organic groups bonded to the MoS2
surface via covalent C-S bonds. This is based on lithium intercalation, chemical exfoliation and
subsequent quenching of the negative charges residing on the MoS2 by electrophiles such as
diazonium salts. Typical degrees of functionalization are 10-20 at% and are potentially tunable by
the choice of intercalation conditions. Significantly, no further defects are introduced and annealing
at 350 ºC restores the pristine 2H-MoS2. We show that, unlike both chemically exfoliated and
pristine MoS2, the functionalized MoS2 is very well dispersible in anisole, confirming a significant
modification of the surface properties by functionalization. DFT calculations show that the grafting
of the functional group to the sulfur atoms of (charged) MoS2 is energetically favorable and that
3
Over the last few years, the study of two-dimensional (2D) materials has blossomed into
one of the most exciting areas of materials science.1-7 While this field was originally driven by graphene research, more and more attention is turning to inorganic 2D materials such as MoS2,1
MnO27 and phosphorene.8 This is mainly due to their diversity, their range of interesting properties
and their potential in numerous applications in areas from optoelectronics to catalysis to medicine.
1-7 Currently, the 2D materials generating the most excitement are probably the family of transition
metal dichalcogenides (TMDs) which include members such as MoS2, WSe2 and MoTe2.1, 3
Significant progress has been made on the production of atomically thin, high quality TMDs by
chemical vapor deposition (CVD) growth,9, 10 chemical exfoliation3, 11 and liquid phase exfoliation
in suitable solvents4, 12 or by the aid of surfactants.13, 14 However, unlike the situation with graphene15-17 or even boron nitride (BN),18-20 there are very few reports on covalent
functionalization of TMDs. Typically, functionalization of MoS2 is achieved by ligand conjugation
of thiols at sulfur vacancy sites that were either introduced by ion irradiation21 or naturally occurring after chemical exfoliation.22, 23 Such methods are interesting but clearly limited in their
utility. Up until very recently, no reaction had been reported that allows functionalization of layered
MoS2 on its basal plane without the need of defects. There is no doubt that a general
functionalization route is required as such methods have proven extremely versatile for tailoring
the surface chemistry of nanomaterials. For example, chemical modification of graphene15, 16 or BN19, 20 has greatly facilitated their integration into polymer matrices. In addition, functionalization
can be used to sensitize initially ambipolar materials such as graphene to interact with specific
molecules via the functional entity.24 Furthermore, entirely new materials can be designed by
attaching functional ligands such as photo- or redox-active molecules to the nanomaterial surface.24
With TMDs such as MoS2, the most obvious form of covalent functionalization would be
4
However, the basal plane of TMDs is considered to be rather inert, making such strategies
challenging. Nonetheless, as has previously been shown for BN, aggressive reagents may indeed
functionalize nanomaterials that are considered inert.19, 20 As we show within this manuscript, such a strategy can also be applied to functionalize MoS2. We expect that, once a synthetic protocol to
achieve the functionalization and to characterize the material is established, the foundation will
have been laid for a much broader and richer chemistry on the surface of TMDs.
The first step towards a general route to functionalize TMDs by grafting functional groups
to the exposed sulfur atoms was taken by Chhowalla et al. who presented a functionalization
sequence based on intercalation, chemical exfoliation and subsequent quenching of the negative
charges on the MoS2 by organic halides or other strong electrophiles.25 While the general reaction
sequence is similar to the one used throughout this manuscript, there are notable and important
differences in the procedure. Prior to functionalization, we tested different intercalation conditions
with the goal of generating intercalated and chemically exfoliated MoS2 with as few defects and as
little structural disruption as possible. Herein, we thus show that defects are indeed not required to
achieve functionalization. This also allows us to establish spectroscopic fingerprints to track the
functionalization. We furthermore show that the functionalized MoS2 is highly stable in terms of
its polytype and that surface properties are significantly altered leading to a dramatically enhanced
dispersibility in anisole. DFT calculations shine light on the structure and geometry of the
5 Results and Discussion
Purification and characterization of chemically exfoliated MoS2
Chemical exfoliation of TMDs is generally achieved by reacting the 2D nanomaterials with
n-butyllithium (n-BuLi).3, 11, 26-28 This leads to the formation of a lithium intercalation compound
associated with a widening of the interlayer distance between the individual MoS2 layers and a
charge transfer from n-BuLi to the MoS2 (figure 1). This in turn results in a (usually partial)
structural reorientation of the MoS2 from the thermodynamically more stable, trigonal prismatic,
semiconducting 2H polytype to the octahedral, metallic 1T polytype.3, 11, 26-28 In contrast to intercalated graphene, the resultant material is reasonably stable under ambient conditions and can
be dispersed in water yielding chemically exfoliated CE-MoS2. Mild ultrasonication results in an
almost complete exfoliation down to monolayers. In this study, we have modified the well-known
intercalation procedures to give a material more suitable for subsequent functionalization (3, 11, 26,
28-30 and methods). Usually in the literature, n-BuLi is used in excess (2.5-3 equivalents n-BuLi per
MoS2 formula unit).3, 11, 26, 28, 29 However, as described below, we have found the chemically
exfoliated material produced using these standard conditions to be structurally defective. Since we
explicitly want to develop a basal-plane functionalization of MoS2 that does not require defects,
we have modified this procedure and used excess MoS2 in the intercalation. As we will show, the
thus produced CE-MoS2 is significantly less disrupted and damaged using our modified
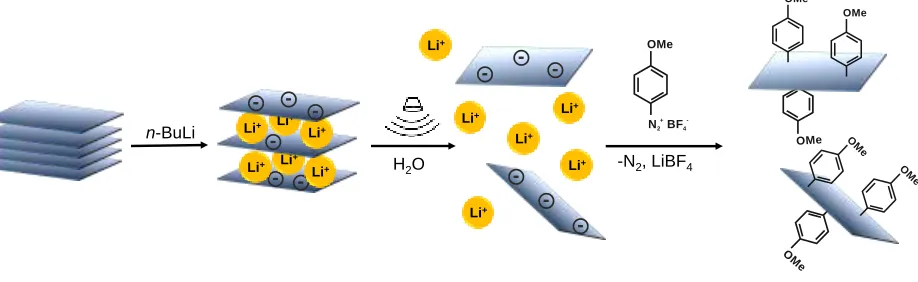
6 Figure 1: Schematic representation of the basal-plane functionalization of MoS2. After
intercalation with n-butyllithium, the negatively charged MoS2 is dispersed in water by mild
bath-type sonication leading to an efficient exfoliation into individual sheets. The charges on the MoS2
are quenched by the addition of 4-methoxyphenyldiazonium tetrafluoroborate obtaining the
functionalized product f-MoS2.
Prior to characterization, purification of the chemically exfoliated MoS2 is essential. In
brief, organic impurities are extracted with n-hexane, while inorganic by-products formed during
the reaction such as LiOH are removed by several centrifugation-based washing cycles with water
(for details see methods and SI section 1). The purified, chemically exfoliated CE-MoS2, prepared
using both standard intercalation procedures (i.e. using excess n-BuLi) and our modified conditions
using excess MoS2, was subjected to X-ray photoelectron spectroscopy (XPS), extinction
spectroscopy, thermogravimetric analysis (TGA), zeta potential and atomic force microscopy
(AFM). While chemically exfoliated MoS2 is commonly described as being predominantly in its
1T polytype, we find that this depends on the experimental conditions chosen for the intercalation.
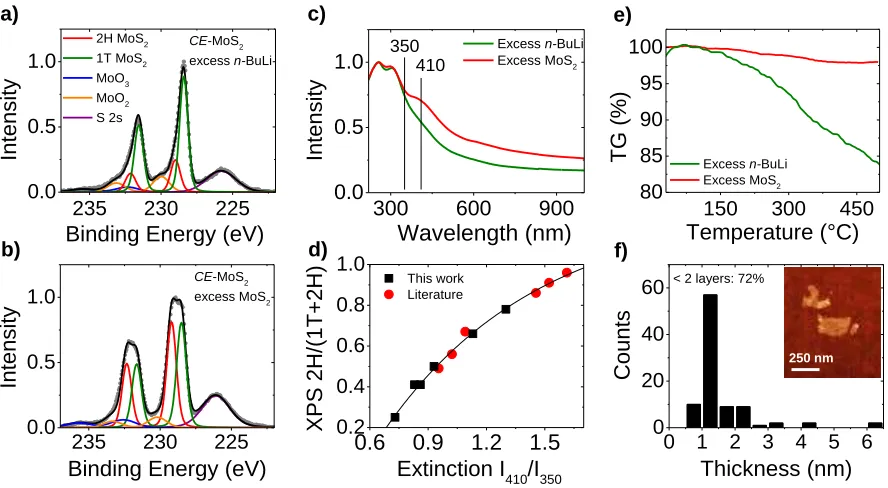
Our intercalation conditions using excess MoS2 yield CE-MoS2 with a lower 1T content as revealed
by the XPS Mo3d core level spectra in figure 2a and b. The Mo3d core level spectra show various
components that can be assigned to the 2H MoS2 doublet at binding energies values of 229.2 eV
Li+
Li+ Li+
O M
e OMe
H2O
N BF2 4 + -OMe
-N2, LiBF4
OMe OM e n-BuLi OMe O M e Li+
Li+ Li+
Li+
Li+ Li
+
Li+
Li+
[image:6.612.80.539.74.215.2]7
and 232.2 eV. Both spectra can be fitted with significant additional components (green curves in
figure 2a and b) shifted to lower binding energies by ~0.8 eV with respect to the main 2H-MoS2
doublets. These components have previously been observed and identified as related to the
1T-phase of MoS2.11 In addition, minor contributions from oxides are detected as indicated by the blue
and orange traces in the figure.31 We further notice that a partial rearrangement to the 2H-polytype occurs more rapidly when using our modified intercalation conditions than in CE-MoS2 produced
from intercalation using excess n-BuLi (section S3.1). This is unfortunate, as it renders any
comparison of the chemically exfoliated precursor system and functionalised MoS2 challenging in
terms of 1T and 2H content, as this means that XPS and functionalization should be conducted the
[image:7.612.80.524.360.604.2]same day.
Figure 2: a,b) Fitted Mo3d XPS core level spectra of CE-MoS2 produced using a) excess n-BuLi
in the intercalation and b) excess MoS2. Fit components are attributed to 2H-MoS2, 1T-MoS2,
MoO2 and MoO3 in both cases as assigned in the figure legend in a). The 1T content is lower in the
case of the chemically exfoliated MoS2 using excess of MoS2 in the intercalation. c) Extinction
spectra normalized to the maximum of CE-MoS2 produced using excess n-BuLi in the intercalation 235 230 225
0.0 0.5 1.0
< 2 layers: 72%
CE-MoS2 excess MoS2
CE-MoS2 excess n-BuLi 2H MoS2
1T MoS2 MoO3 MoO2 S 2s
Intens
ity
Binding Energy (eV)
0 1 2 3 4 5 6 0 20 40 60 Co un ts Thickness (nm)
300 600 900
0.0 0.5
1.0 410
350 Excess n-BuLi Excess MoS 2 Wavelength (nm) In te ns ity
235 230 225 0.0
0.5 1.0
Intens
ity
Binding Energy (eV)
0.6 0.9 1.2 1.5
0.2 0.4 0.6 0.8 1.0 This work Literature XPS 2H/(1T+2H )
Extinction I410/I350
150 300 450 80
85 90 95 100
Excess n-BuLi Excess MoS2
8
and excess MoS2, respectively. The spectral shape is different in both cases clearly showing
residual excitonic transitions of 2H-MoS2 in CE-MoS2 produced using excess MoS2. This suggests
that peak intensity ratios from extinction spectra can be used as metric for the 2H/1T content. d)
Plot of 2H/1T ratio determined from fitting the XPS Mo3d core level spectra as a function of
extinction peak intensity ratio at 410 nm/ 350 nm. Red data points are extracted from reference 11.
The line represents an empirical asymptotic fit. e) Thermogravimetric weight loss of CE-MoS2
produced using excess n-BuLi in the intercalation and excess MoS2, respectively. The significant
weight loss of CE-MoS2 produced using excess n-BuLi indicates the presence of defects. f) Atomic
force microscopy thickness histogram after drop-casting the CE-MoS2 produced using excess
MoS2 onto Si/SiO2 wafers. 72 % of the nanosheets are < 2 layers with an apparent thickness <1.5
nm. Inset: representative AFM image.
However, we have realized that XPS is not the only technique which can be used to
determine the 2H/1T ratio of CE-MoS2. In addition, UV-Vis extinction spectra, as displayed in
figure 2c, show marked differences between the two types of CE-MoS2. The extinction spectrum
of 1T MoS2 is characterized by two transitions at 255 nm and 307 nm.11 However, excitonic
transitions associated with two sets of excitons are typically observed in 2H MoS2. These are
centered between 350 and 470 nm (D and C-exciton) and 580 and 680 nm (B and A-exciton),
respectively.32 These excitonic transitions are also faintly discernible in the extinction spectra of intercalated CE-MoS2 when the material has a higher 2H-polytype content but are absent in the CE-MoS2 with a high 1T content. Particularly striking is the shoulder centered at 410 nm as
indicated in figure 2c.
Such spectral changes can be expressed as peak intensity ratios, as we have previously
shown for 2H-MoS2.14 We therefore suggest that such a peak intensity ratio can also be used to
quantify the 2H/1T ratio in CE-MoS2. To test this, we determined the 2H/1T ratio according to
9
We plot the 2H/1T content as a function of peak intensity ratio in figure 2d. We chose the peak
intensity ratio at 410 nm (strong contribution from 2H MoS2) to 350 nm (strong contribution from
1T MoS2, local minimum in 2H) as potential metric ratio. We find a very well defined relationship
relating the 2H/1T ratio (expressed as 2H/(2H+1T)) to the intensity ratio I410/I350 according to
equation 1:
2𝐻
2𝐻+1𝑇= 1.29 − 2.562 ∗ 0.287𝑥 (1)
Where x is the extinction intensity ratio
Importantly, data extracted from the literature11 falls on the same curve strongly suggesting that this peak intensity ratio based in the extinction spectra can indeed be used as a metric to
quantitatively determine the 2H/1T polytype content of CE-MoS2. This will be important for the
analysis of the functionalised material further down below (also see SI section 3.5).
As already mentioned above, we nonetheless consider the chemically exfoliated MoS2
produced from our modified intercalation conditions using excess MoS2 to be a better precursor
for the subsequent functionalization than the material produced from using excess n-BuLi, as the
latter is structurally less intact. This is best visualized from the thermogravimetric analysis
presented in figure 2e. The CE-MoS2 using our modified reaction conditions
(2H/(2H+1T)=0.5-0.6) only shows a minor weight loss of 2 % in the temperature range of 25-500 ºC compared to >15
% in the case of intercalation using excess of n-BuLi (2H/(2H+1T)=0.25). This suggests a
significant disruption of the MoS2 structure when using excess n-BuLi (also see SI figure S3.2) in
the intercalation. Transmission electron microscopy (TEM) analysis confirms that considerable
10
our aim is to functionalize MoS2 which is as structurally perfect as possible, we intercalate using
excess MoS2 throughout the remainder of this study.
We anticipate that an efficient functionalization using electrophiles will depend on two
factors: the negative surface charge residing on the MoS2 and the available surface area which
depends on the degree of exfoliation. Measurement of the zeta potential to be -48 mV (SI figure
S2.2) shows that the MoS2 nanosheets are indeed negatively charged. The degree of exfoliation
was estimated using atomic force microscopy (figure 2f for representative image) after drop-casting
the dispersion on Si/SiO2 wafers. This showed that 72 % of the chemically-exfoliated nanosheets
displayed an AFM height of <1.5 nm consistent with mono-and bilayered species (see histogram
in figure 2f).11, 33, 34 The mean length of the nanosheets was determined to be 180 nm with a length/width ratio of ~2. The degree of exfoliation in our chemically exfoliated MoS2 is slightly
lower than in some cases reported in literature.11, 35 However, a direct comparison with literature is not possible, as the degree of exfoliation of CE-MoS2 in water depends on a number of factors such
as MoS2 starting material, details of sonication and purification and potentially the intercalation
conditions. Importantly, the degree of exfoliation using our modified intercalation conditions is
similar to that obtained from intercalation using the standard conditions when applying identical
purification and sonication protocols (SI section 3.4). We thus conclude that our exfoliated CE
-MoS2 produced from the modified, much milder intercalation conditions is an ideal precursor for
11 Functionalization of CE-MoS2
Since MoS2 has long been considered to be unreactive and almost inert even after
intercalation, we have chosen very aggressive electrophiles, namely diazonium salts (in this case
4-methoxyphenyldiazonium tetrafluoroborate) to quench the negative charges on the MoS2 and
functionalize the material. Diazonium salts have extensively been used in carbon allotrope
functionalization and represent a versatile and rich class of suitable electrophiles for reaction with
MoS2.17, 36-38 After addition of the diazonium salt, we observe an immediate precipitation of black
powder from the yellowish-brown dispersion in water, pointing to an efficient quenching of the
charges. As we will show below, this is accompanied by a basal-plane functionalization of MoS2
to generate f-MoS2. Our XPS analysis strongly suggests that partial negative charges on the S in
the CE-MoS2 are neutralized by the addition of the cationic electrophile resulting in the formation
of a S-C bond. Owing to the high degree of exfoliation of the CE-MoS2 precursor, both sides of
the nanosheets are accessible for potential functionalization in dispersion. However, as we also
show, this is not a prerequisite for the functionalization, as it can also be achieved after deposition
on a substrate (SI section 7.3).
Bulk characterization of functionalized MoS2
The immediate flocculation of MoS2 after addition of diazonium salt due to the quenching
of the charges residing on the nanosheets is confirmed by zeta potential measurements (figure
S4.1). These show that by 2 min after addition of the diazonium salt, the zeta potential increases
from -48 mV to 0. The resultant powder was filtered, washed with water and isopropyl alcohol,
and dried before being subjected to thermogravimetric analysis coupled to mass spectrometry
12
Thermogravimetry showed no mass loss below 220 °C followed by a 7 % mass reduction
in the temperature range 220-450 °C (figure 3a). As small, van der Waals bonded molecules tend
to desorb from surfaces below 200 °C,39 this suggests the mass loss to be associated with species which are strongly bonded to the surface or intercalated between restacked sheets.40 To test whether
the mass loss is due to diazonium salt trapped between restacked layers or noncovalently adsorbed
on the MoS2, we performed reference experiments using liquid exfoliated12 uncharged MoS2 (SI
section 6). No significant weight loss was observed in the reference experiments confirming that
physisorption and trapping between restacked MoS2 nanosheets is negligible. Significantly,
thermogravimetric analysis coupled to mass spectrometry (TGA-MS) allows the association of the
moieties which had thermally detached from the functional group or its fragments, respectively
(figure 3b). Five main mass fragments with m/z = 107, 108 (methoxybenzene), m/z = 77, 78
(benzene) and m/z = 39 (doubly charged benzene ring) were detected peaking at 360 °C clearly
evidencing that the mass loss is due to the detachment of the functional group. Assuming that the
weight loss in this temperature regime stems from the functional group itself, we use the associated
mass loss of 7 % to determine that every 10th MoS2 unit bears ~1 functional moiety, i.e. the bulk
13 Figure 3: a) Thermogravimetric weight loss of the untreated MoS2, the CE-MoS2 and the material
after functionalization. The weight loss of 6.7% in the temperature regime of 220-450°C
corresponds to a bulk degree of functionalization of 10% per MoS2 unit. b) Detected mass
fragments of f-MoS2 corresponding to methoxybenzene (m/z 107, 108), benzene (m/z 39, 77, 78)
evidencing that the mass loss in the temperature range of 200-450°C is due to grafting of the
functional group. c, d) Raman spectra (633 nm excitation, average of 250 individual spectra) of the
MoS2 reference, CE-MoS2 and f-MoS2 normalized to the A1g mode at 404 cm-1 (offset for clarity).
Figure legend as in a). c) Spectra measured at 30 °C. The second order longitudinal acoustic phonon
(2LA(M) at 450 cm-1) appears decreased in the f-MoS2. d) Spectra measured at 450 °C. e) Plot of
the Raman intensity ratio of the A1g mode to the 2LA(M) mode of the MoS2 reference, CE-MoS2
and f-MoS2 as a function of temperature. The reference and the CE-MoS2 follow a very similar
trace, while the f-MoS2 deviates significantly at temperatures below 220 °C exhibiting a higher
A1g/2LA(M) ratio. This suggests that this peak intensity ratio can be used as indicator for successful
functionalization, f) FTIR spectrum (measured in diffuse reflectance mode with CsI as matrix) of
f-MoS2. The vibrational modes of the functional group can be clearly identified. In addition, a
vibration at 695 cm-1 is detected that can be assigned to a S-C stretching vibration.
a) b) c) d) e) f)
150 300 450 90 92 94 96 98 100 ref. CE-MoS 2
f-MoS2
TG (%)
Temperature (°C)
2000 1000 f-MoS2
Tran
sm
itt
an
ce
Wavenumber (cm-1)
200 400 600
(S-C) (aryl) (CO) aromatic C=C * 450°C 450
Raman Shift (cm-1)
Intensi
ty
404 30°C
150 300 450 90 92 94 96 98 100 Ion Cu rrent (10 -12 A ) TG (%) Temperature (°C)
200 400 600
Intens
ity
Raman Shift (cm-1)
150 300 450 2
4
6 ref. CE-MoS
14
Since Raman spectroscopy is a commonly used and powerful tool in nanomaterial
characterization, we reasoned that Raman spectra may contain information on the
functionalization. The Raman spectrum of MoS2 when excited off resonance (e.g. = 532 nm) is
quite well understood and characterized by two main phonon peaks (the A1g at 404 cm-1 and E12g
mode at 380 cm-1). However, when resonantly excited with a red laser (633 nm), a number of
second order modes are observed and the spectrum is rich in additional features that are not fully
understood10, 41-45 (for a detailed discussion see SI section 4.2.1). We can nonetheless use the
Raman spectrum to trace differences between the MoS2 reference powder, the chemically
exfoliated precursor and the f-MoS2. Low temperature spectra (30°C) are displayed in figure 3c.
The spectra are the mean of 250 individual spectra acquired on the respective powder to account
for local sample inhomogeneity and changes of the laser focus. Two notable differences between
the samples are observed: firstly, the J1-J3 phonon modes (170-300 cm-1) attributed to the 1T phase
of MoS246 are clearly discernible in the chemically exfoliated material, while basically absent in
the f-MoS2 and the powder reference. However, at elevated temperatures, they also appear in the
f-MoS2 (figures S4.3 and S4.4) suggesting that they are suppressed in the room temperature spectrum
of f-MoS2 even though the MoS2 is still in its 1T conformation. The second pronounced change in
the low temperature Raman spectra is the intensity ratio of the A1g mode at 404 cm-1 to the 2LA(M)
mode at 450 cm-1. (NB: The peak at 450 cm-1 contains multiple components. But for the sake of simplicity we refer to it as the 2LA(M) mode.) This intensity ratio is significantly higher in the
functionalized sample compared to the chemically exfoliated precursor and the starting powder
suggesting that the 2LA(M) mode is also suppressed in f-MoS2. To confirm that this change in
intensity ratio is attributed to the functionalization, we performed temperature dependent Raman
spectroscopy monitoring the evolution of the Raman spectra (mean of 250 spectra each) when
15
°C, figure 3d) all features attributed to the 1T polytype have disappeared and the spectra of
reference, chemically exfoliated and functionalised MoS2 are identical suggesting that no
permanent harm to the lattice was done by intercalation and functionalization.
To test whether the intensity ratio A1g/2LA(M) is indicative for functionalization, we plot
this ratio as a function of temperature in figure 3e. Both the CE-MoS2 and the reference powder
follow a similar trace (even though there are differences when looking at individual components
as discussed in the SI section 4.2.3). Significantly, the f-MoS2 exhibits a higher A1g/2LA(M)
intensity ratio for temperatures up to 220 °C. This coincides with the temperature where the
cleavage of the functional group starts according to TGA-MS. We thus propose that this intensity
ratio can indeed be used as an indicator for the functionalization of MoS2. However, we note that
a detailed understanding is beyond the scope of this manuscript.
The presence of the functional group is further evidenced by IR spectroscopy (figure 3f).
The pattern of the aryl bending mode at ~880 cm-1 suggests a 1,4-substitution pattern on the benzene ring consistent with anchoring of the functional group in para position to the
methoxy-group.47 Most importantly, a vibration at ~695 cm-1 is observed which can be assigned to a S-C stretching vibration strongly suggesting the functional group to be anchored to S atoms of the
MoS2. In addition, we note that no characteristic N2+ vibration (expected at 2,300 cm-1) of the
diazonium salt precursor is detected. This indicates that physisorption or intercalation of the
precursor salt only occurs to a very minor extent and is not detectable. Annealing at 500 °C to
remove the functional groups showed the IR spectra of both f-MoS2 and CE-MoS2 to return to that
of the MoS2 starting powder (figure S4.6). This evidences that the functionalization is fully
reversible and the intact MoS2 can be restored further supporting the conclusion from the Raman
16 X-ray photoelectron spectroscopy (XPS)
The data presented above clearly provides evidence for successful grafting of the functional
group to the MoS2 scaffold. IR spectroscopy suggests the formation of a C-S bond. However, IR
alone cannot provide unambiguous proof for a covalent functionalization. We have therefore turned
to X-ray photoelectron spectroscopy to distinctively probe the chemical environment of the Mo
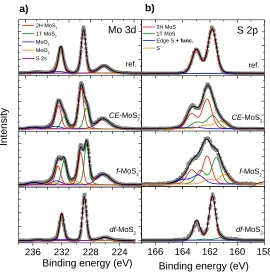
and S, respectively. The fitted Mo3d and S2p core level spectra of the MoS2 reference powder, the
CE-MoS2 precursor, the f-MoS2 and the defunctionalized material (after annealing, df-MoS2) are
presented in figure 4. We note that we did not observe any other elements in the survey spectra
than Mo, S, C and O (SI table S1).
Both S2p and Mo3d core level spectra (figure 4) show the CE-MoS2 and f-MoS2 to be a
mixture of 1T- and 2H-MoS2. Accordingly, the 1T phase was preserved during the
functionalization. We note that the 2H/1T ratio of the CE-MoS2 precursor and the f-MoS2 is
slightly different. While the 2H/1T ratio of f-MoS2 according to the Mo3d core level spectra is
0.45, we determined a value of 0.66 in case of the CE-MoS2 (see supporting information table S1).
We note that our extinction spectra 2H/1T metric suggests that the 2H/1T ratio of the chemically
exfoliated precursor at the time the functionalization was performed was 0.45 (SI section 3.5).
However, XPS on the CE-MoS2 was acquired one week later and structural rearrangement to the
2H-polytype had already occurred. While this relatively quick partial rearrangement from 1T to
2H-polytype using our milder, modified intercalation conditions is unfortunate, we nonetheless
found the benefits from this modified intercalation (such as lower defect content) to be beneficial
over the standard literature conditions when it comes to studying functionalization. Furthermore,
the results suggest that the 1T-polytype is stabilized by the functionalization, as no rearrangement
17 Figure 4: From top to bottom: Fitted XPS core level spectra of the MoS2 powder, chemically
exfoliated CE-MoS2 (produced from using excess MoS2 in the intercalation), functionalized
f-MoS2 and defunctionalized df-MoS2 (after annealing). a) Mo3d core level, b) S2p core level. The
reference is perfectly consistent with 2H-MoS2, while intercalation yields a mixture of 2H- and
1T-MoS2 (with a very minor contribution stemming from oxides as indicated by the orange and blue
fit lines in the Mo3d core level). Functionalization gives rise to a component at higher binding
energies in the S2p core level spectra. The 2H/1T ratio of CE-MoS2 and functionalized f-MoS2 is
different due to rapid rearrangement of 1T-MoS2 from our intercalation using excess MoS2 (see
SI). The degree of functionalization estimated from the integrated areas of the individual
components in the S2p core level spectra is consistent with the 10 % calculated from TGA. After
annealing, the MoS2 is restored to its pristine 2H polytype.
After annealing, the pristine 2H-MoS2 is completely recovered, consistent with the
observation from IR and Raman spectroscopy. While no differences in the Mo3d core level spectra
are observed (other than varying 2H/1T contents), the S2p core level spectra are distinct in CE
-236 232 228 224
Binding energy (eV) Mo 3d
Int
ensity
2H MoS2
1T MoS2
MoO3
MoO2
S 2s
CE-MoS2
df-MoS
2
f-MoS2 ref.
166 164 162 160 158
Binding energy (eV)
f-MoS2
CE-MoS2 ref. 2H MoS
1T MoS Edge S + func.
S
-df-MoS2
S 2p
[image:17.612.77.347.79.353.2]18
MoS2 and f-MoS2 (figure 4b). The S2p core level spectra of the CE-MoS2 can be fitted with four
components: 2H-MoS2, 1T-MoS2, a species previously observed in surfactant-exfoliated 2H-MoS2
associated with edges of the flakes (shifted by ~0.7 eV to higher binding energies relative to
2H-MoS2)14 and a component at lower binding energies (~1.2 eV relative to 2H-MoS2) most likely
stemming from electron-rich sulfur from the electron transfer of n-BuLi during the intercalation.
In the functionalized f-MoS2, the electron-rich sulfur species at lower binding energies decreases
in favor of a significantly increased percentage of the “edge-S component” at higher binding
energies. This is more pronounced for material obtained from intercalation using excess n-BuLi,
SI section 7.1. This strongly suggests that any (partial) charges on the sulfur atoms of the
chemically exfoliated CE-MoS2 are neutralized by grafting of the functional groups to the sulfur
atoms as observed in zeta potential measurements. We can use the integrated areas of the fit
components to estimate the degree of functionalization on the basis of XPS. In the CE-MoS2, 4 %
of the total sulfur component is attributed to the edge component sulfur at higher binding energies.
In turn, in the functionalized f-MoS2, the latter is increased to 15 %. The degree of functionalization
can thus be determined to be 11 % per sulfur atom. This coincides with the degree of
functionalization obtained from TGA-MS (10 % per MoS2 unit). Nominally, this appears
contradictory, as XPS probes the degree of functionalization on the S atoms, while TGA yields
values related to the MoS2 unit. However, since S atoms bridge the Mo atoms, if every 10th MoS2
unit bears a functional group, this also means that roughly every 10th sulfur is functionalized. We
would like to emphasize that the experimentally observed degree of functionalization of 10% can
only be achieved if the functionalization occurs at the basal plane rather than edge sites only.
However, it is currently unclear whether edge sites are also affected, or even preferentially
19
We note that a basal plane functionalization of MoS2 involving the formation of S-C bonds
after intercalation-based activation of the MoS2 differs significantly from recent functionalization
routes,22, 23 where S vacancies were filled by coordinating thiols to chemically-exfoliated MoS2.
We are convinced that our route has significant advantages, as it is not limited by the presence of
such vacancies and can be applied even to MoS2 of the highest quality. In addition, the
functionalization by forming a covalent bond is in marked contrast to the formation of intercalation
compounds from chemically exfoliated MoS2.This is further illustrated by wide angle X-ray
diffraction confirming the absence of 00l reflections in the f-MoS2 (figure S4.8) and the absence of
long range order along the c-axis in contrast to intercalation compounds (see ref26 and references
therein).
Dispersibility and structural integrity of the lattice
An important point of the functionalization of nanomaterials in general is the alteration of
the surface properties due to the attachment of functional moieties. This is expected to change the
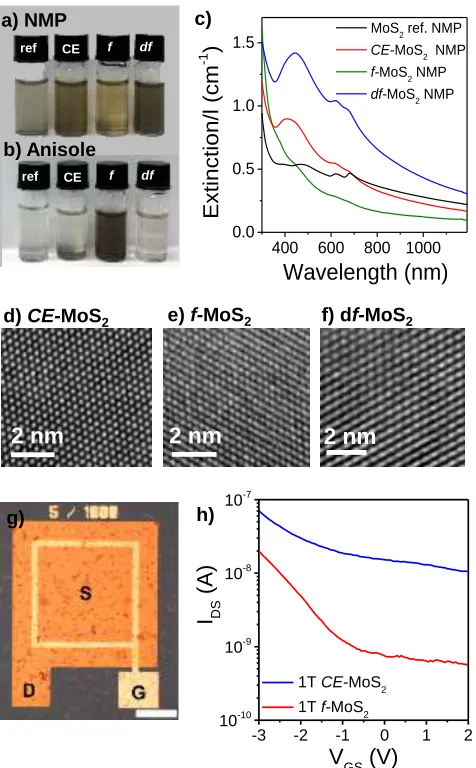
surface energy of the nanomaterial and as a consequence its dispersibility.48 To test this, we have dispersed the MoS2 reference powder, the CE-MoS2, f-MoS2 (both after filtration and drying) and
the defunctionalized df-MoS2 in N-methyl-2-pyrrolidone (NMP) and anisole. NMP is known to be
a good solvent for MoS2 with surface energies and solubility parameters matching those of the
nanomaterial.12, 48, 49 In turn, anisole (methoxybenzene) is chemically well-matched to our
functional group. Photographs of the dispersions obtained after mild bath sonication (20 min) and
centrifugation at 500 rpm (28 g) are depicted in figure 5a and b. We note that the MoS2 powder is
not a suitable reference for the dispersibility study, as it has a significantly different morphology.
20
more energy would be required to efficiently disperse the powder even in good solvents such as
NMP. However, for this study, we wanted to keep the sonic energy input to a minimum to avoid
potential defunctionalization due to strong local heating during sonication. As expected, the
dispersibility of f-MoS2 is significantly altered: compared to the defunctionalized material, the
concentration of dispersed f-MoS2 is lower by approximately a factor of three. In turn, f-MoS2 is
well dispersible in anisole unlike the chemically exfoliated and defunctionalized MoS2. This
suggests that a degree of functionalization of 10% is already sufficient to significantly alter the
surface energy of the MoS2. In addition, this indirectly evidences that the basal plane is reasonably
homogeneously decorated with a neutral functional moiety. If a charge transfer complex between
diazonium reagent and CE-MoS2 was formed, no such enhanced dispersibility in anisole would be
expected.
The extinction spectra of the NMP dispersions are displayed in figure 5c. The spectrum of
the MoS2 powder is consistent with bulk 2H-MoS2 showing the characteristic excitonic
transitions.12, 14, 32 The spectrum of the defunctionalized material resembles that of very small
2H-MoS2 nanosheets14, 50 in analogy to spectra obtained from annealed intercalated MoS2.11 The
spectrum of the redispersed CE-MoS2 resembles a mixture of 2H- and 1T-MoS2.11 Since the C-
and D excitonic transitions centered at 450 nm are slightly better resolved than in the initial
chemically exfoliated material in water (figure 2c), we suspect that local heating in the
sonication-based redispersion resulted in a partial reconstruction of the 1T- to the 2H-phase. Most
interestingly, all excitonic transitions are suppressed in the functionalized material so that optical
extinction spectroscopy provides a very quick tool to determine whether functionalization was
successful. This also further confirms that the electronic structure of f-MoS2 is significantly
different from chemically exfoliated or non-functionalized MoS2. A more detailed discussion of
21 Figure 5: a,b) Redispersion of MoS2 powder, CE-MoS2, functionalized f-MoS2 and
defunctionalized df-MoS2 in a) N-methyl-2-pyrrolidone (NMP) and b) anisole. Intercalated and
defunctionalized MoS2 are well dispersible in NMP, while the f-MoS2 is dispersible in anisole
opposed to the intercalated and defunctionalized counterparts evidencing a change in solubility
parameters due to the functionalization. c) Extinction spectra of the dispersions shown in a) (after
mild centrifugation at 500 rpm). Notably, all excitonic transitions are suppressed in f-MoS2. d-f)
High resolution transmission electron microscopy (TEM) of the drop-casted dispersions in a)
showing the intact lattice of d) CE-MoS2, e) f-MoS2 and f) df-MoS2. g,h) Electrical characterization
of network devices. g) Device image with source, drain, and gate electrodes indicated with S, D,
and G. The scale bar is 100 µm. The channel length and width of the device are 5 µm and 1000
µm. h) The device transfer curves before and after functionalization. Current on/off ratio increases
from 6.7 (before) to 36.1 (after), indicating an enhancement in the semiconducting property.
ref CE f df
a) NMP
b) Anisole
400 600 800 1000 0.0 0.5 1.0 1.5 Extinction/l (cm -1 ) Wavelength (nm) MoS2 ref. NMP
CE-MoS2 NMP f-MoS2 NMP
df-MoS2 NMP c)
ref CE f df
-3 -2 -1 0 1 2 10-10 10-9 10-8 10-7 I DS (A)
VGS (V) 1T CE-MoS2 1T f-MoS2 d) CE-MoS2 e) f-MoS2 f) df-MoS2
h) g)
[image:21.612.76.314.71.455.2]22
To confirm that our subsequent intercalation and functionalization sequence does not
structurally harm the MoS2 lattice, we performed a series of high resolution transmission electron
microscopic investigations on the MoS2 reference powder, CE-MoS2, f-MoS2 and the
defunctionalized material (figure 5d-f and SI figure S5.5). For this purpose, grids were cast from
the NMP dispersions after mild sonication and centrifugation. We note that, in all cases, the MoS2
is only reasonably well exfoliated and appears as reaggregated agglomerates of formerly
individualized nanosheets (see AFM figure 2f and TEM SI figure S3.3). This is attributed to the
very gentle redispersion and centrifugation conditions that were chosen to avoid any structural
changes of the chemically exfoliated and functionalized MoS2. Because of that, many small patches
were frequently observed on the basal plane of the redispersed material (center images in S5.5).
However, apart from that, the lattice is intact over wide regions (figure 5d-f) showing that no severe
structural damage to the MoS2 was induced by our functionalization sequence. We note that an
analysis of 2H and 1T polytype content from bright field images is extremely challenging51 and
beyond the scope of the manuscript.
Functionalization after intercalation with excess n-BuLi
The intercalation conditions with excess MoS2 have proven to be ideal for establishing the
characterization protocols to trace the subsequent basal plane functionalization. However, this CE
-MoS2 has the disadvantage of undergoing a rather rapid rearrangement from its 1T polytype to its
2H polytype. It is therefore very challenging to compare, for example, electrical properties of
f-MoS2 to the CE-MoS2 precursor, as the 2H/1T ratio may vary. Given that the functionalization
stabilizes the 1T-phase, which is known to be metallic in chemically exfoliated MoS2, it is
23
functionalization of 1T CE-MoS2 from intercalation using excess n-BuLi. A detailed
characterization is presented in the supporting information (section 7). The XPS analysis shows
that only very minor 2H/1T rearrangement occurs within one month (SI section 7.1). The initial
1T:2H ratio was determined to be ~4 (via Mo3d core level X-ray photoelectron spectra, table S2).
Thus, both chemically and functionalized MoS2 can be considered to be predominantly 1T MoS2.
XPS furthermore suggests that the degree of functionalization is 20%.
To test the electrical characteristics of 1T CE-MoS2 and 1T f-MoS2, we have fabricated
field-effect transistors (FETs) based on self-assembled monolayers (SAMs) using region-selective
deposition of the chemically exfoliated MoS2. This technique has previously been applied for
electrical characterization of functionalized carbon allotropes and is described in detail
elsewhere.52, 53 In brief, the network devices were produced by immersing pre-patterned chips
covered with a positively charged SAM in the channel region
(3-methyl-1-(12-phosphonododecyl)imidazolium bromide) in an aqueous dispersion of the 1T CE-MoS2. Due to
Coulombic attraction, 1T CE-MoS2 nanosheets are selectively deposited in the channel region
(figure 5g).54 The network transistor of the chemically exfoliated MoS2 is difficult to turn off and
shows on/off ratios of ~ 7 due to the metallic nature of 1T-MoS2. After testing, the device was
soaked in an aqueous solution of the diazonium salt for 5 min. Successful functionalization was
confirmed by Raman spectroscopy (figures S7.4 and S7.5). The transistor showed a clear
improvement in on/off ratios (up to ~36) suggesting that the f-MoS2 exhibits semiconducting
properties even though the 1T-polytype is maintained (figure 5h). The device exhibits a typical
p-type characteristic which could be due to the electrostatic doping from the SAM layer underneath.54
24
functionalization. However, we have to note that the decrease is not pronounced at all and the
electric property of the network transistor is largely preserved.
Modelling
In order to gain further insights in the structure and bonding in the functionalized MoS2, we
have performed density functional theory calculations (DFT). We propose a reaction model
implying dissociative chemisorption of n (number of molecules) 4-methoxyphenyldiazonium
cations on a MoS2 surface with net charge of | |e n, producing the release of n N2 molecules. To
test whether steric hindrance may occur for degrees of functionalization of 20% per MoS2 unit,
functionalized surfaces with low and high coverage have been modelled being equivalent to
grafting one or four molecules (n = 1 or 4) per MoS2 unit cell, respectively.
The reaction energy is evaluated as
2 2
react [ MoS cat] [ funct N ]
E E nE E nE
where, n is the number of chemisorbed molecules, EMoS2 and Efunct are the energies of the clean and
the functionalized surfaces, respectively and Ecat and EN2 are the energies of the isolated cation
and the released N2 molecule. The reaction is largely energetically favorable, with a reaction energy
of Ereact= 2.33 eV per molecule at low coverage. At high coverage, the reaction energy per molecule
becomes even larger. We note that this reaction energy is much larger than calculated adsorption
25
that, even though physisorption may occur, the reaction is thermodynamically driven towards a
covalent functionalization. This agrees well with our experimental data from TGA-MS showing
that the mass fragments attributed to the functional group are detected in a temperature range of
270-450°C with only traces being detected at lower temperatures where physisorbed species would
be expected.
After geometry relaxation, the 1T-MoS2 monolayer shows a 2 × 1 reconstruction, known as
1T’ phase (see SI section 8). In the charged MoS2 parent system, we observe a bidental Mo-S bonds
distribution (centered around 2.42 Å and 2.48 Å, respectively). This structure relaxes after
functionalization in such a way that all Mo-S bonds are distributed around an average Mo-S bond
length of 2.45 Å. The grafted molecule is approximately perpendicular to the surface (92.8º) (figure
6, bottom right) and the dihedral angle between molecular plane and (100) surface is 30.22º (figure
6, bottom left). The analysis of the electronic structure of the clean and functionalized monolayer
26 Figure 6: Top: Ball and stick representation of the functionalized monolayer with high coverage.
Red, blue, yellow, pink and white balls represent O, C, S, Mo and H atoms, respectively. The dotted
area reproduces the total electronic charge (isosurface with a contour level of 0.8 electrons). The
two (001) planes (perpendicular to z axis) depict volume slices of the total electronic charge on Mo
(below) and S (above) surfaces. (010) plane is also highlighted by a transparent slice. The position
of this plane along y axis is highlighted by the thin grey line perpendicular to (001) plane,
corresponding to where S-C bonds lie. Red and blue on the planes indicate high and low charge
values, respectively. Bottom left: Tilt angle between y and molecular axis. Bottom right: Dihedral
angle between molecular plane and (100) surface. In both panels the molecule is schematically
sketched and the electron charge on the reference grafting S plane at low coverage is also
represented. Y axis is represented in top and bottom right insets by a grey line lying on the (001)
plane. In bottom left inset, red, green and blue lines represent x, y and z axis, respectively.
The analysis of the Bader charges56 of the clean (uncharged and non-functionalized) MoS 2
system show a charge polarization with S atoms bearing partial negative charges and Mo atoms
27
added to the overall neutral system (such as experimentally achieved after intercalation with
n-BuLi), these distribute over the external S atoms. This is rather important, as a chemical reaction
with a positively charged reagent is likely to occur on the negatively charged reaction site, i.e. the
S atoms. The Coulombic attraction between the negatively charged S surfaces and the positively
charged diazonium reagent also accounts for the spontaneous reaction experimentally observed and
the strongly negative reaction energy. Our calculations confirm that S-C chemical bonds are
formed. The C atom grafted to the surface withdraws 0.15 |e| from its neighbor S, which is about
0.2 |e| less charged than the other surface S atoms. A very similar picture is observed when the
coverage is higher (figure 6, top).
This clearly confirms the experimental observations that basal-plane functionalization on the
S atoms of chemically exfoliated MoS2 is readily accessible by reaction of CE-MoS2 with strong
electrophiles such as diazonium salts.
Conclusion
In conclusion, we have demonstrated a novel functionalization sequence for transition metal
dichalcogenides such as MoS2. The functionalization is based on reacting intercalated,
chemically-exfoliated MoS2 with electrophiles such as diazonium salts. The use of chemically-exfoliated MoS2
is beneficial due to the good exfoliation in water making both sides of the nanosheets accessible.
This yields typical degrees of functionalization of 10-20 at%. The successful functionalization was
evidenced by zeta potential measurements, IR, Raman and extinction spectroscopy, TGA-MS and
XPS.
The basal-plane functionalization is fully reversible and annealing restores predominantly
28
functionalization furthermore yields f-MoS2 with different surface properties or surface energies
which is reflected in an enhanced dispersibility in solvents that are compatible with the functional
group. In the functionalized MoS2, the 1T-polytype that is typical for intercalated MoS2 is
maintained and even stabilized. However, in contrast to intercalated 1T-MoS2 which is known to
be metallic, f-MoS2 exhibits semiconducting properties as concluded from electrical
characterization of network transistor devices before and after functionalization. DFT calculations
show that the reaction is energetically very favorable and that a S-C bond is formed.
We believe this work is important, as it establishes spectroscopic fingerprints of covalently
functionalized MoS2. We also show that this method is intrinsically not reliant on the presence of
defects or vacancies and so can potentially be applied to high-quality nanosheets. In addition, the
method is versatile, with functionalization achievable both in solution and for nanosheets deposited
on surfaces. Importantly, this approach is not limited to MoS2 but is applicable to any TMD (or
indeed any layered compound) which can be intercalated with lithium. We anticipate that this
ability to easily functionalize TMDs is only the first step toward the development of secondary
functionalization routes leading to the bonding of complex molecular systems to the nanosheet
surface.
Methods
Sample preparation: More details on materials and methods are presented in the SI.
Synthesis of diazonium compound: In a 500 mL three neck flask equipped with a stir bar, gas outlet
and a dropping funnel 10 g (81 mmol) p-anisidine were suspended in 250 mL water. 6 g (89 mmol)
29
50 mL (36 g, 48 wt% in H2O, 200 mmol) tetrafluoroboric acid yielded the crude product as fine
white needles. After washing, it was recrystallized from diethyl ether.
Intercalation/Chemical exfoliation: Under argon atmosphere 1.5 mL n-BuLi (2.0 M) in
cyclohexane was added to 1.5 g (9.4 mmol) MoS2. After the addition of 10 mL of dry hexane as
solvent, the dispersion was heated to 65 °C overnight. 100 mL distilled water was added to the
cooled reaction mixture under hydrogen evolution. After the decrease of the gas formation, organic
impurities were removed by extraction with hexane (two times), the aqueous phase was collected.
A portion of the concentrated black aqueous phase was diluted further with distilled water to obtain
a yellowish-brown dispersion which was bath-sonicated for 20 minutes at 50 °C and
pre-centrifuged at 750 rpm (62 g) for 1:30 h at 20 °C in order to remove non-exfoliated material as
sediment. Four further centrifugation steps at 14 krpm (21,475 g, 1:30 h, 20 °C) removed very
small MoS2 material and LiOH generated during the reaction as supernatant. After each high speed
centrifugation step, the sediment was collected with fresh distilled water shaken by hand and
subjected to the next centrifugation step. After the washing procedure the final sediment was
redispersed in distilled water by bath sonication (30 min, 50 °C) yielding a highly stable dispersion.
To obtain CE-MoS2 predominantly as 1T polytype, 1.5 g MoS2 and 15 mL n-BuLi (2.0 M) were
used for intercalation. The material thus obtained is denoted as 1T CE-MoS2. Unless otherwise
noted, CE-MoS2 refers to the chemically exfoliated material obtained from intercalation using
excess MoS2.
Functionalization: 4-Methoxyphenyldiazonium tetrafluoroborate dissolved in distilled water was
added to the dilute yellowish/brownish purified CE-MoS2 dispersion dropwise under exposure to
light. After addition of only a few drops of reagent, a black precipitate formed. The reaction mixture
30
Washing with isopropanol to remove organic side-products and with distilled water yielded the
functionalized MoS2 product after drying under vacuum.
Characterization: Optical extinction was measured on a Perkin Elmer Lambda 1050 in quartz
cuvettes with a pathlength of 0.4 cm. Raman spectroscopy was performed using a Horiba Scientific
LabRAM Aramis equipped with a motorized sample holder. TGA-MS analysis was carried out on
a Netzsch STA 409 CD with EI ion source and quadrupole mass spectrometer on a 10 K/min
temperature ramp using helium as inert gas. Zeta potential measurements were carried out on a
Malvern Zetasizer Nano system with irradiation from a 633 nm He-Ne laser. X-ray Photoelectron
Spectroscopy was performed under ultra-high vacuum conditions (< 510-10 mbar), using
monochromated Al Kα X-rays (1486.6 eV) from an Omicron XM1000 MkII X-ray source and an
Omicron EA125 energy analyzer. An Omicron CN10 electron flood gun was used for charge
compensation and the binding energy scale was referenced to the adventitious carbon 1s core-level
at 284.8 eV. Mo3d and S2p core-level regions were recorded at an analyzer pass energy of 15 eV
and with slit widths of 6 mm (entry) and 3 mm x 10 mm (exit), resulting in an instrumental
resolution of 0.48 eV. After subtraction of a Shirley background, the core-level spectra were fitted
with Gaussian-Lorentzian line shapes and using Marquardt’s algorithm. IR spectra were acquired
using a Perkin Elmer Frontier spectrometer equipped with a diffuse reflectance unit and CsI as
matrix. Atomic force microscopy (AFM) was carried out on a Solver Pro scanning probe
microscope (NT-MDT) equipped with a Sony Exwave HAD camera optical zoom (6.5) in tapping
mode. Low resolution bright field transmission electron microscopy (TEM) imaging was
performed using a JEOL 2100, operated at 200 kV on holey carbon grids (400 mesh). Prior to
HRTEM imaging, the samples were drop-cast onto grids that were then kept at 120 °C overnight
31
TEM operated at 300 kV. The network transistor devices based on region-selective assembly of
CE-MoS2 were prepared in analogy to reference53 (see also SI). In brief, the pre-patterned chip is
immersed in 0.2 mM isopropanol solution of 12-mercaptododecylphosphonic acid (HS-C12-PA)
for 70 hours to form the nonpolar self-assembled monolayer (SAM). The SAM in the channel
region is removed with O2 plasma and replaced by the positively charged SAM
3-methyl-1-(12-phosphonododecyl) imidazolium bromide. CE-MoS2 in aqueous solution is selectively deposited
by dip-coating for 24 hours.
Modelling: The simulation scheme adopted throughout this work is based on Density Functional
Theory (DFT) as implemented in AIMS and CP2K codes.57 PBE58 exchange and correlation
functional with Van der Waals correction at the Grimme-D3 level59 has been used. In CP2K the
wave-functions are expanded on a Gaussian basis set, whereas an auxiliary plane-wave expansion
of the electronic density is used to efficiently evaluate the Hartree part of the Coulomb interactions
and the exchange-correlation energy. Goedecker-type pseudopotentials are used for all atoms with
triple-ζ plus polarization (TZVP) Gaussian basis sets. A kinetic cutoff of 300 Ryd is used for the
plane-wave expansion of the electronic density and BZ integration is restricted to the Γ-point. The
geometry is relaxed until the maximum force on each atom is less than 0.01 eV/Ang.
To model both the clean and functionalized MoS2 monolayers we used hexagonal cells obtained
replicating 6x6 times the hexagonal MoS2 unit cell, with 1T symmetry and lattice parameter a =
3.16 Å. The use of this cell guarantees a sampling of the Brillouin zone which leads to an error on
the evaluation of total energy smaller than 0.001 eV/cell. Different images of the monolayer along
z are separated by a vacuum region of approximately 45 Å. Neutral and charged (with -1 |e| and -4
|e| excess charge) substrates have been compared. An energy correction for multipole error in
32 ASSOCIATED CONTENT
Supporting Information: Purification of CE-MoS2, comparison of intercalation conditions,
further characterization of functionalized MoS2 (zeta potential, Raman, XPS, XRD), details on
redispersion experiments, functionalization of chemically exfoliated MoS2 from intercalation using
excess n-BuLi, functionalization after deposition on substrates, details DFT calculations.
Supporting Information is available free of charge from the ACS Nano home page.
AUTHOR INFORMATION
Corresponding Author
* Email: [email protected]
Author Contributions
The manuscript was written through contributions of all authors. All authors have given approval to the final version of the manuscript.
Acknowledgements
The research leading to these results has received funding from the European Union Seventh
Framework Program under grant agreement n°604391 Graphene Flagship. In addition, CB
acknowledges the German research foundation DFG (BA 4856/1-1). JNC acknowledges the
European Research Council grant SEMANTICS for financial support. KCK, IA, PV, FH, AH,
ZW and MH acknowledge the Collaborative Research Centre SFB953 “Synthetic Carbon
33
HCN and VN acknowledge ERC 2DNanoCaps, SFI PIYRA and FP7 MoWSeS. GSD, NMcE and
NB acknowledge SFI for PI_10/IN.1/I3030. ZW and MH acknowledge the Cluster of Excellence
“Engineering of Advanced Materials”. SS and CSC have been supported by the European
Research Council (Quest project). All calculations were performed on the Parsons cluster
maintained by the Trinity Centre for High Performance Computing, under project ID:
HPC_12_0722. This cluster was funded through grants from Science Foundation Ireland.
References
1. Wang, Q. H.; Kalantar-Zadeh, K.; Kis, A.; Coleman, J. N.; Strano, M. S., Electronics and
Optoelectronics of Two-Dimensional Transition Metal Dichalcogenides. Nat Nano 2012, 7,
699-712.
2. Butler, S. Z.; Hollen, S. M.; Cao, L.; Cui, Y.; Gupta, J. A.; Gutierrez, H. R.; Heinz, T. F.;
Hong, S. S.; Huang, J.; Ismach, A. F.; et al., Progress, Challenges, and Opportunities in
Two-Dimensional Materials Beyond Graphene. ACS Nano 2013, 7, 2898-2926.
3. Chhowalla, M.; Shin, H. S.; Eda, G.; Li, L.-J.; Loh, K. P.; Zhang, H., The Chemistry of
Two-Dimensional Layered Transition Metal Dichalcogenide Nanosheets. Nat Chem 2013, 5,
263-275.
4. Nicolosi, V.; Chhowalla, M.; Kanatzidis, M. G.; Strano, M. S.; Coleman, J. N., Liquid
Exfoliation of Layered Materials. Science 2013, 340, 1420-+.
5. Xu, M.; Liang, T.; Shi, M.; Chen, H., Graphene-Like Two-Dimensional Materials. Chem.
34
6. Novoselov, K. S.; Fal'ko, V. I.; Colombo, L.; Gellert, P. R.; Schwab, M. G.; Kim, K., A
Roadmap for Graphene. Nature 2012, 490, 192-200.
7. Osada, M.; Sasaki, T., Exfoliated Oxide Nanosheets: New Solution to Nanoelectronics. J.
Mater. Chem. 2009, 19, 2503-2511.
8. Reich, E. S., Phosphorene Excites Materials Scientists. Nature 2014, 506, 19-19.
9. Zhan, Y. J.; Liu, Z.; Najmaei, S.; Ajayan, P. M.; Lou, J., Large-Area Vapor-Phase Growth
and Characterization of MoS2 Atomic Layers on a SiO2 Substrate. Small 2012, 8, 966-971.
10. Berkdemir, A.; Gutierrez, H. R.; Botello-Mendez, A. R.; Perea-Lopez, N.; Elias, A. L.;
Chia, C.-I.; Wang, B.; Crespi, V. H.; Lopez-Urias, F.; Charlier, J.-C.; et al., Identification of
Individual and Few Layers of WS2 Using Raman Spectroscopy. Sci. Rep. 2013, 3.
11. Eda, G.; Yamaguchi, H.; Voiry, D.; Fujita, T.; Chen, M.; Chhowalla, M.,
Photoluminescence from Chemically Exfoliated MoS2. Nano Lett. 2011, 11, 5111-5116.
12. Coleman, J. N.; Lotya, M.; O'Neill, A.; Bergin, S. D.; King, P. J.; Khan, U.; Young, K.;
Gaucher, A.; De, S.; Smith, R. J.; et al., Two-Dimensional Nanosheets Produced by Liquid
Exfoliation of Layered Materials. Science 2011, 331, 568-571.
13. Smith, R. J.; King, P. J.; Lotya, M.; Wirtz, C.; Khan, U.; De, S.; O'Neill, A.; Duesberg, G.
S.; Grunlan, J. C.; Moriarty, G.; et al., Large-Scale Exfoliation of Inorganic Layered Compounds
in Aqueous Surfactant Solutions. Adv. Mater. 2011, 23, 3944-3948.
14. Backes, C.; Smith, R. J.; McEvoy, N.; Berner, N. C.; McCloskey, D.; Nerl, H. C.;
O’Neill, A.; King, P. J.; Higgins, T.; Hanlon, D.; et al., Edge and Confinement Effects Allow in
situ Measurement of Size and Thickness of Liquid-Exfoliated Nanosheets. Nature Commun.
35
15. Kuila, T.; Bose, S.; Mishra, A. K.; Khanra, P.; Kim, N. H.; Lee, J. H., Chemical
Functionalization of Graphene and Its Applications. Progress in Materials Science 2012, 57,
1061-1105.
16. Sun, Z.; James, D. K.; Tour, J. M., Graphene Chemistry: Synthesis and Manipulation. J.
Phys. Chem. Lett. 2011, 2, 2425-2432.
17. Englert, J. M.; Dotzer, C.; Yang, G.; Schmid, M.; Papp, C.; Gottfried, J. M.; Steinrueck,
H.-P.; Spiecker, E.; Hauke, F.; Hirsch, A., Covalent Bulk Functionalization of Graphene. Nature
Chem. 2011, 3, 279-286.
18. Cui, Z. H.; Oyer, A. J.; Glover, A. J.; Schniepp, H. C.; Adamson, D. H., Large Scale
Thermal Exfoliation and Functionalization of Boron Nitride. Small 2014, 10, 2352-2355.
19. Sainsbury, T.; Satti, A.; May, P.; O'Neill, A.; Nicolosi, V.; Gun'ko, Y. K.; Coleman, J. N.,
Covalently Functionalized Hexagonal Boron Nitride Nanosheets by Nitrene Addition. Chem.
Eur. J. 2012, 18, 10808-10812.
20. Sainsbury, T.; Satti, A.; May, P.; Wang, Z.; McGovern, I.; Gun’ko, Y. K.; Coleman, J.,
Oxygen Radical Functionalization of Boron Nitride Nanosheets. J. Am. Chem. Soc. 2012, 134,
18758-18771.
21. Makarova, M.; Okawa, Y.; Aono, M., Selective Adsorption of Thiol Molecules at Sulfur
Vacancies on Mos2(0001), Followed by Vacancy Repair Via S–C Dissociation. J. Phys. Chem. C
2012, 116, 22411-22416.
22. Chou, S. S.; De, M.; Kim, J.; Byun, S.; Dykstra, C.; Yu, J.; Huang, J.; Dravid, V. P.,
Ligand Conjugation of Chemically Exfoliated MoS2. J. Am. Chem. Soc. 2013, 135, 4584–4587.
23. Zhou, L.; He, B.; Yang, Y.; He, Y., Facile Approach to Surface Functionalized Mos2
36
24. Georgakilas, V.; Otyepka, M.; Bourlinos, A. B.; Chandra, V.; Kim, N.; Kemp, K. C.;
Hobza, P.; Zboril, R.; Kim, K. S., Functionalization of Graphene: Covalent and Non-Covalent
Approaches, Derivatives and Applications. Chem. Rev. 2012, 112, 6156-6214.
25. Voiry, D.; Goswami, A.; Kappera, R.; SilvaCecilia de Carvalho Castro, e.; Kaplan, D.;
Fujita, T.; Chen, M.; Asefa, T.; Chhowalla, M., Covalent Functionalization of Monolayered
Transition Metal Dichalcogenides by Phase Engineering. Nature Chem. 2014, 7, 45-49.
26. Benavente, E.; Santa Ana, M. A.; Mendizábal, F.; González, G., Intercalation Chemistry
of Molybdenum Disulfide. Coord. Chem. Rev. 2002, 224, 87-109.
27. Marseglia, E. A., Transition Metal Dichalcogenides and Their Intercalates. Int. Rev. Phys.
Chem. 1983, 3, 177-216.
28. Wypych, F.; Schollhorn, R., 1T-MoS2, a New Metallic Modification of Molybdenum
Disulfide. J. Chem. Soc., Chem. Commun. 1992, 1386-1388.
29. Marseglia, E. A., Transition Metal Dichalcogenides and Their Intercalates. Int. Rev. Phys.
Chem. 1983, 3, 177-216.
30. Joensen, P.; Frindt, R. F.; Morrison, S. R., Single-Layer MoS2. Mater. Res. Bull. 1986, 21,
457-461.
31. Gatensby, R.; McEvoy, N.; Lee, K.; Hallam, T.; Berner, N. C.; Rezvani, E.; Winters, S.;
O’Brien, M.; Duesberg, G. S., Controlled Synthesis of Transition Metal Dichalcogenide Thin
Films for Electronic Applications. Appl. Surf. Sci. 2014, 297, 139-146.
32. Wilson, J. A.; Yoffe, A. D., Transition Metal Dichalcogenides. Discussion and
Interpretation of the Observed Optical, Electrical, and Structural Properties. Adv. Phys. 1969, 18,