Open Access
Research article
The development and validation of the Virtual Tissue Matrix, a
software application that facilitates the review of tissue microarrays
on line
Catherine M Conway
1, Deirdre O'Shea
2, Sallyann O'Brien
3,
Darragh K Lawler
1, Graham D Dodrill
1, Anthony O'Grady
2, Helen Barrett
2,
Christian Gulmann
2, Lorraine O'Driscoll
1, William M Gallagher
3,
Elaine W Kay
2and Daniel G O'Shea*
1Address: 1Medical Informatics Group, School of Biotechnology, Dublin City University, Dublin, Ireland and National Institute for Cellular Biotechnology, Dublin City University, Dublin, Ireland, 2Department of Histopathology, Beaumont Hospital and Royal College of Surgeons, Dublin, Ireland and 3Centre for Molecular Medicine, Conway Institute of Biomolecular and Biomedical Research University College Dublin, Ireland
Email: Catherine M Conway - [email protected]; Deirdre O'Shea - [email protected]; Sallyann O'Brien - [email protected]; Darragh K Lawler - [email protected]; Graham D Dodrill - [email protected]; Anthony O'Grady - [email protected];
Helen Barrett - [email protected]; Christian Gulmann - [email protected];
Lorraine O'Driscoll - [email protected]; William M Gallagher - [email protected]; Elaine W Kay - [email protected]; Daniel G O'Shea* - [email protected]
* Corresponding author
Abstract
Background: The Tissue Microarray (TMA) facilitates high-throughput analysis of hundreds of tissue specimens simultaneously. However, bottlenecks in the storage and manipulation of the data generated from TMA reviews have become apparent. A number of software applications have been developed to assist in image and data management; however no solution currently facilitates the easy online review, scoring and subsequent storage of images and data associated with TMA experimentation.
Results: This paper describes the design, development and validation of the Virtual Tissue Matrix (VTM). Through an intuitive HTML driven user interface, the VTM provides digital/virtual slide based images of each TMA core and a means to record observations on each TMA spot. Data generated from a TMA review is stored in an associated relational database, which facilitates the use of flexible scoring forms. The system allows multiple users to record their interpretation of each TMA spot for any parameters assessed. Images generated for the VTM were captured using a standard background lighting intensity and corrective algorithms were applied to each image to eliminate any background lighting hue inconsistencies or vignetting.
Validation of the VTM involved examination of inter-and intra-observer variability between microscope and digital TMA reviews. Six bladder TMAs were immunohistochemically stained for E-Cadherin, β-Catenin and PhosphoMet and were assessed by two reviewers for the amount of core and tumour present, the amount and intensity of membrane, cytoplasmic and nuclear staining.
Conclusion: Results show that digital VTM images are representative of the original tissue viewed with a microscope. There were equivalent levels of inter-and intra-observer agreement for five out of the eight parameters assessed. Results also suggest that digital reviews may correct potential problems experienced when reviewing TMAs using a microscope, for example, removal of background lighting variance and tint, and potential disorientation of the reviewer, which may have resulted in the discrepancies evident in the remaining three parameters.
Published: 17 May 2006
BMC Bioinformatics 2006, 7:256 doi:10.1186/1471-2105-7-256
Received: 22 December 2005 Accepted: 17 May 2006
This article is available from: http://www.biomedcentral.com/1471-2105/7/256
© 2006 Conway et al; licensee BioMed Central Ltd.
Background
Tissue Microarrays (TMAs) provide high-throughput anal-ysis of tissue samples for in situ hybridisation and immu-nohistochemistry, by means of arranging multiple tissue samples in a uniform structure on the surface of a glass slide. TMAs allow for large numbers of tissue samples to be analysed simultaneously at DNA, RNA or protein level.
Kononen et al. first illustrated the use of TMAs in 1998 [1]. The technique involves the excision of cores of varying diameter (0.6 mm to 2 mm) from regions of histological importance on donor tissue blocks and the subsequent insertion of these excised cores into precise co-ordinates on a recipient block. This process is repeated until a two-dimensional matrix of cores is inserted into the recipient block. Once the block is complete, sections can be cut from the block, which are then available for any analysis currently performed on full-face tissue sections.
A large amount of data is associated with TMAs, ranging from information on the tissue (patient information), to their construction, subsequent staining and assessment. It was becoming apparent that applications to assist in pathologist's reviews of TMAs are required, as bottlenecks in the storage and manipulation of the data generated are beginning to emerge.
There have been previous attempts to create software applications that facilitate review of TMAs [2]. The tech-nology has varied from using Microsoft Excel™ spread-sheets, to the creation of complex databases. Manley et al. (2001) developed a relational database to store data and images, which focus on clinical outcome [3]. This system consisted of several databases to store TMA images, TMA information, pathological and clinical information, in Microsoft Access™. All data was manually entered into a main online form and then transferred into the relevant database table. Each image was scanned using a grid struc-ture that overlaid the image of the array. The images were composed of six separate 10 × fields, stitched together to form a single image, which was saved as a JPEG image (200–300 kb). However, despite the advances made by this system, rapid file sharing over the internet was limited by large image sizes with slow internet connections. Also, as the software utilised were commercial applications, adaptations to the functionality of the programs were not possible.
Liu et al. (2002) utilised a combination of commercial and in-house applications to store data, digitise images and perform statistical analysis [4]. Information was stored in Microsoft Excel™ spreadsheets and reformatted by a program called TMA deconvoluter, into a structure that can be further manipulated to allow statistical analy-sis and hierarchical clustering. Although Microsoft Excel™
spreadsheets are traditionally used by scientists to store data, there is always a significant risk of human error, as large amounts of data entry are required and the object-oriented nature of the data does not lead to optimal data storage in spreadsheets.
The ability to interpret, review and grade histology in TMA images across the Internet was assessed by Bova et al. [5]. This study evaluated the reviewer's ability to interpret images of TMA cores, in order to assess the presence or absence of prostate cancer and to Gleason grade tumours. In 99% of cases, the images were deemed interpretable; this was done by visual inspection. However, it was sug-gested that on occasion lengthy downloading times would limit the system's practical use. The authors recom-mended that compressed files of less than 200 kb should be evaluated for viable image quality, as using files of this size would reduce downloading times. Inter-and intra-observer variability was found to be no greater, and in some cases less than, that reported when using traditional microscope-based Gleason grading. This was evaluated by comparing the Inter-and intra-observer variability observed in Bova et al. study of on line analysis with those previously reported in literature for Inter-and intra-observer of TMA glass slide analysis. When evaluating lev-els of inter-and intra-observer agreement, Bova et al. used percentage of complete agreement, and k coefficient of agreement. They concluded that web-based technology was an acceptable means to review TMAs. The authors believed a limitation of their study was that web-based analysis was not directly compared with their microscope-based review. The authors recommended that this tech-nology be tested using data resulting from immunohisto-chemical and in situ hybridisation reviews.
The advent of virtual slides permitted the review of whole tissue slides across the Internet [6]. Virtual slides provide users all the functionality of a microscope, but with numerous additional benefits, including concurrent access for multiple users, tracking of review movements and image annotation. Virtual slides are reminiscent of microscope use, they are favoured by pathologists over static digital images, due to the ability to change magnifi-cation and scroll laterally while reviewing the image.
Results
Two reviewers (Users A and B) examined 183 TMA spots (196 minus 12 control spots and one un-reviewed spot) stained with 3 immunostains using both review methods (microscope and VTM). Neither user reported any techni-cal difficulties when performing digital or microscope analysis. The levels of intra-and inter-observer variability between digital and microscope TMA reviews were assessed, for parameters examining the amount of core and tumour present, the amount and intensity of mem-brane, cytoplasmic and nuclear staining.
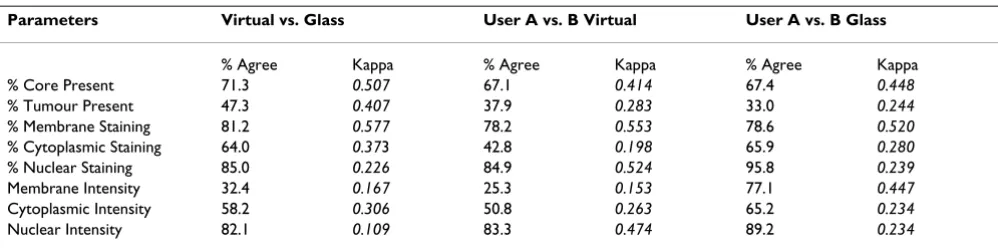
Table 1 illustrates the intra-observer variability between virtual and glass TMA reviews. Good levels of agreement (>60%) between methods were observed when quantify-ing the amount of core present, the amount of membrane, nuclear and cytoplasmic staining and nuclear intensity. Low levels of agreement between methods were observed when quantifying the amount of tumour present and membrane intensity.
Table 1 illustrates the inter-observer agreement achieved when performing both virtual and glass TMA reviews. Inter-observer agreements achieved when performing vir-tual TMA reviews were comparable with inter-observer agreements achieved when performing glass TMA reviews, for four out of eight parameters. The Virtual TMA review of the amount of tumour present achieved greater levels of inter-observer agreement than the glass TMA review, of this parameter, however the level of agreement between users for this parameter was very low for both methods of assessment. The glass TMA review of the amount of cyto-plasmic staining and intensity, and membrane staining intensity achieved greater levels of inter-observer agree-ment than the virtual TMA review, of these parameters.
The parameter, % Tumour present, was difficult to assess, with low agreement recorded for inter-and intra-observer agreements across virtual and glass TMA reviews. As this
parameter has equivalent levels of inter-observer variabil-ity for both virtual and glass TMA reviews, it has to be assumed that poor performance is not based on the method, but more likely the size of the range used. A 10% interval was used to quantify the amount of tumour present, which appears too constrained for this parameter.
Reviewers found quantification of the parameter mem-brane intensity difficult to reproduce between virtual and glass TMA reviews. When users assessed membrane inten-sity using a microscope, they predominantly used two cat-egories of staining intensity, negative and moderate. With the virtual TMA review, users appeared to use the classifier more extensively, as illustrated in Figure 1. The assessment of intensity of immunohistochemistry, particularly the intensity of membrane bound immunostains is inher-ently difficult. For example, problems with Her-2 assess-ment by immunohistochemistry are well docuassess-mented [7,8].
Discussion
The objective of this study was to design and develop an online software application that presents tissue microar-ray images and stores associated review and clinical data. The result was the Virtual Tissue Matrix (VTM), which con-sists of TMA images available at multiple magnifications, scoring forms to gather TMA review data and a relational database to store the generated results.
[image:3.612.55.554.573.697.2]The VTM displays virtual TMA images via a web site and facilitates the storage of TMA data via a relational data-base. There are numerous advantages of using the VTM over other proposed software systems of its type. Down-loading of the images is rapid. Only views that are requested by the user are returned at maximum resolu-tion, thereby downloading the minimum required data-set. The VTM was designed in consultation with scientists and pathologists and, as a result, the reviewing process emulates the workflow involved in conventional TMA
Table 1: Agreement levels (%) and un-weighted kappa values by measured parameter for each comparison of TMA reviews.
Parameters Virtual vs. Glass User A vs. B Virtual User A vs. B Glass
% Agree Kappa % Agree Kappa % Agree Kappa % Core Present 71.3 0.507 67.1 0.414 67.4 0.448
% Tumour Present 47.3 0.407 37.9 0.283 33.0 0.244
% Membrane Staining 81.2 0.577 78.2 0.553 78.6 0.520
% Cytoplasmic Staining 64.0 0.373 42.8 0.198 65.9 0.280
% Nuclear Staining 85.0 0.226 84.9 0.524 95.8 0.239
Membrane Intensity 32.4 0.167 25.3 0.153 77.1 0.447
Cytoplasmic Intensity 58.2 0.306 50.8 0.263 65.2 0.234
Nuclear Intensity 82.1 0.109 83.3 0.474 89.2 0.234
Distribution of the results for virtual and glass TMA reviews of cytoplasmic and membrane staining intensity and cytoplasmic staining
Figure 1
reviews. The VTM interface is delivered in HTML, via a conventional web browser, allowing for intuitive user interaction. The VTM database is relational; a structure more suited to the storage of the object oriented dataset generated from TMA experimentation, than previous efforts incorporating flat files and spreadsheets for data storage.
Since the creation of the VTM there have been numerous advances in the technologies used for image acquisition [9-11] and image analysis techniques and applications have been well documented in literature [12-17]. Inte-grated intuitive systems are now available that rely on minimal human intervention when scanning slides such as Aperio or Dmetrix [18]. Numerous commercial image acquisition applications are now available[19-21]; how-ever, cost of purchase is often high for these integrated sys-tems putting them out of reach for many research laboratories.
The VTM has been upgraded to support images generated by an Aperio Scanscope T3 Scanner™. Advantages of using the Aperio Scanscope T3 Scanner™ include, batch upload-ing of slides, the ability to scan glass TMA slides at 20 × magnification within minutes, one touch scanning which reduces manual intervention, automatic section of auto-focus points within the tissue, and seamless images with no tiling artifacts. Despite the advances in image acquisi-tion and the obvious advantages automated systems have over older more labour intensive systems, these systems do not wholly address the problem of relating TMA images to review and image analysis data.
The method used to acquire digital images within the VTM is not the main concern of this manuscript, the tech-nology is constantly developing and advancing, and as new and improved systems are developed they can be integrated into the VTM with ease as illustrated by the upgrade to Aperio™.
Once developed the VTM was validated, via assessment of inter-and intra-observer variability on two users' evalua-tions of immunohistochemically stained tissue microar-rays, using digital and microscope analysis. Eight parameters were evaluated, the amount of core and tumour present, the amount and intensity of membrane, cytoplasmic and nuclear staining.
Comparisons evaluated in this study illustrated that intra-and inter-observer virtual TMA reviews produced equiva-lent levels of agreement as intra-and inter-observer glass TMA reviews, for five out of the eight parameters exam-ined. Where discrepancies occurred it was dependent on the parameters and users involved. In all comparisons, low levels of agreement for the amount of tumour present
were observed. This was not surprising, as the application of classifiers to any data continuum (data that does not naturally fall into discrete clusters) results in scoring vari-ability around the interfaces of the classifier. This variabil-ity is increased when the number of classes are increased creating more interfaces. Also, of the two reviewers used, one was a scientist and one a pathologist. The scientist accurate interpretation of tumour/non tumour may potentially be questioned as a result of this work.
Of particular interest, were a large number of observations that were considered positively stained by virtual TMA reviews which were considered negatively stained when reviewed using a microscope. This was particularly evi-dent when quantifying the amount of cytoplasmic stain-ing; where virtual TMA reviews observed substantially more positively stained spots than glass TMA reviews. The additional positively stained spots were largely considered to stain between 1–30% of the tumour area and/or to be weakly stained. This suggests that virtual TMA reviews may be more successful in allowing the identification of small areas of staining and/or where staining intensity is low.
One proposed reason for the identification of staining when using digital images that was not observed with a microscope was the use of correcting adjustments to the image data during the digitising of TMAs. Bulbs used in microscopes have a characteristic tint; in general this is yellow or straw coloured. However, this tint is removed when digitising slides using a corrective algorithm, poten-tially unmasking weak staining that would otherwise be attributable to background tint. Also, with microscope based analysis, background light is adjusted to best suit each individual spot. When digitising the slides for this study, a constant background light intensity was used to digitise all slides for this study.
Human observers, while excellent at object classification, are inherently poor at quantifying intensities and areas to any degree of accuracy. Studies have shown that image analysis produces more reproducible results than pathol-ogists for quantifying the intensity of staining, in relation
to β-Catenin expression in TMAs for colon cancer [22].
Image analysis systems may identify subtle differences in staining intensity, which are not quantifiable by a human reviewer, thus leading to the better correlation of expres-sion data to prognostic indicators.
Conclusion
The virtual tissue matrix (VTM) was created to assist in TMA analysis, by providing digital TMA images at multi-ple magnifications online, and submitting TMA review data from an online form into an associated database. The VTM illustrated that digital TMA analysis obtained equiv-alent levels of agreement as microscope based analysis, for five out of eight parameters. The remaining three parame-ters achieved greater levels of agreement when performed using microscope analysis. However, on further investiga-tion of the three parameters, it is proposed that the digital reviews may be providing the user with greater capability to accurately assess staining presence and intensity. Results illustrated users were incapable of agreeing when comparing digital and microscope TMA analysis when classifying staining intensity. Greater levels of staining was observed when performing digital TMA analysis, it is sug-gested this is due to the background correction step involved in digitising the slides.
Comparisons of digital with glass reviews of immunohis-tochemistry stained slides is well documented in litera-ture, however, in order to validate the VTM it was necessary to perform this study. As previously reported in literature, there was some degree of inter-and intra-observer variability. However, the ability of users to observe more positive staining when performing digital reviews, and the inability of users to utilise all categories within the classifiers provided when performing glass reviews are previously unreported in literature.
Methods
Construction of TMAs
Forty eight bladder tumours which were part of a wider study were utilized in this evaluation. Bladder cancer TMAs were constructed from formalin-fixed paraffin-embedded (FFPE) tissue blocks using a Beecher Instru-ments® tissue arrayer. All FFPE blocks were sectioned and
stained with Haematoxylin and Eosin (H&E). Two cores each of normal and tumour tissue where sampled. A total of 6 TMAs were constructed, with 48 cases and 196 2 mm cores, including 12 control spots composed of liver tissue. Due to the heterogeneous nature of bladder tissue, 2 mm
cores were utilised. TMAs were sectioned at 4 µm and
probed with three antibodies, E-cadherin (Novocastra™),
β-Catenin (Labvision Corp., RB-9035-P1) and
Phospho-Met Tyr1234/1235 (Cell Signalling Technology, 3126S).
The method used was the Vectastain® ABC (avidin/biotin)
system (Vector Laboratories Inc, PK6200), with visualisa-tion being accomplished by using DAB (3,3'-Diami-nobenzidine tetrahydrochloride) as the chromogen. The antibody to E-Cadherin shows membrane staining; the
antibody to β-Catenin shows membrane and cytoplasmic
staining [23], the antibody to Phospho met shows mem-brane staining, cytoplasmic staining and nuclear staining [24].
Construction of virtual TMAs
The imaging system was composed of an Olympus BX-40 microscope (Olympus, NY, USA) incorporating a Prior H101 motorised stage. Images were captured at 4 × using a Plan Achromat lens, and at 20 × using a Plan Fluorite lens. The camera used to scan the immunostained TMAs was a 3-chip JVC KY 55 B 3 CCD. The camera has a red, green and blue (RGB) digital signal output to an Imaging Technologies IC RGB frame grabber, (Coreco Imaging Incorporated, MA, USA) which was housed in a Silicon Graphics ZX10 imaging workstation. A software algo-rithm was constructed using the Optimas development environment (Media Cybernetics, MD, USA) that facili-tated the remote control of the stage and the construction of wide field-of-view images from a montage of smaller fields. All software was written in-house. This facilitated the development of a low cost method of image acquisi-tion. Purchase of dedicated scanners for image acquisition can often be prohibitively costly for research groups, and this approach may present researchers with a low cost solution to this issue.
TMAs were initially scanned at 4 × to create a tiled 'thumb-nail' image of the entire array. This overview image was used to locate cores manually through a custom Graphical User Interface. The user clicked on the centre of each core on the overview image and the coordinate generated was used to seed an automatic scanning algorithm for all cores at 20 ×. The array of captured images (6 × 8) were then tiled together to form a montage bitmap image of approx-imately 60.5 MB (4607 × 4592 pixels. 2.0 mm cores were used as they illustrate the ability of the scanning system to acquire and integrate multiple fields of view at 20 ×, a large diameter of core was required as a smaller diameter cores could potentially be captured within a single field.
using the Zoomify™-embedded object within a conven-tional web page. Zoomify™ initially presents the user with a low power view of each TMA spot. The users can then scroll around the image and when required zoom into a maximum magnification of 20×.
Validation of image quality
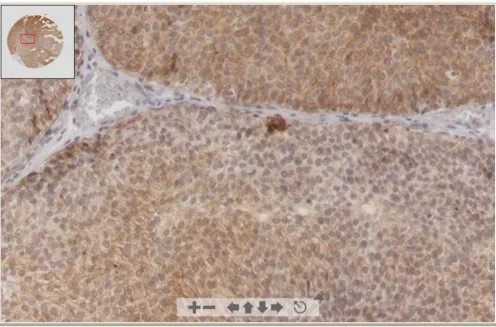
When using a lossy compression algorithm, such as JPEG, image quality is reduced when compared with that of uncompressed images. To ensure that the compression rate used by Zoomify™ provided images of sufficient qual-ity, a series of consultations with pathologists and scien-tists were performed, where compressed and uncompressed images were compared. The outcome of this consultation was that the images generated by Zoom-ify™ were suitable for scoring. Figure 2 illustrates the qual-ity of images available in the VTM.
Design phase of the VTM
The design objectives of the VTM system were to provide TMA images of sufficient quality to review over the World
Wide Web, to present scoring forms to record TMA results and to create a relational database that can store and sub-sequently retrieve data gathered during scoring.
PHP, Javascript, HTML and Oracle were used to create the VTM. PHP is a server side scripting language, which creates dynamic web pages, through embedding PHP code in HTML pages. Through the use of SQL queries, it can also extract data from many conventional databases (Oracle, MySQL, etc). Javascript adds interactive client side func-tionality to otherwise static HTML pages [26]. An Oracle relational database was used to store all the information generated in this study [27].
Database design
The construction of TMAs facilitates the generation of hundreds of TMA slides from a single TMA block; there-fore every TMA slide produced has the ability to be stained with a unique immunostain. A major benefit of storing TMA images and results within a relational database is the ability to extract all the results associated with a single
[image:7.612.56.552.342.669.2]Digital image of TMA spot presented in VTM using Zoomify™ application Figure 2
core, which potently may have been immunostained hun-dreds of times. This functionality is available within the VTM.
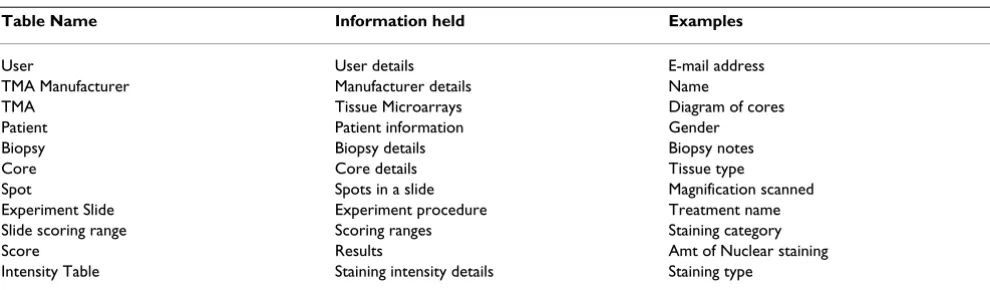
Based on analysis of conventional TMA datasets, it was established that eleven groupings of data would be suffi-cient to record all relevant information; therefore, eleven tables where created in the VTM relational database. Each table contains information relating to a specific aspect of a TMA review. For example, the USER table contains infor-mation relating to users only; SCORES table contains information relating to the TMA analysis results only. A unique identifier interlinks all tables and by using SQL statements, information can be retrieved from multiple tables simultaneously. For example, results relating to a specific user can be obtained by creating an SQL statement that requests information from the SCORES and USER tables. Table 2 lists all the tables that exist in the database and examples of the information they record. A complete schema of the database is available [28] and also as Addi-tional file 1.
The database has been designed to eliminate replication of data input. For example, a manufacturer of TMAs details are only entered into the database once regardless of the number of TMAs they have constructed, once their account is created they can be associated with multiple blocks/slides and studies. There is also the ability to add information into the database after the initial study has been created. For example, if patient or biopsy informa-tion is not known at the time of entering the TMA review results into the database, they may be entered at a later date, by simply entering the patient or biopsy information and then selecting the cores the information applies to. However, users are unable to overwrite the TMA review results already present in the database.
Depending on the internet connection used (times described here are for LAN settings of 10 Mbps), it takes approx 5 seconds to download the thumbnail overview of
a TMA slide; once a core has been selected it takes approx 2–3 seconds to view the individual core in the Zoomify ™ window. There are no restrictions on the number of images that can be displayed within the VTM, currently there are 196 images. However, the number of images dis-played is dependent on the capacity of the server available to the users.
Interface design
The user interface had to be easily navigated, interpretable and provide images at sufficient speed and resolution for review. There are two types of user account within the VTM, namely administrator or user. A user has restricted access to the site; they can only review and score images. An administrator has additional privileges within the site; they can create new studies, add new images and scoring forms and can view all data stored in the database.
The VTM was constructed so the user is lead through the site, not having to concentrate on the sequence of events, freeing up analysis time for the reviewing process. Figure 3 illustrates the options available to both user and admin-istrator within the VTM. Figure 4 illustrates the user's view of a TMA slide before a specific spot is selected. A spot must be clicked on to view a scaleable image. Once selected, the spot is reviewed in a pop-up window and the option to record results via a scoring form is presented. Figure 5 illustrates the spot with the associated scoring form. The administrator has the ability to create new scor-ing forms dependscor-ing on the user's specifications.
Users, scales and parameters recorded
Two pathologists and one research scientist scored the immunohistochemically stained TMA slides. One of the former was an external examiner, completing a virtual review of one slide from an international location. This review was conducted to ensure the VTM functioned in a remote location and to ensure that a user who had no con-tribution to the design phase could use the VTM software system. As a result of having only one data set from this
[image:8.612.58.553.584.729.2]Table 2: Tables within the VTM database and examples of their content.
Table Name Information held Examples
User User details E-mail address TMA Manufacturer Manufacturer details Name
TMA Tissue Microarrays Diagram of cores Patient Patient information Gender Biopsy Biopsy details Biopsy notes Core Core details Tissue type
user, their observations were not included in the results that follow.
Review methods included a glass slide review and a virtual slide review. The glass slide review was a traditional microscope-based process; the virtual review was per-formed over the World Wide Web using the VTM. Eight parameters were examined for each spot. The amount and intensity of membrane, cytoplasmic and nuclear staining, as well as the amount of core and tumour present in each spot, were recorded. A five-point scale was used to record the staining intensity. Within the five-point scale, grade 0 represented negative staining, grade 1 was weak staining, grade 2 was moderate staining and grade 3 was strong staining. Grade 4 was included to record variable staining; this option was only available when scoring membrane staining.
A four-point scale was used to record the amount of stain-ing present in tumour-containstain-ing regions of each spot. Grade 0 represented no staining, grade 1 represented 1– 30% of relevant cells staining, grade 2 represented 31– 50% staining and grade 3 represented greater than 50%
staining. An eleven-point scale was used to record the amount of core and tumour present. Grade 0 was nega-tive/no tissue, and grade 1 to 10 increased in 10% incre-ments to 100%.
Cohen's un-weighted Kappa
Cohen's un-weighted kappa values were one of two meth-ods used to quantify the level of agreements achieved when comparing two datasets generated from TMA reviews. Kappa was not the primary statistics used in the dataset comparisons involved in this study, however; Kappa has been included as it is widely used in compari-sons of observer agreement of this type. Landis and Koch kappa interpretation scale was used to evaluate the level of kappa agreements; the interpretation scale is illustrated in Table 3[29]. The predominant method used to quantify the levels of agreement achieved when comparing two datasets generated from TMA reviews, was the percentage of cases where the two datasets were in complete agree-ment.
Abbreviations
TMA-tissue microarrayTMAs-tissue microarrays
VTM-virtual tissue matrix
Authors' contributions
CMC involved in designing the VTM, performed valida-tion of the VTM and TMA virtual image quality, per-formed statistical analysis, and drafted the manuscript. DOS involved in designing the VTM, validation of TMA virtual image quality, constructed TMAs, performed immunohistochemical staining and performed micro-scope and digital TMA reviews. SOB involved in designing the VTM, and proof reading the manuscript. DKL designed the VTM database, digitised the slides, executed the coding of the VTM and performed validation of the VTM. GDD created the first version of the VTM, involved in designing the current VTM. AOG involved in designing the VTM, and validation of TMA virtual image quality. HB performed microscope and digital TMA reviews. CG per-formed digital TMA reviews. LOD proof read the
manu-Table 3: Interpretation of Landis and Koch kappa values.
Kappa Value Range Interpretation
0–0.2 Slight 0.2–0.4 Fair 0.4–0.6 Moderate 0.6–0.8 Substantial 0.8–1.00 Almost Perfect Ranges of Cohen's Kappa values.
[image:9.612.53.298.84.379.2]Options available to users through the VTM interface Figure 3
[image:9.612.314.555.100.182.2]script. WMG involved in designing the VTM, validation of the TMA virtual image quality, structuring and proof read-ing the manuscript. EWK involved in designread-ing the VTM, validation of the TMA virtual image quality, structuring and proof reading the manuscript. DGOS conceived the VTM application, conceived the validation study (com-paring microscope and digital TMA slide reviews), partic-ipated in VTM design, creation and validation, coordinated and helped to draft and proof read the man-uscript. All authors read and approved the final manu-script.
Availability and requirements
The Virtual Tissue Matrix can be found at http:// www.telepathology.dcu.ie/VTM. Operating system(s): Platform independent; Programming language used include, Javascript, PHP, HTML. Other requirements include Macromedia flash version 7. The source code of the VTM is available at Additional file 2.
Overview of digital TMA slide as presented in the VTM interface Figure 4
Additional material
Acknowledgements
For more information on the VTM readers can log into the site using User-name, VTM and Password, VTM [30]. The authors would like to thank the pathologists and scientists who participated in this study. WMG and SOB would like to acknowledge Cancer Research Ireland and the Health Research Board for funding. This project was also facilitated by the Marie
Curie Transfer of Knowledge Industry-Academia Partnership research pro-gramme, TargetBreast http://www.targetbreast.com.
References
1. Kononen J, Bubendorf L, Kallioniemi A, Barlund M, Schraml P, Leighton S, Torhorst J, Mihatsch MJ, Sauter G, Kallioniemi OP: Tissue microarrays for high-throughput molecular profiling of tumor specimens. Nat Med 1998, 4:844-847.
2. Sharma-Oates A, Quirke P, Westhead DR: TmaDB: a repository for tissue microarray data. BMC Bioinformatics 2005, 6:218. 3. Manley S, Mucci NR, De Marzo AM, Rubin MA: Relational database
structure to manage high-density tissue microarray data and images for pathology studies focusing on clinical outcome: the prostate specialized program of research excellence model. Am J Pathol 2001, 159:837-843.
4. Liu CL, Prapong W, Natkunam Y, Alizadeh A, Montgomery K, Gilks CB, van de Rijn M: Software tools for high-throughput analysis and archiving of immunohistochemistry staining data obtained with tissue microarrays. Am J Pathol 2002, 161:1557-1565.
5. Bova GS, Parmigiani G, Epstein JI, Wheeler T, Mucci NR, Rubin MA: Web-based tissue microarray image data analysis: initial val-idation testing through prostate cancer Gleason grading. Hum Pathol 2001, 32:417-427.
6. Johnston DJ, Costello SP, Dervan PA, O'Shea DG: Development and preliminary evaluation of the VPS ReplaySuite: a virtual double-headed microscope for pathology. BMC Med Inform Decis Mak 2005, 5:10.
7. Hoang MP, Sahin AA, Ordonez NG, Sneige N: HER-2/neu gene amplification compared with HER-2/neu protein
overex-Additional File 1
A complete schema of the database structure, and lists all the tables and entries within the tables.
Click here for file
[http://www.biomedcentral.com/content/supplementary/1471-2105-7-256-S1.bmp]
Additional File 2
Source code for the VTM site and database Click here for file
[http://www.biomedcentral.com/content/supplementary/1471-2105-7-256-S2.zip]
Scoring form presented to users within the VTM interface Figure 5
Publish with BioMed Central and every scientist can read your work free of charge "BioMed Central will be the most significant development for disseminating the results of biomedical researc h in our lifetime."
Sir Paul Nurse, Cancer Research UK
Your research papers will be:
available free of charge to the entire biomedical community
peer reviewed and published immediately upon acceptance
cited in PubMed and archived on PubMed Central
yours — you keep the copyright
Submit your manuscript here:
http://www.biomedcentral.com/info/publishing_adv.asp
BioMedcentral pression and interobserver reproducibility in invasive breast
carcinoma. Am J Clin Pathol 2000, 113:852-859.
8. Ellis CM, Dyson MJ, Stephenson TJ, Maltby EL: HER2 amplification status in breast cancer: a comparison between immunohis-tochemical staining and fluorescence in situ hybridisation using manual and automated quantitative image analysis scoring techniques. J Clin Pathol 2005, 58:710-714.
9. Gomez DD, Carstensen JM, Ersboll BK: Collecting highly repro-ducible images to support dermatological medical diagnosis. Image and Vision Computing 2006, 24:186-191.
10. Stelldinger P, Kothe U: Connectivity preserving digitization of blurred binary images in 2D and 3D. Computers & Graphics-Uk 2006, 30:70-76.
11. Yasuda N, Namiki K, Honma Y, Umeshima Y, Marumo Y, Ishii H, Ben-ton ER: Development of a high speed imaging microscope and new software for nuclear track detector analysis. Radiation Measurements 2005, 40:311-315.
12. Warford A, Howat W, McCafferty J: Expression profiling by high-throughput immunohistochemistry. J Immunol Methods 2004, 290:81-92.
13. Ho J, Parwani AV, Jukic DM, Yagi Y, Anthony L, Gilbertson JR: Use of whole slide imaging in surgical pathology quality assur-ance: design and pilot validation studies. Hum Pathol 2006, 37:322-31.
14. Hansen WH, Gilman G, Finnesgard SJ, Wellik TJ, Nelson TA, Johnson MF, Schwenk NM, Seward JB, Khandheria BK: The transition from an analog to a digital echocardiography laboratory: The Mayo experience. Journal of the American Society of Echocardiography 2004, 17:1214-1224.
15. Patton N, Aslam TM, MacGillivray T, Deary IJ, Dhillon B, Eikelboom RH, Yogesan K, Constable IJ: Retinal image analysis: Concepts, applications and potential. Prog Retin Eye Res 2006, 25:99-127. 16. McCullough B, Ying X, Monticello T, Bonnefoi M: Digital
micros-copy imaging and new approaches in toxicologic pathology. Toxicol Pathol 2004, 32 Suppl 2:49-58.
17. Della Mea V, Viel F, Beltrami CA: A pixel-based autofocusing technique for digital histologic and cytologic slides. Comput Med Imaging Graph 2005, 29:333-341.
18. Weinstein RS, Descour MR, Liang C, Barker G, Scott KM, Richter L, Krupinski EA, Bhattacharyya AK, Davis JR, Graham AR, et al.: An array microscope for ultrarapid virtual slide processing and telepathology. Design, fabrication, and validation study. Hum Pathol 2004, 35:1303-1314.
19. Aperio Technologies [http://www.aperio.com/] 20. D.metrix [http://www.dmetrix.net/]
21. Applied Imaging [http://www.aicorp.com/]
22. Camp RL, Chung GG, Rimm DL: Automated subcellular localiza-tion and quantificalocaliza-tion of protein expression in tissue micro-arrays. Nat Med 2002, 8:1323-1327.
23. Wijnhoven BP, Dinjens WN, Pignatelli M: E-cadherin-catenin cell-cell adhesion complex and human cancer. Br J Surg 2000, 87:992-1005.
24. Moran E, Larkin A, Doherty G, Kelehan P, Kennedy S, Clynes M: A new mdr-1 encoded P-170 specific monoclonal antibody: (6/ 1C) on paraffin wax embedded tissue without pretreatment of sections. J Clin Pathol 1997, 50:465-471.
25. Zoomify Homepage [http://www.zoomify.com/ez/] 26. PHP Homepage [http://www.php.net/]
27. Oracle Homepage [http://www.oracle.com]
28. Details of VTM Database tables [http://www.telepathol ogy.dcu.ie/VTM/Diagram/TableDetails.bmp]
29. Landis JR, Koch GG: The measurement of observer agreement for categorical data. Biometrics 1977, 33:159-174.