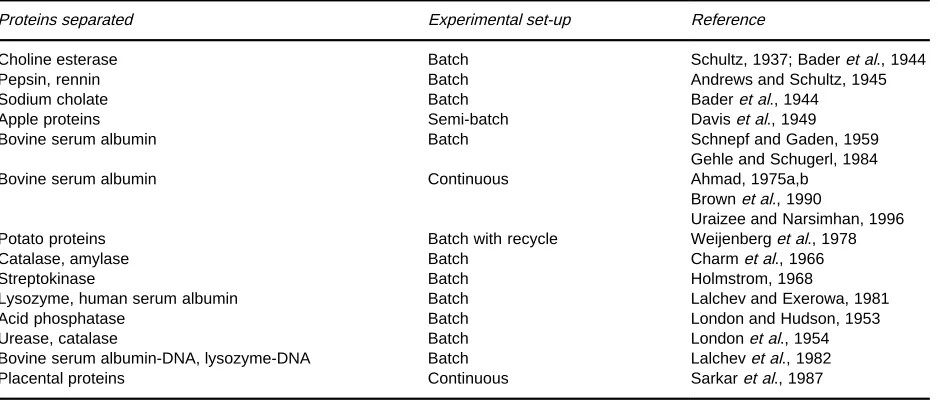
Table 1 Foam fractionation of proteins
Proteins separated Experimental set-up Reference
Choline esterase Batch Schultz, 1937; Baderet al., 1944
Pepsin, rennin Batch Andrews and Schultz, 1945
Sodium cholate Batch Baderet al., 1944
Apple proteins Semi-batch Daviset al., 1949
Bovine serum albumin Batch Schnepf and Gaden, 1959
Gehle and Schugerl, 1984
Bovine serum albumin Continuous Ahmad, 1975a,b
Brownet al., 1990
Uraizee and Narsimhan, 1996
Potato proteins Batch with recycle Weijenberget al., 1978
Catalase, amylase Batch Charmet al., 1966
Streptokinase Batch Holmstrom, 1968
Lysozyme, human serum albumin Batch Lalchev and Exerowa, 1981
Acid phosphatase Batch London and Hudson, 1953
Urease, catalase Batch Londonet al., 1954
Bovine serum albumin-DNA, lysozyme-DNA Batch Lalchevet al., 1982
Placental proteins Continuous Sarkaret al., 1987
Foam Fractionation
G. Narsimhan, Purdue University, West Lafayette, IN, USA
Copyright^ 2000 Academic Press
Introduction
Foam concentration/fractionation is a separation technique in which surface-active solutes are either concentrated from a dilute solution or separated from a mixture by preferential adsorption at a gas}liquid interface created by sparging an inert gas through the solution. These gas bubbles entrain the surfactant solution and form a stable foam with a large gas}liquid interfacial area. As the foam moves through the column, the surfactant solution tends to drain due to gravity and capillary forces. This results in a decrease in the amount of liquid in the foam. The reduction in the entrained liquid is Rrst associated with the bubbles forming the closest spherical pack-ing, after which they will deform to a dodecahedral shape and then possibly coalesce. Consequently, there is an increase in the gas}liquid interfacial area per unit volume of the liquid. The surfactant tends to adsorb preferentially at the gas}liquid interface. At the top of the column, the foam is sent to a foam breaker where the foam is broken either mechanically or chemically. This results in either enrichment or concentration of more surface-active protein because of the recovery of adsorbed protein from the gas}liquid interface into the bulk entrained liquid. In the case of a dilute solution of a single protein,
the extent of enrichment would depend upon the relative amount of adsorbed protein compared to that in the bulk entrained liquid. In the case of a mixture of proteins in solution, the separation of a protein from the mixture would depend upon the extent of preferential adsorption of that protein at the gas}liquid interface. Since the adsorption isotherm usually leads to a much higher proportion of adsor-bed protein at very low bulk concentrations, foam concentration is very effective for extremely di-lute solutions.
Because of the presence of hydrophilic and hydro-phobic functional groups, proteins are surface active. Therefore, foam-based separations are viable for con-centration/separation of protein solutions. Foam-based separation has been applied to various proteins and enzymes. Experimental investigation has been summarized in Table 1. This review highlights the theoretical aspects of prediction of enrichment and separation of proteins and enzymes in a foam frac-tionation column.
Different Modes of Operation
of a Foam Column
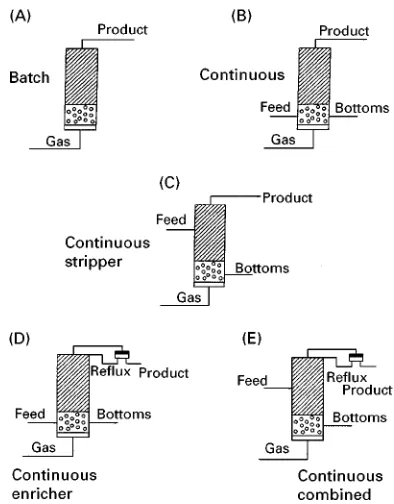
Figure 1 Different modes of operation of a foam fractionation column.
of a column and is sparged with an inert gas which forms the foam. The foam is continuously removed at the top of the column, sent to a foam breaker and the top product collected. Since the most surface-active protein is preferentially removed from the solution, the solution would progressively get depleted in that protein as time progresses. As a result, the pool would get enriched in other components in the case of mix-tures. In continuous operation, a feed stream of pro-tein solution is introduced into the pool and the bottom product withdrawn (Figure 1B). Sparging of gas bubbles mixes the liquid pool well enough so that the bottom product is at the same composition as the liquid pool. In addition, the continuous foam column can also be operated in stripping, enriching or com-bined modes. In the stripping mode, the object is to remove, almost completely, protein from a dilute solution. In this mode, the feed is introduced into the foam and trickles down countercurrently through the rising foam (Figure 1C). The protein concentra-tion in the liquid below the feed-point falls with foam depth, due to it being adsorbed on to the rising bubble surface. There is a net upSow of solution through the foam maintained by entrained up-Sowing liquid from the pool. If the foam column is deep enough the protein adsorbed on the bubble surfaceF, will be in equilibrium with the feed liquid concentrationcF, and the pool liquid concentration will be very low. Conse-quently, the bottom product is stripped of more pro-tein than that in the simple mode of operation. In the
enriching mode (Figure 1D), the feed stream is intro-duced into the liquid pool and part of the top product that is obtained by collapsing the foam is reSuxed into the column. Protein-rich reSux Sows down countercurrently through the foam resulting in fur-ther enrichment of protein in the top product. In the combined mode (Figure 1E), the feed is introduced into the foam and the external reSux is used. Part of the column above the feed acts as an enricher, whereas the bottom part of the column acts as a stripper.
It is reasonable to assume that the residence time of the bubbles through the liquid pool is sufRciently large for protein adsorption to reach close to equilib-rium so that the surface concentration of protein at the gas}liquid interface can be assumed to be close to the equilibrium value. Also, if bubble coalescence in the foam bed is negligible, the concentration of pro-tein in the interstitial liquid can be expected to be the same as that in the liquid pool. For simple mode of operation of the foam column with a continuous feed stream consisting of a dilute protein solution, the top product concentrationcD, is related to the pool con-centrationcBvia:
cD"cB# 6GB
dD [1]
whereGis the gasSow rate,Dis the top productSow rate, d is the bubble size and B is the equilibrium surface concentration of protein at the gas}liquid interface corresponding to the pool concentration. In the above equation, theRrst term on the right-hand side is the contribution to the protein concentration from the bulk interstitial liquid before the foam is collapsed and the second term is the contribution from the adsorbed protein at the gas}liquid interface which is recovered into the bulk upon collapse of the foam. A mass balance around the column now gives the following equations for the top product concen-tration cD and the bottom product concentration
cBrespectively (Lemlich, 1968):
cD"cF# 6GB
d
B
F(F!B) [2]
and:
cB"cF! 6GB
Fd [3]
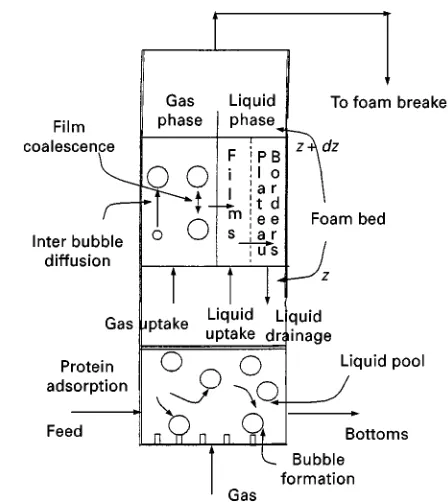
Figure 2 Schematic of various phenomena that take place in a foam column.
two proteins, the separation efRciency S, deRned as the ratio of the two enrichments, is given by:
S"cD, 2 cF, 2
cF, 1
cD, 1
"
1#6G2(cB, 2)
dcF, 2
B F(F!B)
1#6G1(cB, 1)
dcF, 1
B F(F!B)
[4]
where the subscripts 1 and 2 refer to components 1 and 2 andi(cB,i) is the equilibrium surface concen-tration of component i corresponding to the bulk concentrationcB,i. It can easily be seen that the sepa-ration ratio is greater than unity if component 2 is more surface active than 1. Also, in the above equa-tion factor 6 arises because the area per unit volume of spherical bubbles of diameter d is 6/d. If the dodecahedral shape of the bubbles in the foam is to be accounted for, factor 6 is to be replaced with 6.59. For a Langmuir adsorption isotherm, the surface concentration of proteins is related to the bulk con-centration via:
i"
Kici
1# i
Kiaici
, i"1, 2 [5]
where Ki is the equilibrium constant, ci is the bulk concentration andaiis the area occupied by a protein molecule.
In the stripping mode, the feed stream is introduced into the foam (Figure 1C). For a long stripping col-umn, the protein concentration of downSowing inter-stitial liquid will approach that of entrained liquid in the foam. The two concentrations will approach each other at the feed level. Therefore, the protein concen-tration of the interstitial liquid at the top can be taken to be the feed concentration. Therefore, mass balance around the foam column yields (Lemlich, 1968):
cD"cF#
6.59GF
d(F!B) [6]
and:
cB"cF!
6.59GF
Bd [7]
whereFis the equilibrium surface concentration of the protein at the gas}liquid interface corresponding to the feed concentration. SinceF5B,B4F, com-parison of eqns [2] and [3] with eqns [6] and [7] indicates that the stripping mode yields a leaner bot-tom product and richer top product compared to the
simple mode of operation. The separation efR -ciency for a binary mixture is given by:
S"cD, 2 cF, 2
cF, 1
cD, 1"
1#6.59G2(cF, 2)
dcF, 2
1 (F!B)
1#6.59G1(cF, 1)
dcF, 1
1 (F!B)
[8]
Analysis of Foam Column
for the Prediction of Liquid Hold-up,
Enrichment and Separation Factor
Figure 3 Schematic of a bubble in a foam column.
usually results in a wide distribution of bubble sizes whereas either capillaries or oriRces of uniform sizes lead to more or less uniform bubble sizes. Since the volume fraction of liquid in a foam is usually very small, the gas bubbles are distorted and are usually approximated by a dodecahedron (Narsimhan and Ruckenstein, 1986). A typical gas bubble is shown in Figure 3A. The neighbouring gas bubbles are as-sumed to be separated by planarRlms of the continu-ous liquid phase. Where three bubbles touch, their Rlms drain laterally into a Plateau border. This is a channel whose length is the length of a side of the touching dodecahedral bubbles, and whose walls have a sharp concave curvature of radius Rp (Fig-ure 3B). This lateralSow is caused by a pressure drop
Pbetween the liquid pressure in the Rlm, which is essentially the air pressure in the bubble, and the pressure of the liquid in the Plateau border. Ifis the surface tension of the bubble}liquid interface, then:
P"
Rp
[9]
The liquid in the Plateau border drains under grav-ity. Consequently, the liquid hold-up decreases with foam height. The lateral Sow out of the thin Rlms separating the gas bubbles will cause them to thin further, possibly causing them to rupture because of instability resulting from the growth of thermal and mechanical perturbations thus leading to bubble co-alescence. Coalescence leads to internal reSux of the liquid from the rupturedRlms into the Plateau bor-ders and a decrease in the interfacial area because of an increase in the bubble size. The former tends to enhance separation (enrichment) whereas the latter is detrimental. The former effect is usually pre-dominant, so that coalescence leads to higher separ-ation (enrichment). Only when coalescence is excess-ive, collapse of the foam bed occurs. When there is a broad distribution of bubble sizes, diffusion of gas from smaller to larger bubbles may occur because of the difference in the capillary pressure (being
inversely proportional to bubble size) thus leading to the growth of larger bubbles at the expense of smaller ones.
In order to predict the liquid hold-up as a function of foam height, one needs to solve the balance equa-tions for drainage of liquid from thinRlms into the Plateau borders. The equations describing the rate of change, with vertical position, of the volumetric hold-up of the liquid in the Rlms, caused by their drainage into the Plateau borders and bubble coales-cence is given by (Uraizee and Narsimhan, 1995):
!ddz(nfAfxf)!NnfAfV!
N
2 nfAfxf"0 [10]
wherexfis theRlm thickness,nfis the number ofRlms per bubble,Afis the area of theRlm,is the number of bubbles entrained per unit cross-section of the foam,Nis the number of bubbles per unit volume of the foam, andVis the velocity of drainage of theRlm and is the coalescence frequency. and N can be related to the superRcial gas velocity G, liquid hold-up, and the bubble volumevthrough:
"G
v, N"
1!
v [11]
As before, the equation describing the rate of change, with vertical position, of volumetric liquid hold-up in the Plateau borders, caused by Sow from the Rlms into the Plateau borders and bubble coalescence, and gravity drainage is given by (Uraizee and Narsimhan, 1995):
!ddz(npapl)# d dz
4
15NnpapuR
#NnfAfV#
N
wherenpis the number of Plateau borders per bubble,
apis the area of cross-section of Plateau border,Ris the radius of the bubble,lis the length of the Plateau border, and u is the velocity of gravity drainage of Plateau borders. Similarly, the protein balance in the foam can be written as:
!d
dz(npaplcp,i)#
d dz
4
15NnpuRcp,i
#NnfAfVfcf,i#N2 nfAfxfcf,i#
N
2 nfAfi"0, i"1, 2
[13]
wherecp,iandcf,iare the protein concentrations in the Plateau border andRlm respectively. In the absence of coalescence, they would be equal. However, coales-cence would enrich the liquid in the Plateau border because of reSux of adsorbed protein from the rup-tured thinRlms. In the above equation,iis related to the bulk concentrationcivia the Langmuir adsorption isotherm given by eqn [5]. In eqns [12] and [13],
V and u are the velocities of drainage of Rlms and Plateau borders, respectively. For an immobile gas}liquid interface, the velocity of drainage ofRlms into the Plateau borders can be evaluated from the Reynolds equation:
V"2
3
Px3 f
R2 f
[14]
whereRf is the radius of theRlm, is the viscosity, and P is the pressure drop under which the Rlm drains. The velocity of drainage of the Plateau bor-ders for immobile gas}liquid interface is given by:
u" gap
20(3 [15]
whereis the density of the liquid.
Eqns [10], [12] and [13] are initial value problems which have to be solved with proper initial conditions at the foam}liquid interface to evaluatexfandapand
cp,ias a function of foam height.
The liquid hold-up at the foam}liquid interface
(z"0) can be set to the void fraction of spheres
(Uraizee and Narsimhan, 1995):
0"NnfAfxf0#Nnpap0l"0.26 [16]
As the liquid hold-up at the top of the column is much smaller than 0.26, the Sow rate at the top of the
column is much smaller than the entrainment of the liquid at the foam}liquid interface. Hence, the mater-ial balance around the foam yields:
G0 1!0"
4
15N0npap0uR0 [17]
The inlet bubble size R0 depends on the type of sparger and the superRcial gas velocityG. The above two equations can be solved forxf0andap0. Also, the protein concentration inRlms and Plateau borders at the foam}liquid interface can be taken as equal to the pool concentration, i.e.:
cf0"cp0"cB [18]
The pool concentration should satisfy the overall pro-tein balance given by:
FcF"BcB#TcT [19]
where F, B and T refer to feed, bottom and top productSow rates expressed per unit area of cross-section of the foam column. The overall mass balance can be written as:
F"B#T [20]
Eqns [10] to [13] can be solved with the initial condi-tions [16] to [20] to give the proRles ofxf,apandcp,i. The liquid hold-upat any foam height can then be calculated via:
"NnfAfxf#Nnpapl [21]
The enrichment ei for each component is given by (Uraizee and Narsimhan, 1995):
ei"
(NnfAfxfcf,i#Nnpaplcp,i#NnfAfi)T
cF,iT
[22]
where (2)Trefers to the evaluation of the quantity within the parenthesis at the top of the column. The separation factorSis then given by:
S"e2 e1
[23]
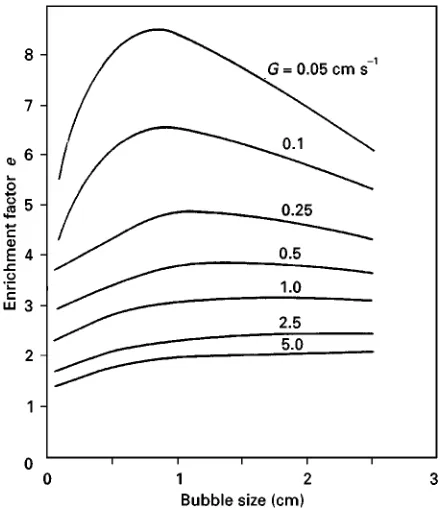
Figure 4 Effect of the inlet bubble size on the enrichment for "10\2P, s"10\4sP, and c0"10\7gmol mL\1. (Repro-duced with permission from Narsimhan and Ruckenstein, 1986a.)
air}water interface. Uraizee and Narsimhan (1995) have modiRed this analysis to account for the kinetics of adsorption of proteins on to the gas bubbles during their travel through the liquid pool before the formation of foam and demonstrated the effects of different parameters including the kinetics of adsorption and pool height on enrichment and recov-ery of proteins.
Effect of Operating Conditions
on Enrichment and Separation
The operating conditions that can be varied in a foam column are the superRcial gas velocityG, the bubble sizeR, the column heightL, feedSow rateF, the feed concentrationcfand the mode of operation. In addi-tion, the separation will also be inSuenced by the viscosity of the feed and the extent of bubble coales-cence in the foam column.
Protein enrichment depends on the total amount of protein selectively adsorbed at the gas}liquid inter-face as well as on the liquid hold-up in the foam. Smaller liquid hold-ups result in a larger interfacial area per unit volume of the liquid and therefore in larger enrichment. At higher superRcial gas velocities, more liquid is entrained by the gas bubbles from the liquid pool leading to higher liquid hold-ups in the foam column and consequently to smaller enrich-ment. As the bubble size increases, a larger propor-tion of the liquid that is entrained by the foam is distributed in theRlm, resulting in a faster drainage rate. On the other hand, an increase in the bubble size results in a decrease in the interfacial area per unit volume. Because of the above two opposing ef-fects, there exists an optimum bubble size at which enrichment may be maximum (Narsimhan and Ruckenstein, 1986) for one component protein solu-tion as shown inFigure 4. In addition, this maximum is found to be more pronounced at smaller superRcial gas velocities. Narsimhan and Ruckenstein (1986) have developed a population balance model to ac-count for the bubble size distribution in the descrip-tion of drainage and coalescence in a foam bed. Their model was able to predict the change in the bubble size distribution as a result of coalescence. The results indicated collapse of the foam bed for broader inlet bubble size distribution with a coefRcient of vari-ation above a critical value. In the case of a mixture of proteins, however, the separation efRciency would depend on the preferential adsorption of one protein over the other components as can be seen from eqns [22] and [23]. As expected, the separation efRciency is higher for the protein which adsorbs the most at the gas}liquid interface with a higher value of . As a result, the separation efRciency
Figure 5 Effect of superficial gas velocity on protein enrichment forcF"0.1 wt%.F"0.02 cm s\1,I"0.1M, pH"7,z"5 cm. The curves refer to model predictions for different bubble sizes. (Reproduced with permission from Brownet al., 1990.)
Figure 6 Comparison of experimental results with model pre-dictions for BSA; feed concentration 0.1 wt%, bubble diameter 1.9;10\3m, gas velocity 2.6;10\3m s\1, foam height 1.3;10\1m,F"2;10\5m s\1, pH 4.8, ionic strength 0.1M. (䢇) Experimental data. (䉭) Model predictions accounting for kinetics of adsorption as well as coalescence. (N) Model predictions accounting only for kinetics of adsorption. (䉬) Model prediction accounting only for coalescence assuming equilibrium surface concentration is shown in the inset. (Reproduced with permission from Uraizee and Narsimhan (1996).)
surface activities of proteins in a binary mixture. For larger values of Langmuir isotherm constant
Ki (more surface active), the separation efRciency increases. In fact, the calculations show that the separation efRciency increases linearly with the ratio K2/K1 (Uraizee and Narsimhan, 1997). How-ever, the separation efRciency was found to de-crease rapidly with the feed concentration of the protein (Uraizee and Narsimhan, 1997).
Brownet al. (1990) measured enrichment and re-covery in a continuous foam concentration column for bovine serum albumin (BSA). In their experi-ments, foam was generated by sparging nitrogen gas through a glass frit. As a result, the foam consisted of nonuniform size distribution of bubbles. They com-pared the experimental data with predictions based on a model similar to the one described above but neglecting drop coalescence. Their experimental data showed a decrease in the protein enrichment with superRcial gas velocity. The model predictions agreed fairly well for the highest feed concentration of 0.1 wt% as shown in Figure 5. The experimental enrichments were found to be larger than the model predictions (even for the largest bubble size in the foam) with the deviation being larger at lower feed concentrations. This was believed to be due to the fact that drop coalescence in the foam column be-came increasingly important at lower feed concentra-tions as conRrmed by experimental measurements of bubble size with the height of the column.
Uraizee and Narsimhan (1996) also observed a de-crease in enrichment with gas velocity for foam concentration of BSA in their continuous foam
Ahmed (1975) observed an increase in the sep-aration efRciency of albumin with the superRcial gas velocity with the value reaching a plateau at sufRciently high gas velocities. Schnepf and Gaden (1959) and Ahmad (1975) reported a max-imum protein enrichment at the isoelectric point of the protein which can be explained by the maximum protein adsorption at the interface due to the absence of electrostatic energy barrier for adsorption. How-ever, this maximum was found to be considerably less pronounced at higher protein concentrations. Protein enrichment was also inSuenced by the change in the bubble size at different pH (Brown et al., 1990). Separation efRciency of albumin was found to decrease dramatically as the foam height increased from 3 to 17 cm (Ahmed, 1975). Even though enrich-ment increased with foam height because of internal reSux resulting from increased drop coalescence, the top product Sow rate was also found to decrease dramatically due to faster drainage. As a result, the protein separation was less at higher foam heights. Ahmed (1975) also found that the introduction of the feed stream into the foam instead of liquid pool increased the separation efRciency because the foam column was operated in the combined mode with an enricher and stripper.
In conclusion, the main attractive features of foam fractionation are its low capital and operating costs. Therefore, it can be employed as a Rrst step for preconcentration/separation before more expensive separation methods can be used. More work is needed to establish the applicability of foam frac-tionation as a viable separation method for mixtures of proteins and to develop new processes based on this technique. Few experimental data are available on the adsorption isotherm and kinetics on to gas}liquid interface for mixtures of proteins. More importantly, it is necessary to probe denaturation (if any) of proteins and enzymes when subjected to foaming.
See also: II /Flotation: Bubble-Particle Capture; Froth Processes and the Design of Column Flotation Cells; Historical Development.
Further Reading
Ahmed SI (1975) Laws of foam formation and foam frac-tionation. 1. The effect of different operating parameters on the foam fractionation of albumin from a solution containing organic and inorganic materials. Separation Science10: 673.
Ahmed SI (1975) Laws of foam formation and foam frac-tionation. 2. The inSuence of different association conditions on surfactants, glycerides, sugar and salts on
the foam fractionation of albumins.Separation Science 10: 689.
Bader R, Schultz F and Stacey M (1944) A crystalline serum mucoprotein with high choline esterase activity.Nature 154: 183.
Bader R and Schultz F (1946) Fractionation by adsorption and crystallization on foam. Part II. Experiments with bile salts.Transactions of the Faraday Society42: 571.
Brown LK, Narsimhan G and Wankat PC (1990) Foam fractionation of globular proteins. Biotechnology and Bioengineering36: 947.
Charm SE, Morningstar J, Matteo C and Paltiel B (1966) The separation and puriRcation of enzymes through foaming.Analytical Biochemistry15: 498.
Davis SG, Fellers CR and Esselen WB (1949) Application of foam fractionation procedures to the isolation of fruit juices.Food Technology3: 198.
Gehle RD and Schugerl K (1984) Protein recovery by continuous fractionation. Applied Microbiology Bio-technology20: 133.
Holmstrom B (1968) Foam concentration of streptokinase from crude cultureRltrates.Biotechnology and Bioen-gineering10: 551.
Lalchev Z, Dimitrova L, Txvetkova P and Exerowa D (1982) Foam separation of DNA and proteins from solutions.Biotechnology and Bioengineering24: 2253. Lalchev A and Exerowa D (1981) Concentration of pro-teins by foaming.Biotechnology and Bioengineering23: 669.
Lemlich R (1968) Principles of foam fractionation. In: Perry ES (ed.)Progress in Separation and PuriTcation, vol. 1, pp. 1}56. New York: Interscience.
London M, Cohen M and Hudson P (1954) Some general characteristics of enzyme foam fractionation. Bio-chimica Biophysica Acta13: 111.
London M and Hudson P (1953) Studies on the puriRcation of acid prostatic phosphatase.Archives of Biochimica Biophysica Acta46: 141.
Narsimhan G and Ruckenstein E (1986) Hydro-dynamics, enrichment and collapse in foams.Langmuir 2: 230.
Narsimhan G and Ruckenstein E (1986) Effect of bubble size distribution on the enrichment and collapse in foams.Langmuir2: 494.
Sarkar P, Bhattacharya P, Mukherjee RN and Muckerjee M (1987) Isolation and puriRcation of protease from human placenta by foam fractionation.Biotechnology and Bioengineering29: 934.
Schnepf RW and Gaden EL (1959) Foam fractionation of proteins: Concentration of aqueous solutions of BSA. Journal of Biochemical,Microbiological and Technolo-gical Engineering1: 1.
Schultz F (1937) Adsorption on foams. Nature 139: 629.
Uraizee F and Narsimhan G (1996) Effects of kinetics of adsorption and coalescence on continuous foam concen-tration of proteins: Comparison of experimental results with model predictions.Biotechnology and Bioengineer-ing51: 384.
Weijenberg DC, Mulder JJ, Drinkenburg AAH and Stemerding S (1978) The recovery of protein from po-tato juice waste water by foam separation.Journal of Engineering and Chemical Processing, Design and Development17: 209.
Froth Processes and the Design of Column Flotation Cells
I. M. Flint, Canadian Process Technologies Inc., Vancouver, BC, Canada
M. A. Burstein, NPACI Edcenter on Computational Science and Engineering, San Diego State University, San Diego, CA, USA
Copyright^ 2000 Academic Press
Introduction
The function of a Sotation column is selectively to separate certain suspended solid particles or liquid droplets based on their surface properties. Bubbles rise and particles (drops) settle within the vessel, and colli-sions are highly dependent on gravitational momentum. The vessel is a multiphase contacting/heterocoagulation device where the dispersed phase to be removed at-taches to the bubbles and accumulates at the top of the column in the form of froth. The latter overSows to launders. In this quiescent system, transport, dispersion and mixing of materials are induced by the motion of gas bubbles in the continuous liquid medium.
For the purpose of designing columns, immiscible liquid droplets are considered as acting as solid spheres of an appropriate size and density: thus, a ‘particle’ may represent either a solid or a liquid.
Almost all Sotation columns are operated in the countercurrent regime where slurry moves down-wards against a continuous rising bubble swarm. This type of Sow increases efRciency (selectivity) of separation as the distance between discharge ports for overSow and underSow is large. In some cases, for example for the Sotation of very coarse particles, co-current columns can be considered in order to increase particle residence time and reduce loaded bubble rise time. Unless otherwise stated, all of this article is related to countercurrent columns.
Initial Design Data
The feed transport Suid must be characterized in terms of liquidSow rate and chemical composition. Component solids or immiscible liquid Sow rate, material composition and size distribution must also be known. In all cases, mean values, standard
deviations and design maxima and minima are required.
Test work must be done, or approximations made, to determine theSotation characteristics of the mater-ial to be separated, including rate constants and max-imum recovery for all material and particle (droplet) size fractions. Process targets must be well under-stood, including the desired quality of products and recovery. Data error must be minimized since it dir-ectly impacts on the accuracy of the design scale-up. Site-speciRc information is also required for Rnal designs. This includes limitations in dimensions due to plant layout, civil engineering speciRcations, in-cluding such items as wind loading, earthquake con-siderations, supporting platforms and others.
General Dimensions
Typically, columns range in height from 6 to 15 m. This height is dictated by the dimensions of the dif-ferent zones within the column but is most inSuenced by the collection zone height.
Column cross-sections are usually round or rectan-gular. Cylindrical columns do not have specialSow conditions at the corners. They, therefore, usually have a more uniform air and feed distribution, less tank weight due to the self-supporting nature of the structure and less wall area per unit operating vol-ume. Rectangular columns use floor space more efRciently and are easier to bafSe. The cross-sectional area is usually constant throughout the vessel and is determined by carrying capacity and residence time considerations in the collection and froth zones. Typi-cal industrial cell cross-sectional areas range from less than 1 m2to more than 12 m2.