WITH PHYSICS-BASED DEGRADING MATERIALS
ON PARALLEL COMPUTERS
Thesis by
In Ho Cho
In Partial Fulfillment of the Requirements
for the Degree of
Doctor of Philosophy
California Institute of Technology
Pasadena, California
2012
2012
In Ho Cho
Acknowledgements
I’m deeply grateful to Professor Hall. He has been always fully supportive and willing to provide warm advice and suggestion, which actually turned out to be instrumental for my research outcome. Thanks also go to Professor Krishnan for his persistent support about parallel computers. Indeed, his persistent support and sharp advice are essential for my bold attempt. I’m really grateful to Professor Heaton and Professor Beck for their warm encouragement throughout the years in Caltech. I’m pretty sure I won’t find better faculty members in any school all around the world. Special thank also goes to Dr. Aivazis for his wonderful class about parallel algorithm and kind support as a committee member.
It was you guys, Vanessa and Gokcan that I can happily stay here in Caltech for last four years, and thank you so much.
I’d like to express my love to my parents. You are the origin of my strength and all my creativity; your love is the origin of my happiness. It is the unconditional trust of my sister and brother that make me be strong and bold. I love you guys. Also, I’m deeply grateful to you, mother-in-law because I can always hear your voice of prayer.
I love you Jiwon. Without you, I was definitely not able to reach this moment. Also, I can’t journey on in this evanescent place without your love. You already completed me more than I ever imagined.
Abstract
For the last few decades, we have obtained tremendous insight into underlying microscopic mechanisms of degrading quasi-brittle materials from persistent and near-saintly efforts in laboratories, and at the same time we have seen unprecedented evolution in computational technology such as massively parallel computers. Thus, time is ripe to embark on a novel approach to settle unanswered questions, especially for the earthquake engineering community, by harmoniously combining the microphysics mechanisms with advanced parallel computing technology.
To begin with, it should be stressed that we placed a great deal of emphasis on preserving clear meaning and physical counterparts of all the microscopic material models proposed herein, since it is directly tied to the belief that by doing so, the more physical mechanisms we
incorporate, the better prediction we can obtain.
We departed from reviewing representative microscopic analysis methodologies, selecting out “fixed-type” multidirectional smeared crack model as the base framework for nonlinear quasi-brittle materials, since it is widely believed to best retain the physical nature of actual cracks. Microscopic stress functions are proposed by integrating well-received existing models to update normal stresses on the crack surfaces (three orthogonal surfaces are allowed to initiate herein) under cyclic loading.
entire domain. Validation against a well-documented rough crack experiment reveals promising accuracy of the proposed 3d interlocking model.
A consumed energy-based damage model has been proposed for the weak correlation between the normal and shear stresses on the crack surfaces, and also for describing the nature of
irrecoverable damage. Since the evaluation of the consumed energy is directly linked to the microscopic deformation, which can be efficiently tracked on the crack surfaces, the proposed damage model is believed to provide a more physical interpretation than existing damage mechanics, which fundamentally stem from mathematical derivation with few physical counterparts.
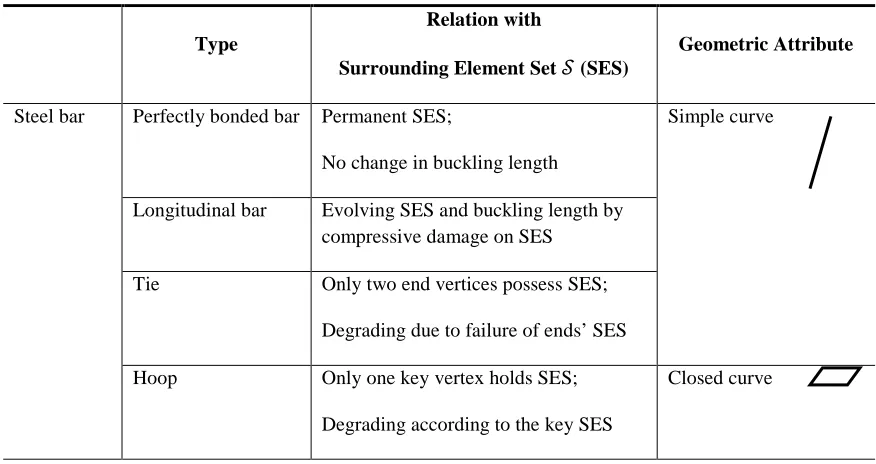
Another novel point of the present work lies in the topological transition-based “smart” steel bar model, notably with evolving compressive buckling length. We presented a systematic framework of information flow between the key ingredients of composite materials (i.e., steel bar and its surrounding concrete elements). The smart steel model suggested can incorporate smooth transition during reversal loading, tensile rupture, early buckling after reversal from excessive tensile loading, and even compressive buckling. Especially, the buckling length is made to evolve according to the damage states of the surrounding elements of each bar, while all other dominant models leave the length unchanged.
The parallel platform established offers unprecedented access to simulations of real-scale structures, giving new understanding about the physics-based mechanisms adopted and probabilistic randomness at the entire system level. Particularly, the platform enables bold simulations of real-scale RC structures exposed to cyclic loading–H-shaped wall system and 4-story T-shaped wall system. The simulations show the desired capability of accurate prediction of global force-displacement responses, postpeak softening behavior, and compressive buckling of longitudinal steel bars. It is fascinating to see that intrinsic randomness of the 3d interlocking model appears to cause “localized” damage of the real-scale structures, which is consistent with reported observations in different fields such as granular media.
Equipped with accuracy, stability and scalability as demonstrated so far, the parallel platform is believed to serve as a fertile ground for the introducing of further physical mechanisms into various research fields as well as the earthquake engineering community. In the near future, it can be further expanded to run in concert with reliable FEA programs such as FRAME3d or
OPENSEES. Following the central notion of “multiscale” analysis technique, actual infrastructures exposed to extreme natural hazard can be successfully tackled by this next generation analysis tool–the harmonious union of the parallel platform and a general FEA program. At the same time, any type of experiments can be easily conducted by this “virtual laboratory.”
Table of Contents
List of Figures ... xi
List of Tables ... xvi
Chapter 1 INTRODUCTION ... 1
Chapter 2 PHYSICS-BASED DEGRADING MATERIAL MODELS ... 6
2.1 Review of Microscopic Material Models ... 6
2.1.1 Continuum Elastoplastic Models ... 8
2.1.2 Smeared Crack Models ... 10
2.1.3 Particle-Lattice Models ... 13
2.2 Outline of Physics-Based Degrading Material Model ... 14
2.3 Revisit to “Fixed-Type” Multidirectional Smeared Crack Model ... 15
2.3.1 Hybrid Domain Concept ... 15
2.3.2 Strains on the Crack Surfaces and Criterion for Mode-I Cracking ... 16
2.3.3 Stress Update on the Crack Surfaces ... 17
2.4 Damage Models ... 24
2.4.1 Review of Damage Models ... 24
2.4.2 Consumed Energy-Based Damage Model ... 28
2.5 Poisson Effect and Transformation to Crack Coordinates ... 31
2.6 3d Interlocking Model for Nonlinear Shear ... 35
2.6.1 Random Particle Distribution ... 41
2.6.2 Interlocking during Cyclic Movement ... 44
2.6.4 Effect of Number of Elements and Mean Diameter of Particles ... 48
2.7 “Smart” Reinforcing Steel Bar Model ... 50
2.7.1 Review of Previous Research ... 50
2.7.2 Challenges of Existing Models ... 53
2.7.3 Definition of Topological Group ... 55
2.7.4 Topological Transition: Longitudinal Bar Type ... 58
2.7.5 Remarks on Parallel Implementation ... 61
2.7.6 Generalized Menegotto-Pinto Steel Model ... 63
2.7.7 Example of Topological Transition-Based Buckling... 66
2.7.8 Steel Bar Models Implemented in the Present Work ... 68
Chapter 3 PARALLELIZATION STRATEGIES ... 69
3.1 Outline of Parallel Platform Developed ... 69
3.2 Review of Parallel Computing in Broader Fields... 71
3.3 Key Characteristics of the Serial Version Program ... 74
3.4 Quantitative Study on the Advanced Parallelization Strategies ... 76
3.5 Cost Model for Parallel Factorization ... 79
3.5.1 Behavior of Cyclic Allocation Scheme... 79
3.5.2 Total Cost of Parallel Factorization with Cyclic Allocation ... 81
3.6 Optimized Parallel Factorizations with “Super Linear” Speedup ... 83
3.7 Parallel Triangular System Solving versus Parallel PCGM ... 86
3.8 “Divide-and-Conquer” for Embarrassingly Parallelizable Procedures ... 90
3.9 Issues on Load Balance and Error from Parallelization ... 94
3.10 Physical Mechanisms and Randomness Fed by Parallelization ... 95
Chapter 4 APPLICATIONS TO REAL-SCALE STRUCTURES ... 98
4.1 H-Shaped Wall System under Cyclic Loading ... 98
4.2 4-story T-Shaped Wall System under Cyclic Loading ... 108
Chapter 5 CONCLUSION AND FUTURE DIRECTION ... 116
5.1 Conclusion ... 116
5.2 Future Directions ... 119
Appendices ... 120
Appendix A Examples of poisson effect by equivalent strain method ... 120
Appendix B Steel bar models ... 123
Appendix C Detailed pseudocodes of parallel factorizations ... 128
Appendix D Partial pipelined parallel factorization for banded system ... 134
List of Figures
Figure 1.1. Elementary school severely damaged by the Mw (moment magnitude) 7.0 Tahiti
earthquake of January 12, 2010, showing the localized shear failure on shear wall system and a column on second floor (from USGS/EERI report 2010). ... 1 Figure 2.1. Microscopic numerical analysis methodologies, plotted over corresponding length
scale and degree of physical counterparts required to calibrate salient parameters and to interpret prediction generated. ... 7 Figure 2.2. Schematic example of embedded crack trajectory (in bold straight line) with enforced
continuity of the crack path attained from nonlocal strain concept. ... 8 Figure 2.3. Increasing deviation of crack surface direction from that of current principal strains: (a)
representative volume of quasi-brittle material under shear; (b) after the onset of tensile crack, the compressive principal strain 𝜀3≈0 and direction of crack surface is almost coincident with that of principal strains; (c) under excessive shear, considerable
difference between the two directions develops; (d) schematic illustration of microplanes at microscopic length scale for comparison. ... 10 Figure 2.4.Hybrid domain concept for microscopic stress evaluation on the crack surfaces: (Right
top) Homogeneous domain for normal stresses and (Right bottom) heterogeneous domain impregnated with random particles for 3d interlocking to update shear stresses (Left: real-scale RC structure damaged by cyclic loading, from Palermo and Vecchio 2002). ... 16 Figure 2.5. Nonlinear tension softening model. ... 19 Figure 2.6. Work done by Mode-I cracking opening with nonlinear softening. ... 20 Figure 2.7. Microscopic stress function based on Thorenfeldt compression model augmented by
tension regime and un/reloading paths (Left); sensitivity of curve shape to strengths (Right). ... 22 Figure 2.8. Tensile resistance development depending on previous compressive damage. ... 23 Figure 2.9. Progressive damage in matrix in vicinity of ideal sphere. ... 28 Figure 2.10. Interpretation of damage factor d as an area ratio, and possible inclusion of the
lateral confinement/hydraulic pressure dependence by the expansion of stress function 𝑔.
proposed herein (Left); Typical asperity model in tribology for comparison (Right). Figure 2.12. The base couple of rigid particle-soft matrix for 3d interlocking model being
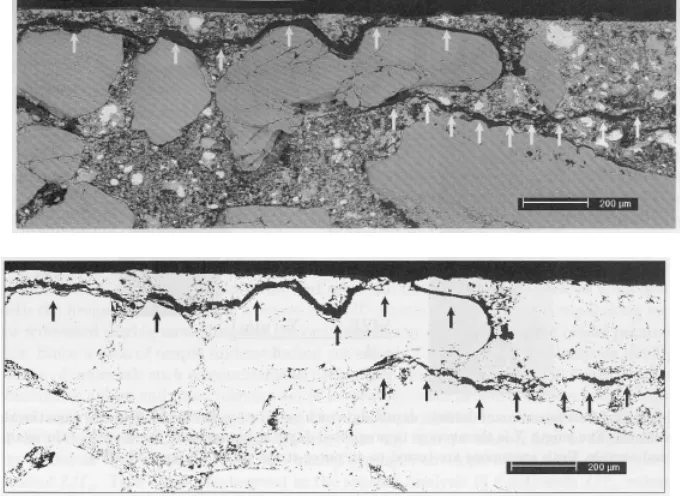
... 35 Figure 2.13. Permanent plastic damage to the soft matrix by cyclic movement. ... 35 Figure 2.14. Micrographs revealing micro-cracking along the aggregate boundaries of a concrete
specimen: (Top) Actual cross section of concrete specimen showing crack patterns emphasized by arrows; (Bottom) Clearly visible cracks after image processing (from Elkadi 2005). ... 36
Figure 2.15. Projections of contacting area of the ideal hemisphere with diameter 𝐷max. ... 37 Figure 2.16. Degradation of tangent shear stiffness with several friction coefficients: (a) when 3d
hemisphere is used; (b) 2D semicircle is adopted for interlocking mechanism, exhibiting relatively stiff nature than that with 3d hemisphere. ... 39 Figure 2.17. Variation of tangent shear stiffness depending on crack opening. ... 39 Figure 2.18. Interlocking states during cyclic loading (all shear strain and shear stress terms
signify those on the crack surfaces). ... 44 Figure 2.19. Validation setup of 3d interlocking model against experiment: (a) actual
experimental specimen; (b) numerical modeling of specimen with initial Mode-I crack, marked by arrows in the middle layer [for visualization purpose, only 25 element blocks are shown]; (c) random particle distribution along the middle layer of 2500 elements. ... 47 Figure 2.20. Horizontal slip-resultant force responses (force is represented by corresponding
shear stress). ... 47 Figure 2.21. Normalized maximum horizontal forces with varying element numbers for two
random particle distributions–Normal and Uniform distributions. ... 49 Figure 2.22. Effect of particle size on resultant horizontal force from 3d interlocking model. ... 49 Figure 2.23. Initiation of compressive buckling and postbuckling behavior of longitudinal steel
bar under compression (adapted from Dhakal an Maekawa 2002a). ... 51 Figure 2.24. Study of reinforcing steel bar system from the idealized to realistic case: (a) typical
reinforcing bar test setup with single spacing; (b) simplified bar system with horizontal ties represented by ideal springs; (c) realistic reinforced system of composite material. . 53 Figure 2.25. Basic topological groups: (Left) longitudinal steel group with initial buckling lengths
(gray color signifies at least partially crushes state of the element while white relatively intact state).
Figure 2.26. Criterion for topological transition according to damage on surrounding elements
... 58
Figure 2.27. Example of topological transition and evolving buckling lengths. ... 60 Figure 2.28. Schematic description of parallel update of compressive buckling of steel bars by
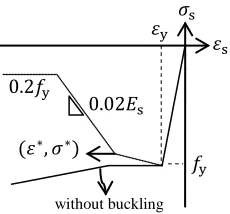
means of “master-slaves” strategy. ... 61 Figure 2.29. Longitudinal steel hysteresis model with compressive buckling and tensile rupture.63 Figure 2.30. Contrast between buckling modes intentionally generated: (Middle) a cyclically
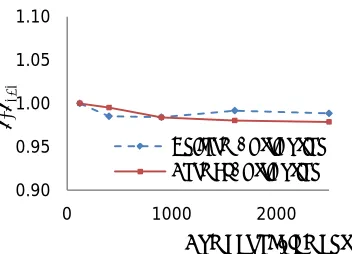
loaded column consisting of a longitudinal steel bar and three layers of surrounding elements; (Left) when two bottom layers failed first; (Right) only bottom layer failed. .. 66 Figure 2.31.Predicted stress-strain response revealing different buckling lengths triggered by
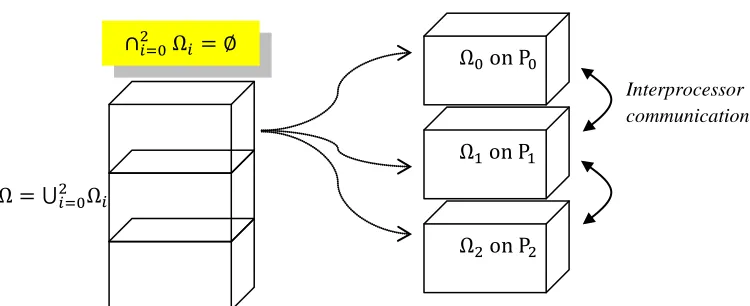
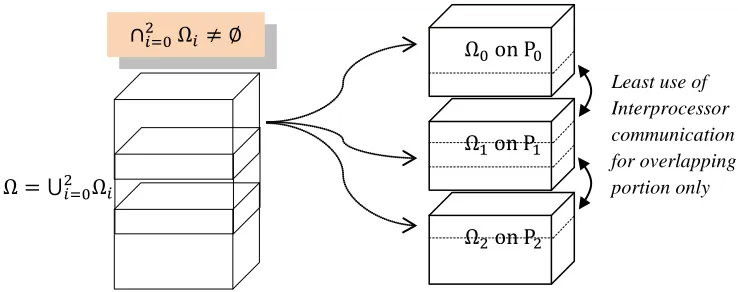
topological transition (Left), which are based on the compressive failure of surrounding elements (Right). ... 67 Figure 2.32. Onset of early buckling captured by the simulations revealing distinct initiation point of buckling due primarily to evolving buckling length by topological transition. ... 67 Figure 3.1. Nonoverlapping domain/tasks decomposition strategy, widely used in “explicit”
algorithms. ... 72 Figure 3.2. Coarse-grained domain/tasks decomposition strategy (e.g., used in hierarchical
multiscale analysis), notably with the distinct communication schemes. ... 72 Figure 3.3. Partially overlapping domain/tasks decomposition strategy (e.g., some GIS algorithms with intrinsic “nonlocality”). ... 73 Figure 3.4. Costs of parallel factorizations attained from numerical simulations of a test system
(size=2040): parallel Gaussian elimination (dashed line) and parallel factorization followed by triangular system solving (solid line). ... 77 Figure 3.5. Costs of look-ahead and pipelined factorization normalized by that of broadcasting
method, all attained from simulations of a test system (size = 19176). ... 78 Figure 3.6. Super linear speedup attained from simulations of a test structure (system size n =
32400; bandwidth = 8145). ... 85 Figure 3.7. Cost comparison between parallel PCGM and parallel triangular system solving. ... 89 Figure 3.8. Master-slaves for all trivially parallelizable tasks along with nonoverlap uniform
strategy, attained from simulations of a test model consisting of 2784 concrete and 3372 steel bar elements.
Figure 3.9. Speedup in nonlinear element updating procedure by “divide-and-conquer”
... 91
Figure 3.10. Column-based cyclic allocation on all processors for factorization and solving... 92 Figure 3.11. (a) Thorenfeldt compressive model generalized by un/reloading model; (b) tension
softening regime defined on three orthogonal crack surfaces; (c) the fabic of rigid hemisphere-soft indentation proposed by the authors for nonlinear shear across opened crack; (d) Reinforcing steel bar model incorporating compressive buckling. ... 96 Figure 4.1. H-shaped wall system (DP1) details. ... 99 Figure 4.2. Reinforcement layout for H-shaped wall system (DP1). ... 100 Figure 4.3. Unstructured random distribution of ideal particles over entire H-shaped RC wall
system; the random particles are intended to realize the irregular asperity configuration, not the actual aggregate sizes. ... 101 Figure 4.4. Applied displacement history to DP1 (by courtesy of D. Palermo and F. J. Vecchio).102 Figure 4.5. Ultimate damage on flange part showing U-shaped and flexural cracking (Palermo
and Vecchio 2002, with permission from ACI publishing). ... 102 Figure 4.6. Ultimate damage on web part exhibiting distributed diagonal cracks and localized
sliding planes with vertical directivity (Palermo and Vecchio 2002, with permission from ACI Publishing). ... 103 Figure 4.7. Effect of 3d interlocking model on the global force-displacement responses (simulated
up to 12 mm near the peak load-carrying capacity). ... 104 Figure 4.8. Deformed shape (amplified) with/without 3d interlocking model (Note: by
introducing the 3d interlocking mechanism, the localized damage with vertical directivity marked in dashed arrow can be captured). ... 105 Figure 4.9. Cost plot of factorization and nonlinear element update after normalization by the cost
for p = 16. ... 106 Figure 4.10. Influence of damage model on the rapid postpeak softening response (both
Figure 4.13. Applied displacement history (TW2). ... 110 Figure 4.14. Effect of 3d interlocking model on global force-displacement response; Negative
displacement corresponds to the case of flange under tension while the positive range signifies flange under compression, as depicted in insets. ... 112 Figure 4.15. Deformed shape (amplified) at the last step of the simulation, revealing concentrated
severe damage at boundary part of web and localized damage with diagonal directivity (marked by dashed arrows) by virtue of 3d interlocking model. ... 112 Figure 4.16.Contrast of stress-strain responses from longitudinal steel bars depending on the
locations: the outermost positions of web toe (left) and of flange (right); Superimposed plot of deformed steel bars at bottom floor only (top). ... 114 Figure 4.17.Evolution of compressive buckling length of the longitudinal steel at the outermost
position of web toe; right inset shows actual damage states of the specimen (from
List of Tables
Table 2.1. Steel bar type definition and characteristics ... 54
Table 2.2. Data structure in smart steel bar model ... 60
Table 3.1. Flow of serial version of displacement-controlled nonlinear FEA program ... 74
Table 3.2. Total time cost comparison of full-/partial- parallel factorizations without/with prudent numbering [sec] ... 84
Table 3.3. Pseudocode of the optimized parallel algorithm for the upper triangular system, successfully exploiting column-based cyclic distribution and banded nature ... 86
Table 3.4. Pseudocode of parallel PCGM for Kx=b ... 87
Table 3.5. Cost of parallel PCGM, parallel factorization, and parallel triangular system solving in [sec] (system size n = 32400; bandwidth = 8145). ... 88
Table 4.1. Concrete material property (DP1) ... 100
Table 4.2. Steel material property (DP1) ... 100
Table 4.3. Concrete material property (TW2) ... 109
Chapter 1
INTRODUCTION
Nonlinear analysis of complicated structures, especially involving irrecoverable damage and disintegration phenomena such as cracking and crushing, has been of central importance in a wide range of fields in science and engineering. Particularly, in the earthquake engineering community, accurate numerical simulation plays an essential role in increasing resilience of infrastructures during design stage, providing the optimal rehabilitation remedy, and even generating precise probabilistic fragility curves for loss estimation process–all against the most catastrophic and yet unpredictable natural hazard, earthquake.
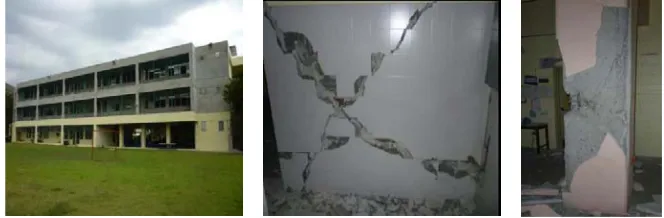
As shown in figure 1.1, nonlinear shear and localized damage phenomena are still long-standing challenges of earthquake engineering field. As a demonstrative example, the key
assumption of the popular fiber section model (i.e., plane section remains plane after deformation) hardly captures the abrupt emergence of localized cracks and highly disturbed strain fields on the domain.
[image:17.612.158.490.428.537.2]
Figure 1.1. Elementary school severely damaged by the Mw (moment magnitude) 7.0 Tahiti
earthquake of January 12, 2010, showing the localized shear failure on shear wall system and a column on second floor (from USGS/EERI report 2010).
In the present study, a novel attempt has been made by developing a parallel simulation platform for nonlinear implicit finite element analysis of real-scale 3d RC structures. The
possible in describing nonlinear behavior of materials; (3) it naturally holds unlimited
extensibility to embrace more realistic phenomena such as compressive buckling of steel bars, localized failure of the domain with random material properties, etc.
Indeed, for the last decades we have seen tremendous progress in computing technology for solving engineering and scientific problems, which enables us to conduct numerical simulation of virtually any real-scale structures under extreme loadings. Furthermore, a multitude of
sophisticated outcomes from persistent laboratory experiments provide unprecedented insight into microscopic damage mechanisms, which underlie random failure and localized damage
phenomena of real-world structures. By virtue of such advances in different frontiers, time is ripe to embark on a bold attempt to directly link microscopic physics to real-scale structures exposed to extreme conditions, and to validate the physical mechanisms against “actual” structures of interest, rather than against idealized and controlled laboratory scale specimens.
In the present study, we made an attempt to incorporate as much microscopic, physical mechanisms as possible with the aid of elaborately optimized parallel computing technology. In some sense, the parallel platform calls for novel material models which are essentially rooted in physically reasonable mechanisms for degrading material phenomena. Otherwise, the parallel platform would merely become an assembly of a large number of processors, only saving the computation cost and reproducing “expected” responses from the idealized governing
mechanisms. However, provided that the parallel simulation platform is made to play in concert with physical mechanisms, it is fundamentally certain that the more physical mechanisms are used, the more accurate prediction the platform will generate.
the tribology-inspired 3d interlocking model. Following the central notion of smeared crack model, all the nonlinearity of material is explained on the reduced crack surfaces and reliable microscopic stress functions are harmoniously suggested to give rise to an integrated normal stress-strain relationship on the crack surfaces.
Particularly, in section 2.6, we develop 3d interlocking mechanism. As mentioned before, the fixed-type smeared crack model holds pathological nature–namely, spurious large shear stress transfer over the open cracks when exposed to nonproportional loading. In fact, resolving this problem by use of physically plausible mechanism was the key motivation of the 3d interlocking model. Inspired by the main trend of tribology, we adopted the base fabric of rigid particle-soft matrix, of which interaction generates nonlinear shear stress on crack surfaces during cyclic loading. As many researchers in tribology utilized the Gaussian distribution to form the random asperity of rough crack surfaces, we used the Gaussian distribution to generate random particle sizes and then distributed them, notably over “entire” domain. To this aim, a hybrid domain assumption was made, which consists of two domains: homogeneous domain for normal stress on the crack surfaces and heterogeneous domain for shear stress on the crack surfaces. Validation of the 3d interlocking mechanism proposed has been carried out against a well-known rough crack experiment, revealing remarkable accuracy and possibility of the model.
In section 2.4, consumed energy based damage model is suggested. The damage model is bridging the gap between the normal and shear stress on the crack surfaces, which are weakly correlated on the hybrid domain assumption. The idea is based on the fact that “damage” is global and universal quantity and also can be represented by a tractable value such as scalar quantity, as widely done in damage mechanics. It is noteworthy that the proposed quantity for damage is explicitly rooted in consumed energy of the material, not in the implicit one such as the mathematically driven quantity. Therefore, the damage model proposed herein also holds clear physical counterparts in accordance with the main philosophy of the present parallel platform.
progressive damage of surrounding quasi-brittle materials. Loss of adhesive energy of materials near the longitudinal steel bars is interactively and comprehensively considered to determine realistic evolution of buckling length at a specific time. In some sense, this provides a systematic platform of information flow between structural constituents of composite structures (e.g., between steel bars and surrounding concretes in the present application).
Chapter 3 is mainly concerned with parallelization strategies. It deals with the optimization of parallel algorithms to best fit the present problem, which can be characterized by “implicit” solving, considerably expensive cost in terms of memory and computation, displacement control strategy, penalty method employed for enhanced stability, and most important, highly nonlinear material behavior. We started from comprehensive comparison study on the advanced parallel algorithms, and then we tuned the selected pipelined algorithm to successfully embrace advantageous natures of the problem. Applications of the optimized algorithm to real-scale structures proved promising possibility of the parallel platform with desired scalability and parallel efficiency in nonlinear element-related tasks.
In chapter 4, we present applications of the platform to study real-scale RC structures loaded by inverted cyclic displacements up to severely damaged states–i.e., 3d H-shaped wall system and 4-story T-shaped wall system. Results from the numerical simulations confirm that the well-known pathological nature of fixed-type smeared crack model has been successfully resolved by the inclusion of 3d interlocking mechanism. It is also fascinating to observe that the randomness of particles, distributed over the entire domain for the 3d interlocking mechanism, appears to play an essential role to cause apparently “localized” damage, while the damage would otherwise happen in a smoothly scattered manner.
As demonstrated so far, harmonious combination of advanced parallel computing technology and microphysical mechanisms sparks our imagination as regards next steps.
Embracing more physical mechanisms –e.g., lateral confinement effect and hydraulic pressure dependence as well as parallel strategies for their nonlocal formulations–shall be natural
Chapter 2
PHYSICS-BASED DEGRADING MATERIAL MODELS
2.1 Review of Microscopic Material Models
Before embarking upon detailed review of the microscopic analysis methodologies for degrading quasi-brittle materials, it is instructive to touch upon the other pole–the macroscopic and phenomenological methodology, particularly dominant in the earthquake engineering community. As an early effort, the global force-displacement responses of reinforced concrete (RC) structures were represented by heuristic hysteresis models in the form of nonlinear springs (Cheng et al. 1993) or equivalent beam-column systems (Colotti 1993). Recently, the most advanced and widely used one is the fiber section model (e.g., Gan and Hall 1995; Krishnan 2010), and especially for the degradation phenomena of RC beam-column (see a review by Spacone and El-Tawil 2004) the fiber section model has proved successful and efficient tool. Even slender RC wall system had been analyzed by the fiber section model by incorporating nonlinear spring (e.g., Orakcal and Wallace 2006). However, the fundamental assumption behind their formulations–plane section remains plane after deformation–poses an important challenge to general applications where shear effect is essential in nonlinear degradation. Although such macroscopic and phenomenological approaches are still dominant in practice, it is believed that they will gradually give the way to highly sophisticated and general microscopic approaches with the aid of evolution of computing capacity, just as what fiber section model has done for the last decades.
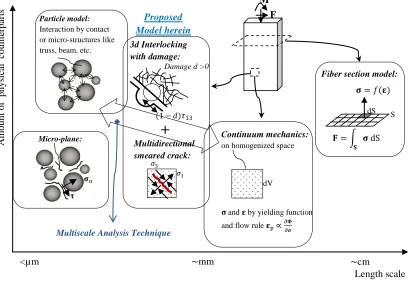
Figure 2.1. Microscopic numerical analysis methodologies, plotted over corresponding length scale and degree of physical counterparts required to calibrate salient parameters and to interpret prediction generated. Length scale A m ount of p h y sic al count er p ar ts ~mm
<µm ~cm
Continuum mechanics: on homogenized space
𝛔and 𝛆by yielding function and flow rule 𝛆p∝∂𝚽
∂𝝈 dV Micro-plane: 𝛕 𝛔n Particle model:
Interaction by contact or micro-structures like truss, beam, etc.
+
𝜎1
𝜎3
(1− 𝑑)𝜏13 Damage d >0 3d Interlocking with damage: Multidirectional smeared crack: Proposed Model herein
Multiscale Analysis Technique
𝛔=𝑓(𝛆)
𝐅=� 𝛔 dS 𝐒
S dS Fiber section model:
M
2.1.1 Continuum Elastoplastic Models
As the first category of representative microscopic approaches, we can find extensive effort to embrace nonlinear damage process into the continuum elastoplastic framework: one is referred to, for instance, papers by Simo and Ju (1987a, 1987b) for quasi-brittle material, Steglich et al.(2005) for ductile material under cyclic loading, and Hicher et al.(2008) for soils exposed to cyclic force. Even localized phenomena such as shear band were embedded within an element level with a specific emergence criterion which is based on the mathematical condition of tangent stiffness Dijkl(T) and geometric information of the slip (e.g., Ortiz 1987; Jirásek 1998). Such embedded cracks at element level are used to describe discrete cracks after finding crack direction and jump in displacement gradient which altogether met the localized failure criteria as
�σ̇ij�= Dijkl(T)⟦ε̇kl⟧, (2.1)
where strain rate jump has kinematic relationship with discontinuity direction 𝐧 and displacement gradient jump 𝐠 as �εij�= 1/2(ginj+ gjni).
This approach is regarded to be good for predicting localized failure of general materials, and even it is able to successfully capture the localized crack with continuous path across adjacent elements as depicted in figure 2.2. However, it is extremely sensitive to the tangent stiffness matrix adopted, which causes difficulty in applying this elegant method to RC structures undergoing severely damaged states by cyclic/seismic loading. Moreover, from the physical perspective, when subjected to cyclic or seismic loading, the damage often appears to be localized on a number of specific zones through crushing and pulverization rather than a simple line within an element.
Figure 2.2. Schematic example of embedded crack trajectory (in bold straight line) with enforced continuity of the crack path attained from nonlocal strain concept.
quasi-brittle materials are also hard to be explained by the continuum approaches with classical plasticity theories. Furthermore, many decisive parameters for yield function and flow rule are generally intractable since it is not easy to find their physical counterparts.
2.1.2 Smeared Crack Models
The second category of the microscopic approach is so-called smeared crack model, and they commonly adopt the notion of “plane of degradation” on which the nonlinear behavior is locally estimated. On the reduced space of plane of degradation, the normal and shear stresses are estimated from simple, fundamental rules proposed, and then transformed into the counterparts in the global, three-dimensional space, normally through some integration process.
In terms of definition of the plane of degradation, three major trends can be distinguished: (1) fixed crack model, (2) rotating crack model, (3) microplane model. Figure 2.3(b) and (c) shows gradually increasing deviation between two directions of initial crack and current principal strains inside the cracked material. In the fixed crack model, the plane of degradation is intentionally kept identical to the initial crack direction whereas in the rotating crack model, it is constantly evolved (rotated) so as to retain coaxiality between the two directions. It is obvious that in reality the deviation between the two directions might become markedly large as shown in figure 2.3(c). For clear comparison, the microplane model is given in figure 2.3(d), accompanied by a multitude of the plane of degradations at highly microscopic length scale.
Figure 2.3. Increasing deviation of crack surface direction from that of current principal strains: (a) representative volume of quasi-brittle material under shear; (b) after the onset of tensile crack, the compressive principal strain 𝜀3 ≈0 and direction of crack surface is almost coincident with that of principal strains; (c) under excessive shear, considerable difference between the two directions develops; (d) schematic illustration of microplanes at microscopic length scale for comparison.
First, the fixed-type smeared crack model has the cardinal advantage of retaining the physical attribute of crack in such a way that the primary crack surface remains unchanged under
subsequent loadings. On this account, fixed crack model shows good performance in predicting failure of quasi-brittle material, provided it is mainly governed by Mode-I crack. Many variants, after Rashid (1968), stem from this physically sound crack model to tackle various problems–e.g., nonorthogonal multiple crack model (de Borst and Nauta 1985) and adaptive fixed crack model (Weihe et al. 1998). Aiming at two-dimensional debonding problem found in composite
ε1
ε3 ε3
ε1 Crack directions
Principal strains
(a) (b) (c) (d)
materials, for instance, Weihe et al.(1994) exploited the fixed crack model without secondary cracks in an attempt to describe the mixed mode failure. In their work, evolution of the strength-based fracture criterion is controlled by the dissipated energies, produced by Mode-I and Mode-II failure independently.
The downside of fixed crack model, however, is also well known. In the method, considerable strain change, which is induced by nonproportional loading, tends to result in spurious stresses parallel to the primary crack surface, eventually leading to unacceptable stress state even far larger than the material strengths. This deleterious attribute, therefore, gave rise to various supplementary alternatives. Adaptive fixed crack model by Weihe et al.(1998), for instance, was an attempt to unify fixed crack model and rotating crack model encompassing a wide range of materials from brittle to moderately ductile. On the framework of fixed crack model, additional multiple cracks are allowed to take place in order to accurately consider progressive degradation after onset of the primary crack. Regarding the threshold angle between the primary and
secondary cracks, analytic criteria have been suggested by de Borst and Nauta (1985). Although such remedies of additional cracks remarkably improved the accuracy of fixed crack model, there still remain difficulties in defining the threshold angles, since the overall prediction is
significantly affected by the artificially introduced angles.
Second, contrary to fixed crack model, the idea of rotating crack has played an important role in enhancing accuracy of analysis of degradation in structures made of quasi-brittle materials (Cope et al.1980; Rots 1988; Jirásek and Zimmermann 1998). Since the rotated crack direction always coincides with that of principal strain (leaving only normal terms), it becomes more efficient to describe the nonlinearity in context of anisotropic material.
At the same time, many researchers actively detected and solved pathological attributes of rotating crack model–e.g., spurious stress transfer over large crack opening and mesh-induced directional bias. Among such strategies, a representative one is so-called “nonlocal formulation” (well summarized by Bažant and Jirásek 2002). With the aid of such elegant improvements, modified rotating crack model had been proved successful in studying fracture mechanism of quasi-brittle materials. In terms of stress invariant as the major ingredient of the criteria, rotating crack model holds considerable analogy (in some sense competing) with the classical plasticity model (Crisfield 1997). In particular, Weihe et al. (1998) showed that as ductility of material increases, the superiority of rotating crack model over fixed crack model becomes greater. When RC structures exhibit moderate ductility, mainly resulting from the reinforcing steel, rotating crack model is believed to provide better capability for failure prediction of RC structures than fixed crack model.
rotating crack model is rooted in the artificial concept of “coaxiality,” which precludes the method from incorporating further physical mechanisms to deal with complicated nonlinear behavior of real-world structures.
2.1.3 Particle-Lattice Models
The last category of the representative microscopic analysis methodologies is so-called particle and lattice models, which are considered to be the most physics-rooted approach. In the method, all the nonlinear behavior of material is fundamentally regarded as the interaction among the particle constituents. For two-dimensional (2D) domain, some made attempts to describe the macroscopic nonlinear behavior mainly by means of contact between particles or inter-particle structures such as truss and frames at microscopic level. Since early attempts (Kawai 1980; Cundall and Strack 1979), there has been persistent improvement. For instance, in the work of van Mieret al.(2002), the 2D lattice beam model is utilized to study phenomena related to uniaxial tensile fracture, and the disorder of material is realized by probabilistic scattering of strength and stiffness with Weibull/Gaussian distribution. For 3d domain, Cusatis et al. (2003a, b) remarkably sophisticated the previous lattice models (Jirásek and Bažant 1995a,b; van Mier et al. 2002) by incorporating lateral confinement dependence, shear behavior with friction and cohesion effect, and lattice struts which transmit both axial force and shear force. Also, 3d lattice beam model has been developed for investigating fracture mechanism in relatively larger scale (Man and van Mier 2008).
Due to their novelty and abundance of physical counterparts, the particle and lattice
approaches are regarded to be promising methods with broad spectrum, covering tensile fracture, localization, fragmentation, etc. And they also appear to be efficient tools for elucidating
relationship between micro- and macrocharacteristics of quasi-brittle heterogeneous materials. Recently, such an action of bridging different scales gradually forms mainstream by virtue of multiscale analysis techniques (e.g., Miehe et al. 2010).
The limitations of this physics-rooted approach, however, pose a significant challenge. Generally, it calls for the essential prerequisite for the main analysis–the expensive probabilistic modeling with particles (or nodes), which makes the approach restricted to small laboratory scale specimens. Also, there might be some ambiguity in the cardinal mechanisms behind the
2.2 Outline of Physics-Based Degrading Material Model
On the basis of the review addressed so far, the goal of present work is to integrate the key advantages of the various microscopic analysis methodologies in such a way that physical attributes are uncompromised and melted well into the formulation in as much detail as possible. First, in hopes of exploiting its universality and practical applicability, continuum approach is adopted as the main framework, which would serve as a powerful platform for detailed modeling of arbitrary three-dimensional structures made of quasi-brittle material and intricate reinforcing materials.
Next, in order to fully retain the physical nature of crack, “fixed-type” multidirectional smeared crack model, which can allow three orthogonal crack surfaces, is being exploited with the least need of introducing ambiguous parameters. Aforementioned shortcoming of the fixed crack model, i.e., spurious large stress transfer under nonproportional loading, has been overcome by 3d interlocking model proposed herein. Providing accurately degraded shear stiffness, the 3d interlocking model is following the central notion of tribology. Whereas the traditional particle and lattice models mainly deals with the particle-particle interaction by use of a sort of link or contact, the present interlocking model is focusing on the particle-matrix interaction in the light of the actual crack surfaces. It is noteworthy, however, that some effort has been made to retain the key advantage of the particle and lattice model: consideration of the realistic microstructure of the heterogeneous material. It is included in the present work in a way that the ideal particles, ranging actual aggregates sizes, are probabilistically generated from the Gaussian distribution and then randomly scattered, notably over entire domain.
In the fixed-type smeared crack context, the microscopic stress function is responsible for updating normal stress on the crack surfaces, whereas shear stress on the crack surfaces is separately generated from the 3d interlocking model. This independent microscopic stresses update gave rise to the hybrid domain concept–homogeneous domain for normal stress and heterogeneous domain with random particles for shear stress on the crack surfaces. Whereby, there exists weak correlation between normal and shear microscopic stresses update, which would be inconsistent with realistic material behavior. To fill the gap between those stress components on the crack surfaces, mainly by a physically reasonable manner, we suggested the consumed energy-based damage model, which we are concerned with in section 2.4.
2.3 Revisit to “Fixed-Type” Multidirectional Smeared Crack Model
The multidirectional and orthogonal smeared crack model adopted herein is based on the total strain rather than the decomposed strain which is common in plasticity theory. Since the
multidirectional crack model constantly retains the nature of actual crack throughout the analysis, the anisotropy of the quasi-brittle material is readily taken into account. For comparable
approaches one is referred to various works in literature, e.g., Vecchio and Collins (1986), and Selby and Vecchio (1993, 1997); the clear contrast to their works lies in the scale of the present orthogonal crack, which is assumed to be far smaller than that used in practical smeared crack models. Indeed, it is by “averaged” crack normally accompanied by coarse mesh that they explain the overall nonlinearity of reinforced structures, while present crack is designed to correspond to actually visible crack on the damaged structure. Further sophistication has been made for even invisible crack size (microcracks) by others. For instance, at highly microscopic length scale such total strain-based methods have been actively proposed and utilized by such researchers as Bažant and Gambarova (1984), Bažant et al. (1994).
2.3.1 Hybrid Domain Concept
The heart of multidirectional smeared crack model is the introduction of a number of planes of degradation, which is denoted as crack surfaces hereafter, consisting of three orthogonal surfaces. It is on the crack surfaces that the update of current normal and shear stresses is carried out. In the present study, a hybrid domain concept (illustrated in figure 2.4) is employed for separate
evaluation of normal and shear stresses on the crack surfaces, which can be understood as a balanced approach between fully heterogeneous domain concept in lattice-particle models and homogenized domain concept in standard continuum models.
On one hand, for the normal stress on the crack surfaces which is essentially tied to the normal strain on the crack surface, we regard the domain as homogeneous, and any point within the domain is assumed to share the identical material properties involving decisive parameters for Mode-I tensile cracking and nonlinear compressive behavior. By this homogeneity assumption, normal stress update from the unified microscopic stress function in accordance with current normal strain on the crack surfaces becomes straightforward. Details as to the microscopic stress function proposed shall be given in section 2.3.3.
On the other hand, for the shear stress on the crack surfaces, the domain is treated as
smeared crack framework where the no rotation of opened Mode-I crack is allowed, the 3d interlocking mechanism would be primarily responsible for updating current shear stress on the crack surfaces. As will be dealt with in detail, such preserved information as to Mode-I crack opening plays an essential role in introducing tribology-inspired 3d interlocking mechanism.
Figure 2.4.Hybrid domain concept for microscopic stress evaluation on the crack surfaces: (Right top) Homogeneous domain for normal stresses and (Right bottom) heterogeneous domain
impregnated with random particles for 3d interlocking to update shear stresses (Left: real-scale RC structure damaged by cyclic loading, from Palermo and Vecchio 2002).
2.3.2 Strains on the Crack Surfaces and Criterion for Mode-I Cracking
At every loading step, the total strain is transformed into its counterpart on crack surfaces, 𝛆cr as
𝛆cr=𝐏𝐓𝛆, (2.2)
𝛆cr≡ �𝛆ncr
𝛄scr� with 𝛆n cr≡ �𝜀1
cr
𝜀2cr
𝜀3cr
� and 𝛄scr≡ �
𝛾1cr
𝛾2cr
𝛾3cr
�, (2.3)
with 𝛆=current total strain tensor, 𝐓=transformation matrix from eigen analysis of 𝛆, and𝐏is for Poisson effect for which full description shall be given in section 2.5. Unlike strength-based formulation, the present total strain-based smeared crack model detects the onset of Mode-I tensile crack on the basis of current principal strain. Once the maximum principal strain exceeds the given strain threshold 𝜀th, we assume that physical Mode-I crack initiates, and thereafter 𝐓is fixed:
max (eig(𝛆(𝜏)) > 𝜀th → 𝐓(𝑡) =𝐓(𝜏) for ∀𝑡 ≥ 𝜏. (2.4)
In a similar fashion, possibly two more Mode-I cracks can take place
Normal stress update on crack surfaces: 𝜎icr=𝑔(𝛆), i∈{1, 2, 3} Homogeneous
domain:
Shear stress update from interlocking: 𝜏icr=ℐ(𝛆)
𝜀icr(𝑡) > 𝜀th for ∀𝑡 ≥ 𝜏, i∈{1,2} (2.5)
with 𝜀1cr<𝜀2cr<𝜀3cr, 𝜀kcr ∈diag(𝛆cr).
2.3.3 Stress Update on the Crack Surfaces
Local stress 𝛔crdefined on the crack surfaces is divided into normal stress 𝛔ncrand shear stress𝛕scrfor which distinct microscopic stress update procedures are suggested:
𝛔cr≡ �𝛔ncr
𝛕scr� ,
𝛔ncr≡ �
𝜎1cr
𝜎2cr
𝜎3cr
�=�𝑔(𝜀1
cr,𝑑,𝑑 𝑖𝑐)
𝑔(𝜀2cr,𝑑,𝑑𝑖𝑐)
𝑔(𝜀3cr,𝑑,𝑑𝑖𝑐)
� ,
𝛕scr≡ �
𝜏1cr
𝜏2cr
𝜏3cr
�=�ℐ(𝛆
cr,𝑑,𝑑 𝑖𝑐)
ℐ(𝛆cr,𝑑,𝑑 𝑖𝑐)
ℐ(𝛆cr,𝑑,𝑑 𝑖𝑐)
�,
(2.6)
where 𝑔is a microscopic normal stress update function; d is the consumed energy-based damage variable; 𝑑𝑖𝑐 is an internal variable accounting for initial lateral confinement.
It is noteworthy that each normal stress is exclusively related to the associated normal strain on the crack surface. Hence, the orthotropic nature of the cracked material in three dimension is readily taken into account. We shall provide detailed formulation for damage factor d in the later chapter, as well as the degree of lateral confinement 𝑑𝑖𝑐. ℐ represents the microscopic shear stress update function by the 3d interlocking mechanism proposed herein to account for nonlinear shear stress on the crack surface.
formulation of multidirectional smeared crack model can be characterized by one-directional normal-shear coupling, i.e., only the influence of normal strain on shear stress is weakly active. It is of importance to note, however, that in the present formulation, all terms of crack stresses are implicitly correlated each other through the consumed energy-based damage variable d, since all the crack strain terms are coherently used for estimating current consumed energy of the damaged material at each time step.
Rather than proposing a completely new model for describing microscopic
tensile/compressive behavior, which would naturally necessitate laborious, systematic validations against a multitude of experiments, we tried to integrate the advantageous attributes of the previous accomplishments, departing from well-established tension/compression models for quasi-brittle materials.
We acknowledge that the existing tension/compression models are less likely to hold general applicability due to essentially different boundary condition, loading condition, and most
important, possible inclusion of composite materials. Indeed, the “plane of degradation,” denoted as crack surface herein, is a sort of reduced space on which more simplicity holds compared to the original higher space, e.g., three 2D planes substitute the original 3d space in the present work. On the plane of degradation, it is assumed that uniaxial stress condition is locally met, and that normal stress on the crack surfaces can be obtained from the microscopic stress function, which had proven reliable from a multitude of experiments subject to uniaxial loading. Such simple and efficient normal stress update procedures at a reduced space, in particular for dealing with
extreme cyclic loading, are the key advantage of most of the smeared crack models. Contrariwise, elasto-plasticity approach inevitably calls for highly complicated mathematical procedure to take into account cyclic loading conditions such as multiple yielding functions; comparable works for soil can be found in Hicher et al.(2008) and for ductile material in Steglich et al.(2005).
2.3.3.1 Microscopic Tension Model
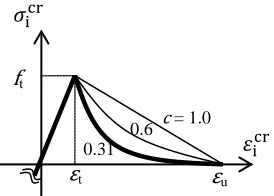
Amongst many tensile models, we adopted the model by Moelands and Reinhardt (Reinhardt 1984), which incorporates both linear softening and nonlinear softening behavior in a simple manner. We can rewrite this nonlinear softening model in terms of total strain in eq. (2.7). As easily seen in figure 2.5, the parameter 𝑐= 1.0 leads to the linear softening model, and otherwise it would correspond to nonlinear softening. In the all numerical simulations herein, the nonlinear softening rule was set by 𝑐= 0.31. This value is recommended by the reference (Reinhardt 1984), indeed it performs reasonably in all the simulations presented herein.
𝜎icr=
⎩ ⎪ ⎨ ⎪ ⎧ 𝜀𝑓t
t𝜀i
cr for 0 < 𝜀
icr≤ 𝜀t
𝑓t�1− �𝜀i cr− 𝜀
t
𝜀u− 𝜀t� 𝑐
� for 𝜀t<𝜀icr≤ 𝜀u
≈0 for 𝜀icr>𝜀 u
(2.7)
where 𝜀icr is the normal strain on ith crack surface, i∈{1,2,3}; 𝑓t and𝜀t are the tensile strength
and the corresponding strain, respectively; 𝜀u is the ultimate tensile strain retaining resistance;
[image:35.612.281.418.390.488.2]𝑐 ∈[0.31, 0.1] is the softening parameter.
Figure 2.5. Nonlinear tension softening model.
It is of interest to investigate the relationship between the work done by the tensile crack opening and Mode-I fracture energy 𝐺fI. Let 𝑊t(𝜀) be the work done by the tensile opening, which can be calculated by integrating eq. (2.7) up to the present strain 𝜀, and then we can easily confirm that it tends to approach a certain maximum limit. For instance figure 2.6 shows
evolution of 𝑊t with some test values (i.e., 𝑓t= 5 MPa,𝜀t= 0.1667e-3, 𝜀u= 0.02), and when c = 0.31, 𝑊t(𝜀u)→ (0.2633 𝜀t+ 0.2366 𝜀u)𝑓t. In fact, this converged value is relatively very small compared to the total consumed energy pertaining to all possible microcracks in random
directions, which are physically tied to the lateral expansion under compression.
𝜀icr
𝜎icr
εt
ft
Figure 2.6. Work done by Mode-I cracking opening with nonlinear softening.
With the same sample values, we can further derive the relationship between the ultimate tensile strain 𝜀u and the Mode-I fracture energy, 𝐺fI (normally regarded as material constant). It is of practical importance to have this relationship between such a material-dependent property and decisive parameters used in microscopic stress update function. Adopting the notation of “crack band width” h (e.g., Bažant and Oh 1983), within which the damage is assumed to be
concentrated, we can easily obtain
𝑊t(𝜀u)− 𝑊t(𝜀t) =𝑓t�(𝜀u− 𝜀t)− (𝜀u1.31− 𝜀t)�=𝐺f I
ℎ, (2.8)
∴ 𝜀u= 0.237�𝐺f I
𝑓tℎ+ 0.237𝜀t�,
(2.9)
where 𝐺fI is Mode-I fracture energy in [ J
m2] and ℎis crack band width in [m].
Thus, from eq. (2.9), the ultimate tensile strain 𝜀uretaining resistance can be systematically defined in terms of the material constants–fracture energy and the crack band width.
0 0.005 0.01 0.015 0.02 0.025 0.03
0 0.01 0.02 0.03
ε
Wt(ε) [x106]
2.3.3.2 Microscopic Compression Model
As a base model for compressive behavior on the crack surfaces, the Thorenfeldt (1987) concrete model had been adopted among the various compressive base curves, and the expression of the model is given in eq. (2.10). This choice has been made for the reason that the model is believed to be one of the most balanced models with sufficient accuracy and efficiency for concrete, covering a wide range of strengths.
𝜎icr=−𝑓
c′∙ 𝑥 �𝑛 −1 +𝑛 𝑥𝑛∙𝑘�, (2.10) where 𝜎icr = current normal stress on ith crack surface [MPa], i∈{1,2,3},
𝑓c′ = compressive strength [MPa],
𝑥= 𝜀icr
𝜀0,
𝜀icr = normal strain on ith crack surface, i∈{1, 2, 3},
𝜀0 = strain at the compressive strength,
𝑛= 0.80 +𝑓c′�17,
𝑘=� 1 0.67 +𝑓c′
62
� for 0 >𝜀i
cr>𝜀 o , for 𝜀icr<𝜀o .
By differentiation, we can obtain initial slope as given in eq. (2.11), and it is used for all initial stiffness for all numerical simulation herein.
𝜕𝜎icr
𝜕𝜀icr� 𝜀icr=0
=−𝜀𝑓𝑐′
0�
𝑛
𝑛 −1� (2.11)
During the severe cyclic loading, concrete material undergoes complicated damage responses. Karsan and Jirsa (1969) proposed a quadratic formula of un/reloading paths in terms of
normalized compressive strain, in which the unloading takes place along a straight line connecting two points,𝜀r and 𝜀p:
𝜀p
𝜀0= 0.145�
𝜀r
𝜀0� 2
+ 0.13�𝜀𝜀r
0� for 𝜀r> 2𝜀0,
with 𝜀p= end point of unloading path on the strain axis, 𝜀r= strain from which unloading starts, 𝜀0= strain at the compressive strength.
To include reasonable behavior under high compressive strain region, Taucer et al. (1991) adopted the above model for compressive strain less than 2𝜀0 and suggested a model for the compressive strain larger than 2𝜀0 as
𝜀p
𝜀0= 0.707�
𝜀r
𝜀0−2�+ 0.834 for 𝜀r≤2𝜀0, (2.13)
Although a multitude of nonlinear un/reloading models have been proposed since then, this simplified linear path unloading model is believed to serve as a balanced model without loss of accuracy and efficiency. Figure 2.7(left) shows the adopted un/reloading model embedded into the Thorenfeldt concrete model. Reloading is assumed to take place along the unloading path until current strain reaches 𝜀r. As seen in figure 2.7(right), the compressive response exhibits drastic changes in shapes according to the varying compressive strengths. The initial stiffness becomes larger with increasing strength, and higher strength makes the curve sharper, likely causing more brittle compression failure.
Figure 2.7. Microscopic stress function based on Thorenfeldt compression model augmented by tension regime and un/reloading paths (Left); sensitivity of curve shape to strengths (Right).
Tension resistance of concrete appeared to be dependent on the previous compressive damage. Since current un/reloading model includes residual strain 𝜀p, ensuing tensile resistance is
assumed to take effect from that strain point 𝜀p. Also, excessive compressive damage previously happened leads to total loss of tensile strength, which is plausible in a physical sense. Therefore, tensile strength is assumed to disappear once compressive strain exceeds the strain at peak compressive strength (𝜀0). Early development of tensile resistance during the unloading process
-60 -40 -20 0 20
-0.01 -0.006 -0.002 0.002
σ
[MPa]ε
εr εp -80 -60 -40 -20 0 20-0.01 -0.006 -0.002
fc'=50 MPa fc'=25 MPa fc'=75 MPa
σ
[MPa]by tensile loading and total loss of tensile resistance due to excessive compressive damage are shown in figure 2.8.
Figure 2.8. Tensile resistance development depending on previous compressive damage.
𝜎icr
𝑓c′
𝜀icr
εt εu ft
εr
2.4 Damage Models
Continuum damage theories have received a great deal of attention, because they can describe “damage” of material in a physically appealing manner. Damage is characterized by a number of microscopic degradation mechanisms such as growth and coalescence of voids or development of microcracks during loading. On the variational approach and plasticity theory, a systematic formulation for damage has been derived from the thermodynamics of irreversible process and internal state variables (e.g., Simo and Ju 1987a, 1987b). Particularly for the localization
phenomena, the damage model was enhanced such that the gradient term was incorporated on the nonlocal framework by Peerlings et al.(1996), from which an extension was undertaken by de Borst (2001) in order to embrace the advantageous features of plasticity theory.
2.4.1 Review of Damage Models
To grasp the central concepts of previous damage models, a brief review of some damage theories shall be given, and then a consumed energy-based damage model being proposed herein will be addressed in what follows.
2.4.1.1 Elasticity-Based Gradient Damage Theory
The elasticity-based gradient damage theory by Peerlings et al.(1996) can be summarized by followings. The stress-strain relation is given,
𝛔=�1− 𝜔(𝜅d)�𝐃𝐞𝛆, (2.14)
where 𝛔= stress tensor, 𝐃𝐞= Hookean stiffness matrix, 𝛆 = strain tensor, 𝜔(𝜅d) = scalar-valued damage variable ranging from 0 to 1 which stand for intact and fully damaged states, respectively,
𝜅d= scalar-valued history parameter depending on a loading function 𝑓d, which takes the form as
𝑓d=𝜀̅ − 𝜅d, (2.15)
where 𝜀̅ = nonstandard equivalent strain satisfying a partial differential equation (PDE), in a form of the Helmholtz-type equation as
In above, 𝑔d is the gradient parameter which is defined as ∂𝜎 ∂(∂2𝜀p
∂𝑥2
� ) for instance in 1D case, and the local equivalent strain 𝜀̃ is derived from the strain tensor 𝛆 as 𝜀̃=𝜀̃(𝛆).
As proposed by Peerlings et al.(1996), above Helmholtz-type relation between 𝜀̅ and 𝜀̃ stems from the Taylor expansion of the local equivalent strain 𝜀̃(𝐱+𝛏) which is primarily used in nonlocal theory, i.e., weighted averaging procedure to give the nonlocal equivalent strain 𝜀̅(𝐱):
𝜀̅(𝐱) =1V� 𝛾(𝛏)𝜀̃(𝐱+𝛏)dV, with 1V� 𝛾(𝛏)dV = 1 V
V ,
(2.17)
where 𝛾(𝛏)is a weigh function and 𝛏is a position vector from the material point at 𝐱to the infinitesimal volume dV within the domain V of interest.
By the inclusion of second-order gradient term in the formulation of nonlocal independent variable, the damage process zone is effectively controlled in an elegant manner, mainly in terms of the so-called “internal length” which mathematically arises during the Taylor expansion. Furthermore, the size effect is well captured by the use of the internal length. Of course, this necessitates additional effort to determine a meaningful value for the internal length of quasi-brittle materials through “fitting” against experimental data–e.g., for RC structure by impact like loading (de Borst 2001); for glass-fiber-reinforced polypropylene by tension loading (Geers et al. 1999).
Apart from such a special treatment for the determination of internal length, however, one of the key shortcomings of this approach is that the additional PDE for 𝜀̅ in eq. (2.16) always calls for additional boundary condition, which usually resorts to a premise with little physical interpretation, although sophisticated recommendations were suggested by such researchers as Lasry and Belytschko (1988), Mühlhaus and Aifantis (1991).
2.4.1.2 Gradient Plasticity Theory
In plasticity, the strain rate is generally decomposed into two parts as
𝛆̇=𝛆̇e+𝛆̇p, (2.18)
where elastic strain rate relates to the stress rate 𝛔̇=𝐃e𝛆̇e, and the plastic strain rate normally results from a plastic potential function 𝚽 and the equivalent plastic strain rate 𝜀̇p such that
In this theory, the plastic loading function is defined by
𝑓p=𝜎�(𝛔)− 𝜅̅(∇2𝜀p). (2.19)
The consistency condition 𝑓̇p= 0 yields a Helmholtz equation for the plastic strain rate,
𝜀̇p+𝑔d
ℎ ∇2𝜀̇p=− 1 ℎ
∂𝜎�
∂𝛔:𝛔̇, (2.20)
where the hardening modulus is written by ℎ=− ∂𝜅�
∂𝜀p followed by the gradient constant 𝑔d=
−∂∇∂𝜅�2𝜀p. It should be stressed that the above equation holds only in the plastic region whereas the counterpart of elasticity-based gradient damage theory can apply to entire domain. Although there exist some practical remedies to this restriction, (e.g., de Borst and Pamin 1996), for the better alternative, de Borst (2001) suggested the gradient plastic-damage model as will be outlined in the following section.
2.4.1.3 Gradient Plastic-Damage Model
In order to integrate the attractive gradient damage model and the plasticity formalism for explanation of plastified material parts, possibly found in intact material between microcracks or voids, de Borst (2001) modified the elasticity-based gradient damage model to incorporate plastic strain as
𝛔= (1− 𝜔)𝐃e (𝛆 − 𝛆p). (2.21)
The plastic strain rate still obeys plastic potential function 𝚽 as 𝛆̇p=𝜀̇p ∂𝚽
∂𝛔 with equivalent
plastic strain rate 𝜀̇p, and the plastic loading function controls the emergence of them as
𝑓p=𝜎�(𝛔�)− 𝜅̅(𝜀p), (2.22)
where the resulting consistency relation from 𝑓̇p= 0 yields with hardening modulusℎ=− ∂𝜅�
∂𝜀p :
𝜀̇p=−1 ℎ
∂𝜎�
∂𝛔�:𝛔�̇, (2.23)
2.4.2 Consumed Energy-Based Damage Model
Starting from the valuable knowledge of previous damage models summarized so far, we propose a novel damage model which is fundamentally based on the consumed energy of the material. The estimation of the consumed energy is conducted in the reduced space defined by the crack surfaces, i.e., effectively on the present multidirectional smeared crack model framework. The damage information attained from the framework, in turn, affects other physical mechanisms such as 3d interlocking model, which are also incorporated in the multidirectional smeared crack model framework.
Notably, the consumed energy is assumed to be directly related to the disintegration process of the material, which is most likely caused by excessive compression, cyclic, or seismic loading. In this context, the energy dissipated solely by the Mode-I tensile cracking is intentionally excluded for the estimation of the consumed energy used in the new damage model. Physically, this separation of consumed energy stems not only from the fact that the energy dissipated by Mode-I cracking is always bounded by the upper limit (as numerically shown in section 2.3.3), but also from the fact that the upper limit is relatively small compared to the total cohesive energy of the material.
Figure 2.9. Progressive damage in matrix in vicinity of ideal sphere.
As illustrated in figure 2.9, the damage in matrix in vicinity of ideal sphere can accumulate with excessive loading, essentially weakening shear stress transfer across open crack surfaces. Many isotropic damage models assume that the damage factor reduces all stress terms, generally in a simple form of 𝛔= (1− 𝑑)𝐃e𝛆 with 𝐃e elastic material stiffness matrix.
Contrariwise, in the present formulation only the shear resistance, which is defined on the crack surfaces by means of the 3d interlocking mechanism, is exclusively reduced by the damage factor as illustrated by eq. (2.25).
d =0