
Dirk Gillespie
Department of Molecular Biophysics and Physiology, Rush University Medical Center, Chicago, Illinois
ABSTRACT
A model of the ryanodine receptor (RyR) calcium channel is used to study the energetics of binding selectivity of
Ca
21versus monovalent cations. RyR is a calcium-selective channel with a DDDD locus in the selectivity filter, similar to the
EEEE locus of the L-type calcium channel. While the affinity of RyR for Ca
21is in the millimolar range (as opposed to the
micromolar range of the L-type channel), the ease of single-channel measurements compared to L-type and its similar
selectivity filter make RyR an excellent candidate for studying calcium selectivity. A Poisson-Nernst-Planck/density functional
theory model of RyR is used to calculate the energetics of selectivity. Ca
21versus monovalent selectivity is driven by the
charge/space competition mechanism in which selectivity arises from a balance of electrostatics and the excluded volume of
ions in the crowded selectivity filter. While electrostatic terms dominate the selectivity, the much smaller excluded-volume term
also plays a substantial role. In the D4899N and D4938N mutations of RyR that are analyzed, substantial changes in specific
components of the chemical potential profiles are found far from the mutation site. These changes result in the significant
reduction of Ca
21selectivity found in both theory and experiments.
INTRODUCTION
Calcium-selective ion channels play an important role in
many physiological functions including in the
excitation-contraction coupling pathway that links surface membrane
excitation and calcium-dependent muscle contraction. For
example, cardiac muscle excitation-contraction coupling
involves two kinds of calcium channels: depolarization of
the transverse tubule activates the voltage-dependent L-type
calcium channel (also known as the dihydropyridine receptor)
that generates a Ca
21influx that activates nearby ryanodine
receptor (RyR) calcium channels. RyR, in turn, conducts
Ca
21out of the sarcoplasmic reticulum, a Ca
21-storage
organelle. It is this large Ca
21release that regulates muscle
contraction.
The L-type and RyR calcium channels have very different
physiological functions. The L-type channel mediates a
relatively small Ca
21flux to locally activate RyR while RyR
mediates a large Ca
21flux to globally elevate cytosolic
[Ca
21]. To accomplish these functions, the L-type and RyR
calcium channels have very different permeation and
selec-tivity properties: the L-type channel has a small conductance
(1) and micromolar Ca
21affinity (2,3) while RyR has a large
conductance and only millimolar Ca
21affinity (4). On the
other hand, both the L-type and RyR calcium channels have
negatively-charged, carboxyl-rich selectivity filters, namely
the EEEE locus of L-type (5,6) and the DDDD locus of RyR
(with additional loci of glutamates and aspartates in the
vestibules playing supporting roles) (7). Therefore, it is
plausible that both channels share a mechanism for selectivity
that is determined by the EEEE/DDDD locus. In this article, a
model of RyR is used to understand how an EEEE/DDDD
locus leads to a Ca
21-selective channel. RyR is used because
a model of permeation through it already exists (and is
expanded on here) and because it is relatively easy to perform
single-channel measurements, providing a very large data set
to work with.
Selectivity in calcium channels has been modeled most
recently with general studies by Boda and co-workers
(including the author) (8–12), specific studies of the L-type
channel by Nonner and co-workers (13,14) and Corry et al.
(15,16), and RyR by Chen et al. (17–19) and the author (20).
From these studies, two schools of thought have emerged
with regard to why calcium channels prefer to bind/conduct
Ca
21over high levels of background monovalent cations.
Corry et al. (15,16) argue that the L-type channel must be a
single-filing channel and that Ca
21is preferred because
calcium ions see a much larger electrostatic energy-well from
the four glutamates than monovalent ions (16). In their model,
the glutamates are not in physical contact with the permeating
ions. On the other hand, Nonner, Boda, the author, and
co-workers argue that calcium channels have a small (but not
single-filing) and crowded selectivity filter with the
gluta-mates in the pore lumen directly interacting with the
permeating ions. Their channel prefers Ca
21over
monova-lent cations because of the balance of electrostatic and
excluded-volume forces (i.e., two ions cannot overlap) (8–
12,14,20–22). For example, two Ca
21can balance the four
negative glutamates in half the volume of four Na
1, a
mechanism called charge/space competition (CSC).
Both schools argue that they qualitatively reproduce the
important characteristics of the L-type channel (e.g., the
anomalous mole fraction effect, AMFE, where micromolar
concentrations of Ca
21block Na
1current), but both have
Submitted July 6, 2007, and accepted for publication September 18, 2007. Address reprint requests to Dirk Gillespie, Tel.: 312-942-3089; E-mail: [email protected].
Editor: Peter C. Jordan.
channel distinguishes between monovalents, which they are
known to do (1); a priori, electrostatics alone would not seem
to be enough. Moreover, the physical forces used by a
channel to distinguish one monovalent from another must
also be present in divalent versus monovalent selectivity.
Monovalent versus monovalent selectivity is likely a point
where the two models give qualitatively different results.
On the other hand, much of the work on the CSC
mechanism has been done with equilibrium simulations that
do not compute current, but only channel occupancy (8–
12,14). When current was computed, it required data-fitting
of excess chemical potentials (see below) (13,18,19)—rather
than using a theory to compute them as is done here—which
gave reasonable values for these potentials and reproduced
the AMFE of the L-type channel (14). Much of the effort by
the CSC school has been directed at studying a wide range of
selectivity including Ca
21versus different monovalents
(9,14,21) and monovalent versus monovalent selectivity (9,12)
to show that a crowded filter prefers small, high-valence
cations. In recent work, they have also shown that reducing
both the pore radius and the protein polarization can account
for the very different Ca
21affinities observed in L-type and
RyR channels (11,12). These studies have shown
mecha-nisms that work in principle. Recent mutations of OmpF
porin have started to experimentally verify these predictions
(24–26).
To move these theories beyond ‘‘in principle’’, a model of
a real calcium channel that reproduces—and predicts—the
experimental data over a wide range of ionic conditions and
mutations is vital. Many models can account for selectivity
under a small set of conditions, but to distinguish between
them and to have confidence in any model, a large
experi-mental data set is necessary. In this article, a model that
quantitatively reproduces and predicts RyR experimental data
in over 100 different ionic solutions is used to study the
energetics of selectivity in RyR. The experimental
verifica-tion of one of these predicverifica-tions is also shown here.
Specifically, the model predicted AMFEs between Ca
21and two monovalent cations (Na
1and Cs
1): Cs
1current is
reduced by
;
60% when Ca
21is added and Na
1current is
reduced by
;
50% when Ca
21is added. These AMFEs are
native can extend 7.5 A
˚ beyond the mutation site. The results
indicate the Ca
21versus monovalent cation selectivity in
RyR is driven by the CSC mechanism.
THEORY AND METHODS
The Poisson-Nernst-Planck/density functional
theory model
The flux through the RyR pore is described by a constitutive relationship that is a generalization of the Poisson-Nernst-Planck (PNP) equations (27–30),
J
iðxÞ ¼
1
kT
D
iðxÞ
r
iðxÞ
=
m
iðxÞ
;
(1)
whereJi,Di,ri, andmi are the local flux density, diffusion coefficient,
density, and chemical potential, respectively, of ion speciesi. The valuekis the Boltzmann constant andTis the temperature. The chemical potential is decomposed into different terms (14,22,31–35),
m
iðxÞ ¼
kT
ln
r
iðxÞ
L
3izfflfflfflfflfflfflfflfflffl}|fflfflfflfflfflfflfflfflffl{
ideal gas1
z
ie
f
ðxÞ
zfflfflffl}|fflfflffl{
mean electrostatic1
m
zfflfflffl}|fflfflffl{
SCiðxÞ
screening
1
m
zfflfflffl}|fflfflffl{
HSiðxÞ
excluded volume
;
(2)
whereeis the elementary charge and where the length scale is the de Broglie wavelengthLi(36) andziis the valence of ion speciesi.
In this decomposition of the chemical potential, there are two electrostatic terms and an excluded-volume term in addition to the usual ideal gas term. The mean electrostatic potentialfis given by the average (i.e., long-time, many-particle ensemble average) ion densities via the Poisson equation,
e
0=
ð
e
ðxÞ
=
f
ðxÞÞ ¼
e
+
iz
ir
iðxÞ
;
(3)
where e0 is the permittivity of free space and e is the local dielectric
coefficient. The sum on the right-hand side includes both the densities of the permeating ions and the protein charge densities. If the chemical potential is defined with only the ideal gas and mean electrostatic terms, then Eqs. 1 and 3 reduce to the normal PNP equations of charged, point ions.
screens a charge more efficiently than a larger or lower-valence ion. (Ions with strong polarizability or stronger van der Walls attractions are expected to be even better ‘‘screeners’’, but these properties would have second-order effects compared to size and valence.) This ionic screening is due to interactions on the atomic timescale while the mean electrostatic potential is averaged over the permeation timescale of microseconds. For example, in the bath the mean electrostatic potential is zero because—averaged over microseconds—there is local charge neutrality at every location; the mean potential does not reflect that Ca21and Clform different local structures than K1and Clin the ‘‘homogeneous’’ bulk. A well-known approximation of this term (not used here) is the Debye/Hu¨ckel theory (35,37). In the DFT, this conditional concentration approach is approximated by splitting the electrostatics into the mean electrostatic and screening terms as described (22,33,34,38,39).
The last term in Eq. 2 describes the energy required to insert an uncharged ion at any location into a fluid of uncharged, hard spheres with the same density profileri(x) as the ionic fluid. In this article, ions are modeled
as charged, hard spheres and water as an uncharged, hard sphere, and therefore excluded volume is purely due to hard-sphere (HS) repulsion. The screening term also includes ion size, but is much less sensitive to changes in ion size than the excluded-volume term (see below).
Both the screening and excluded-volume terms are computed using DFT of classical fluids (not electron orbitals). DFT is currently one of the state-of-the-art theories in physics of confined fluids (e.g., see the reviews (36) and (32)). The specific DFT of charged, hard spheres used here has been tested against multiple Monte Carlo simulations to assess its accuracy (22,34,39,40).
The work shown in this article is computed with a one-dimensional approximation of Eqs. 1–3 that was described previously (13,41) where the dielectric coefficientewas constant at 78.4 throughout the system,
J
i¼
1
kT
D
ið
x
Þ
A
ð
x
Þ
r
ið
x
Þ
d
m
idx
;
(4)
ee
0A
ð
x
Þ
d
dx
A
ð
x
Þ
d
f
dx
¼
e
+
i
z
ir
ið
x
Þ
;
(5)
where the fluxJiis now a constant andA(x) is the area of the equi-chemical
potential surfaces that is estimated as previously described (13,41). The equations for the excess chemical potentials may be found in the literature (22,34). They are not reproduced here because they are long and the formulas by themselves do not provide any obvious physical insight.
Model of the pore
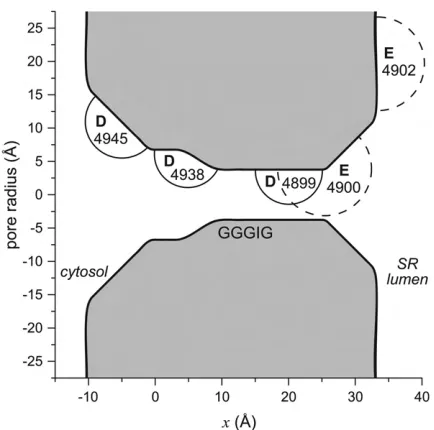
The geometry of the model RyR pore is shown in Fig. 1. Only five amino acids of the RyR protein are explicitly modeled: 4899, Glu-4900, Asp-4938, Asp-4945, and Glu-4902. In mutation experiments, these were found to be the only conserved, charged amino acids near the selectivity filter that affected permeation and/or selectivity (7,42,43).
The pore contains a 15 A˚ -long selectivity filter (10 A˚,x,25 A˚ ) flanked by two atria. Starting near the selectivity filter, the atrium on the cytosolic side (0 A˚,x,10 A˚ ) widens into a cavity 14 A˚ in diameter where Asp-4938 is located. The rest of the RyR protein on the cytosolic side is not modeled and the cavity is connected to the bath by a widening conical pore (–10 A˚,x,0 A˚ ) that contains Asp-4945. On the other side of the pore, a similar conical pore (25 A˚,x,32 A˚ ) contains Glu-4900 and connects the selectivity filter to the lumenal bath. Asp-4899, which showed the largest change in conductance and selectivity in mutation experiments, is located in the selectivity filter.
A permeant cation is given a different diffusion coefficient in each region. To illustrate, the diffusion coefficients for K1are presented here (for the
other ions, see Appendix). In the cytosolic cavity, the diffusion coefficient of K1is 61% of the bulk diffusion coefficient. This is consistent with this being
a wide part of the channel. The selectivity filter is the narrowest part of the model pore and is therefore expected to be the place where ion flux is limited; the diffusion coefficient is made smallest there (6.9131011m2/s).
In the widening lumenal atrium, it is 5.83 times larger than in the selectivity filter. For the seven permeant cations considered in this article (Li1, Na1, K1, Rb1, Cs1, Ca21, and Mg21) exactly nine data points were used to determine their diffusion coefficients in the pore, as described in the Appendix. The selectivity filter diffusion coefficients were found to be 1–4% of bulk values for the monovalent cations and 0.5% of bulk for the divalents. Comparisons of the model with experimental data are shown in the Supplementary Material. The Supplementary Material also discusses the model’s self-consistency and possible errors.
Analysis of binding selectivity
The energetics of ion binding within the pore is most easily analyzed in equilibrium when no currents from any ion species are flowing (i.e.,Ji¼0
for all ion species) and the chemical potential is constant throughout the system (in the baths and the pore):
m
bathi¼
m
poreið
x
Þ
:
(6)
In this article, the baths are identical in concentration and composition, and all the analysis of selectivity is done in equilibrium based on the decomposition of the chemical potential described above (Eq. 3).
AMFE experiments
[image:3.603.323.540.55.270.2]described methods (44). These experiments were performed on the cardiac isoform (RyR2) that still had regulatory proteins (e.g., the negatively-charged calsequestrin) attached to them. In this way, these channels are different from the ‘‘purified’’ RyR channels for which the theory was originally developed (20,42,43). This may contribute to the larger discrep-ancies between theory and experiment than those shown in Supplementary Material Figs. S1–S9. Nevertheless, the model is in very good agreement with experiment. The experiments were performed after the theoretical calculations to test the predictive power of the model. No parameters were changed in the model to better reproduce the experimental data.
RESULTS
AMFE for Ca
21and monovalent cations
Several mole fraction experiments have been performed in
RyR, both for mixtures of monovalent cations with other
monovalents and mixtures of divalents with other divalents
(45,46). In these experiments, the relative concentrations of
two ion species was changed while the total concentrations
of both species was kept constant and the conductance was
measured as a function of mole fraction. None of these
experiments showed a minimum (an AMFE) until the RyR
model of Gillespie et al. (20) predicted an AMFE for
mixtures of Na
1and Cs
1. This was experimentally verified
after the model calculations were done (Supplementary
Material Fig. S7A).
Here another AMFE prediction of the RyR model is
presented, this time in mixtures of Ca
21and Cs
1as well as
Ca
21and Na
1. Because millimolar Ca
21concentration on
the cytosolic side of RyR decreases open probability (47), it
is not possible to perform mole fraction experiments with
the theory predicted that 10
mM Ca
21added to Na
1would
not substantially change the net current (Fig. 2, the two
left
-most squares
) while 10
mM Ca
21added to Cs
1would
decrease net current by
;
20% (Fig. 2, the
two left
-
most
circles
). These results and those shown in the Supplementary
Material Fig. S9 indicate that the model can accurately
reproduce Ca
21versus monovalent cation selectivity data
over a very wide range of conditions (i.e., 0–50 mM Ca
21;
–150 to
1
150 mV applied voltage; Na
1, K
1, and Cs
1as
monovalents). Under the same conditions, the model also
predicts a significant AMFE for mixtures of K
1and Ca
21,
but only a small minimum for mixtures of Li
1and Ca
21.
These experiments have not been performed yet.
More study is planned to understand the molecular origin
of the AMFE in RyR. However, the calculations show that
the AMFE in RyR does not require the correlated motion of
multiple ions through a long, single-filing pore (48); the
model pore does not include a single-filing selectivity filter
(it is 8 A
˚ in diameter). Moreover, the model does not include
the conservation of momentum necessary to model
corre-lated ion motion; the Nernst-Planck equation used to
describe ion flux (Eq. 1) only includes conservation of
mass (49,50). In general, the physical interpretations of the
AMFE are highly model-dependent. Because classical
barrier models of ion permeation do not include the physics
known to exist in electrolytes, using these models to infer the
occupancy—or any property—of a channel is problematic
(13,17,51–53).
Dependence of Ca
21versus K
1selectivity on bath
Ca
21concentration
To study binding selectivity (i.e., the amount of an ion
species that accumulates at one location in the pore), the
equilibrium case of identical baths is considered. Then, the
partitioning of ion species
i
between the bath and location
x
in the pore can be written as
ln
r
ið
x
Þ
r
bathi¼
z
ie
kT
f
ð
x
Þ
D
m
SCið
x
Þ
kT
D
m
HSið
x
Þ
[image:4.603.64.282.59.244.2]kT
;
(7)
FIGURE 2 Experimental verification of the AMFE predicted by the theory. The lines are the theory and the symbols are the experimental data with standard error bars and the number of experiments in parentheses. The solid line and symbols are the addition of Ca21to Na1and the dashed line and open symbols are the addition of Ca21 to Cs1. In all cases, the
monovalent-chloride concentration was 100 mM in both cytosolic and lumenal baths and the indicated amount Ca21was added to the lumenal bath.
mM KCl and varying amounts of CaCl
2ranging from 1
mM to
50 mM. In Figs. 4–6, a negative term favors partitioning from
the bath into the pore while a positive term indicates that for this
component the ion is more energetically stable in the bath.
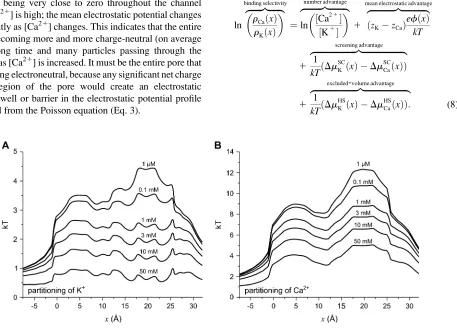
[image:5.603.92.549.371.701.2]Fig. 3 shows the partitioning coefficient plotted
logarith-mically (the left-hand side of Eq. 7) for K
1and Ca
21. For
K
1(Fig. 3
A
), the bath concentration is held constant and so
the decrease in partitioning as [Ca
21] increases is a direct
result of K
1being replaced by Ca
21everywhere within the
pore. For Ca
21(Fig. 3
B
), on the other hand, partitioning
reflects not only an increase in
r
Ca(
x
) within the pore, but
also an increase in bath [Ca
21]. Even though more and more
Ca
21enters the pore as [Ca
21] increases, the ratio of
r
Ca(
x
)
to [Ca
21]—the partitioning—decreases as more Ca
21is
added to the bath; the increase of Ca
21concentration in the
pore is proportionately smaller than the increase of Ca
21concentration in the baths.
Fig. 4 shows the mean electrostatic component
z
ie
f(
x
) in
Eq. 7. Because Ca
21has twice the charge of K
1, this
component is twice as large for Ca
21(Fig. 4
B
) as for K
1(Fig.
4
A
). For both ion species, this term makes up much more than
half of the partitioning. Also, it is important to note that
f(
x
)
changes from a deep well in the selectivity filter when [Ca
21]
is low to being very close to zero throughout the channel
when [Ca
21] is high; the mean electrostatic potential changes
significantly as [Ca
21] changes. This indicates that the entire
pore is becoming more and more charge-neutral (on average
over a long time and many particles passing through the
channel) as [Ca
21] is increased. It must be the entire pore that
is becoming electroneutral, because any significant net charge
in any region of the pore would create an electrostatic
potential well or barrier in the electrostatic potential profile
computed from the Poisson equation (Eq. 3).
the mean spherical approximation of electrolytes (21,34). Ca
(Fig. 5,
dashed lines
) has a much more negative screening term
compared to the slightly negative screening term for K
1(Fig.
5,
solid lines
); Ca
21is more efficient than K
1at screening the
protein charges in the pore. This component of the partitioning
is always negative (favoring partitioning into the pore) and
changes little as [Ca
21] increases.
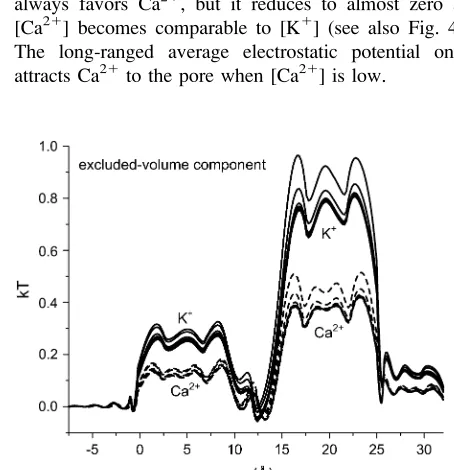
Fig. 6 shows the hard-sphere (HS) component
D
m
HS ið
x
Þ
in
Eq. 7 that describes the contribution of the ions’ excluded
volume. This excluded-volume term is positive, indicating
that it is more difficult to insert an ion-sized particle into the
selectivity filter than into the bath. The size of the ions
hinders ion partitioning into the pore from the bath. This
term is, however, small in the pore (
,
1 kT). Like the
screening term,
D
m
HSi
ð
x
Þ
changes little as [Ca
21
] increases.
While these profiles are useful for understanding the
partitioning of one ion species into the pore, by themselves
they do not show why one ion species is favored over another
because they do not directly compare two ion species. For this,
the difference in the partitioning between the two ion species
(K
1and Ca
21in this example) is necessary. Specifically, the
relative concentrations in the pore are considered:
ln
r
Cað
x
Þ
r
Kð
x
Þ
zfflfflfflfflfflffl}|fflfflfflfflfflffl{
binding selectivity¼
ln
½
Ca
21
½
K
1zfflfflfflfflfflfflfflffl}|fflfflfflfflfflfflfflffl{
number advantage1
ð
z
Kz
CaÞ
e
f
ð
x
Þ
kT
zfflfflfflfflfflfflfflfflfflfflffl}|fflfflfflfflfflfflfflfflfflfflffl{
mean electrostatic advantage1
1
kT
ð
D
m
SC
K
ð
x
Þ
D
m
SC Cað
x
ÞÞ
zfflfflfflfflfflfflfflfflfflfflfflfflfflfflfflfflfflfflfflffl}|fflfflfflfflfflfflfflfflfflfflfflfflfflfflfflfflfflfflfflffl{
screening advantage1
1
kT
ð
D
m
HS
K
ð
x
Þ
D
m
HS Cað
x
ÞÞ
:
zfflfflfflfflfflfflfflfflfflfflfflfflfflfflfflfflfflfflfflffl}|fflfflfflfflfflfflfflfflfflfflfflfflfflfflfflfflfflfflfflffl{
excluded-volume advantage(8)
FIGURE 3 The partitioning coefficient of K1(A) and Ca21(B) plotted logarithmically. [K1]
Here, the binding selectivity is defined by the ratio of the ion
concentrations in the pore and by Eqs. 2 and 7 is naturally
decomposed into four energetic advantages, energy
differ-ences that each favor the binding of one ion species over the
other. In this case, a positive term favors the binding of Ca
21while a negative term favors K
1.
It is more convenient to describe the energetics of binding
selectivity with a single number rather than an entire profile
(like in Figs. 3–6), and so only the relative concentrations of
Ca
21and K
1in Eq. 8 in the middle of the Asp-4899 region
(i.e., at
x
¼
20 A
˚ ) are considered. This location is chosen
because it is representative of the changes in general, as well
as being the location where ion concentrations are highest
and ion selectivity occurs.
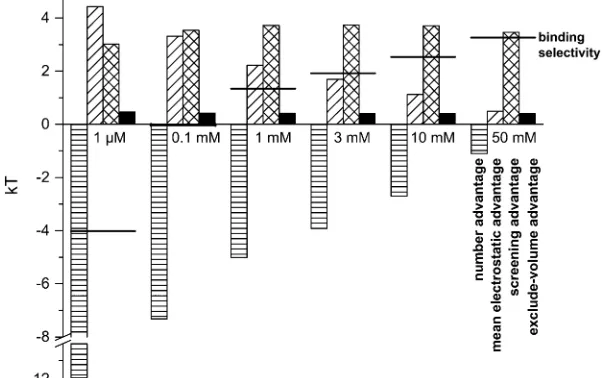
All the terms of Eq. 8 are shown in Fig. 7 for [Ca
21]
ranging from 1
mM to 50 mM. As [Ca
21] increases, the
overall binding selectivity of Ca
21increases (
solid line
).
This displacement of K
1by Ca
21is determined by how each
of the terms in Eq. 8 changes as [Ca
21] increases:
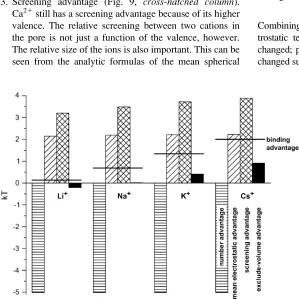
1. Number advantage (Fig. 7,
horizontal
-
hatched column
).
The only term that favors K
1binding in the pore is its
number advantage; there is more K
1in the baths than
Ca
21and therefore it is more probable that a K
1ion
enters the channel. Even this advantage is overcome
by the electrostatic and excluded-volume terms at just
0.1 mM CaCl
2in the bath.
[image:6.603.92.512.56.230.2]2. Mean electrostatic advantage (Fig. 7,
diagonal
-
hatched
column
). The mean electrostatic potential inside the pore
always favors Ca
21, but it reduces to almost zero as
[Ca
21] becomes comparable to [K
1] (see also Fig. 4).
The long-ranged average electrostatic potential only
attracts Ca
21to the pore when [Ca
21] is low.
FIGURE 4 The electrostatic component of partitioningzief(x)/kTof K 1
[image:6.603.315.542.422.657.2](A) and Ca21(B) in the pore. [K1]¼150 mM and the indicated [Ca21] is in both baths.
FIGURE 5 The screening component of partitioningmSC
i ðxÞ=kT of K 1
(solid lines) and Ca21 (dashed lines) in the pore. [K1]¼ 150 mM and
[Ca21] is changed from 1mM to 50 mM. Because the curves are so close
together, [Ca21] is not indicated.
FIGURE 6 The excluded-volume (hard-sphere) component of partition-ingDmHS
i ðxÞ=kTof K 1
[image:6.603.65.284.488.663.2]3. Screening advantage (Fig. 7,
cross
-
hatched column
).
When [Ca
21] is higher than
;
0.1 mM, then the largest
term favoring Ca
21binding in the pore is the screening
advantage of Ca
21. Fig. 5 showed that the screening term
of Ca
21in the selectivity filter was
;
–4.5 kT while for
K
1it was only
;
–1 kT; the large difference in these
terms is the 3.5 kT screening advantage for Ca
21shown
in Fig. 7. Most importantly, this screening advantage is
unchanged as [Ca
21] is increased to provide the largest
energetic preference for Ca
21over K
1(and over other
monovalent cations as described below). While the
excluded-volume advantage of Ca
21is also unchanged,
that term is much smaller (see below).
4. Excluded-volume advantage (Fig. 7,
solid column
). This
term is also unchanged as [Ca
21] is increased, but at
;
0.5 kT it is generally the smallest term favoring Ca
21binding in the pore. Because Ca
21ions are smaller than
K
1ions (diameters of 2 A
˚ versus 2.76 A˚, respectively), it
is easier to insert a Ca
21ion into the crowded pore than a
K
1ion. While the excluded-volume advantage of Ca
21is generally small, this term does have a significant effect on
Ca
21versus monovalent selectivity as described below.
Combining these results, it is clear that the origin of the Ca
21selectivity of RyR is electrostatics; the sum of the mean
electrostatic and screening advantages is enough to
over-come the large number advantage of K
1. However, the
average electrostatic attraction of the Ca
21ions from any net
charge in the selectivity filter is not solely responsible for the
selectivity. While a Ca
21ion always ‘‘feels’’ twice the
electrostatic pull that a K
1ion does because of its two
positive charges, the net charge throughout the pore is close
to zero in the pore as [Ca
21] increases above 10 mM (Fig. 7);
that is, there is little electrostatic pull on the cations (on
average) to move into the pore at high [Ca
21]. When [Ca
21]
becomes comparable to [K
1] it is only the superior ability of
the Ca
21to screen the protein charges that favors Ca
21accumulation in the pore because all other terms are small in
comparison. The number advantage is also an important
term. When [Ca
21] is
,;
3 mM Ca
21(the physiological
upper limit in the sarcoplasmic reticulum) it is larger than
any other single term. Moreover, when considering the
L-type Ca
21channel that has a Ca
21affinity of 1
mM, the
monovalent number advantage is a whopping 12 kT that
must be overcome by the other terms.
Role of monovalent size in Ca
21versus
monovalent cation selectivity
In vivo, RyR must select Ca
21ions from a background of
K
1ions, but in vitro, many different kinds of cations can be
used. An important check for any theory that reproduces the
Ca
21versus K
1selectivity is to use the same pore model to
reproduce the selectivity data of different monovalent
cations. The model of RyR described here does this. Besides
Figs. S1–S9 shown in the Supplementary Material, Fig. 2
shows that the model can predict measurable differences in
the selectivity of Ca
21versus Na
1and Ca
21versus Cs
1.
These two monovalents were chosen because they have
similar conductances through RyR, and therefore any
differences are mainly due to their size difference (Na
1and Cs
1diameters are 2 A
˚ and 3.4 A˚, respectively (54)).
[image:7.603.53.354.65.254.2]The significant changes that occur when different
mono-valent cations compete with Ca
21for the pore can be seen in
Fig. 8. In this figure, the concentration profiles of the
monovalents and Ca
21in the pore are shown for [X
1]
¼
150
mM (X
1¼
Li
1, Na
1, K
1, and Cs
1, listed from smallest to
largest) and [Ca
21]
¼
1 mM. As monovalent diameter
increases from 1.33 A
˚ for Li
1to 3.4 A
˚ for Cs
1, the
monovalent concentration throughout the pore decreases and
the Ca
21concentration increases. Within the selectivity filter
itself, there is a
.
80% decrease in monovalent concentration
(Cs
1versus Li
1) and a 40% increase in Ca
21concentration.
FIGURE 7 Components of the binding selectivity from Eq. 8 in the selectivity filter atx¼20 A˚ in Fig. 1. [K1]¼
150 mM and the indicated [Ca21] is in both baths. The horizontal-hatched bar is the number advantage, the diagonal-hatched bar is the mean electrostatic advantage, the cross-hatched bar is the screening advantage, and the solid bar is the excluded-volume advantage. The horizontal line is the binding selectivity of Eq. 8 (i.e., the sum of all the terms). A positive term favors the binding of Ca21
To understand this substantial change, Fig. 9 shows the
chemical potential decomposition of Eq. 8 for different
monovalents:
1. Number advantage (Fig. 9,
horizontal
-
hatched column
).
This term is constant since [Ca
21] and [X
1] are constant.
2. Mean electrostatic advantage (Fig. 9,
diagonal
-
hatched
column
). All of the monovalents create the same mean
electrostatic potential inside the selectivity filter and
therefore this advantage for Ca
21accumulation is constant.
3. Screening advantage (Fig. 9,
cross
-
hatched column
).
Ca
21still has a screening advantage because of its higher
valence. The relative screening between two cations in
the pore is not just a function of the valence, however.
The relative size of the ions is also important. This can be
seen from the analytic formulas of the mean spherical
approximation for homogeneous electrolytes (14,31,35).
Because of this, the screening advantage for Ca
21is
;
0.5 kT smaller when competing against Li
1and when
competing against Cs
1.
4. Excluded-volume advantage (Fig. 9,
solid column
). This
term favors the smaller ion. Since Li
1is the only
monovalent considered that is smaller than Ca
21, it is the
only one with an excluded-volume advantage (albeit a very
small one at
;
0.25 kT). Ca
21, however, has a relatively
large excluded-volume advantage over Cs
1of
;
1 kT.
Combining these results, it is the number and mean
elec-trostatic terms that remain constant as monovalent size is
changed; previously, when [Ca
21] was changed, these terms
changed substantially. Vice versa, the screening and
excluded-FIGURE 8 Concentration profiles in the pore of the monovalent cation (A) and Ca21(B). For each indicated monovalent cation X1, [X1]
¼150 mM and [Ca21]
[image:8.603.96.512.58.241.2]¼1 mM in both baths.
FIGURE 9 Components of the binding selectivity from Eq. 8 in the selectivity filter atx¼20 A˚ in Fig. 1. For each indicated monovalent cation X1, [X1]
¼150 mM and [Ca21]¼1 mM in both baths. Ion diameters: Li11.33 A˚ ;
Na12.00 A˚ ; K12.76 A˚ ; and Cs13.40 A˚ . The
[image:8.603.53.352.408.707.2]volume terms that remained approximately constant as
[Ca
21] varied now change as monovalent size is varied.
These two terms combined only change
;
1.75 kT, but this is
enough to change the relative concentrations of Ca
21and
monovalent in the selectivity filter from
;
1:1 for Ca
21versus Li
1to
.
7:1 Ca
21versus Cs
1(Fig. 8). The
excluded-volume term is the one that changes the most. Therefore, is
the most significant factor in determining the amount of
Ca
21versus monovalent selectivity, even though it is
generally
,
1 kT in magnitude.
Effects of mutations on Ca
21versus K
1selectivity
The model of RyR permeation and selectivity described here
correctly reproduces and predicts the Ca
21versus
monova-lent cation selectivity. Without adjusting any parameters, the
model also reproduces the experimentally measured decrease
in conductance and selectivity when specific charged amino
acids are mutated to neutral analogs. These include the
mutations D4899N, E4900Q, and D4938N (see
Supplemen-tary Material). In the model, these mutations are produced by
changing the charge on these amino acids to zero; no other
parameters (e.g., diffusion coefficients, pore radius) are
changed.
[image:9.603.94.514.59.441.2]Here, two of these mutations are considered in detail:
D4899N and D4938N. Each results in a significant reduction
of Ca
21versus K
1selectivity; D4899N reduces the
perme-ability ratio
P
Ca/
P
Kfrom a native wild-type (WT) value of
7.0 to 3.4 and D4839N reduces it to 3.3 (7,43). This loss of
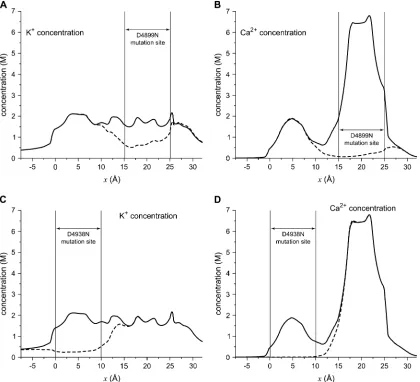
selectivity is reflected in the cation profiles shown in Fig. 10.
In both cases, there is a significant reduction in both Ca
21and K
1in the region where the mutation occurred (indicated
by the
vertical lines
) and a neighboring region. In other parts
of the pore, the profiles are virtually identical to the native
profiles. The changes are very localized, but the resulting
large changes in the current/voltage curves (see
Supplemen-tary Material) show that these localized changes in the cation
profiles have significant and important measurable effects.
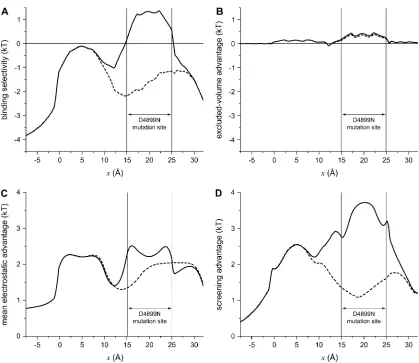
To understand the differences in binding selectivity in
these mutations compared to native RyR, the same chemical
potential decomposition of Eq. 8 can be used. In this case,
however, it is more instructive to consider the entire profile
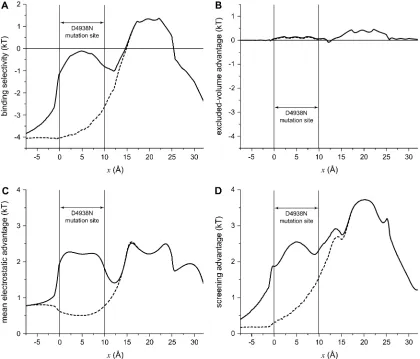
through the pore rather than just a single location. Figs. 11
and 12 show the energetics for D4899N and D4938N
(
dashed lines
), respectively, compared to native RyR (
solid
lines
). In both cases, there is a significant (
;
3 kT) loss of
Ca
21binding compared to K
1in the mutated region (Fig. 11
A
and Fig. 12
A
). In the regions neighboring the mutation
site—up to 7.5 A
˚ away—there is also significant loss of
Ca
21binding; each mutation has far-reaching effects.
Analyzing the chemical potential components again gives
insight into why this occurs:
1. Excluded-volume advantage (Fig. 11
B
and Fig. 12
B
). This
term does not change significantly in the mutant RyRs.
2. Mean electrostatic advantage (Fig. 11
C
and Fig. 12
C
).
Zeroing the charge in a region of the pore is expected to
change the mean electrostatic potential in that region, and
it does. But in the two mutations, the results are different.
In D4899N, the region where the mean electrostatic
potential differs from native profile by more than 1 kT is
small compared to D4938N (compare Fig. 11
C
and Fig.
12
C
). For D4938N, the entire mutation site as well a
neighboring region has a mean electrostatic potential
difference (compared to native) of
;
1.5 kT. In both
mutations, the change in this potential is localized to the
mutation site and
;
2.5 A
˚ on either side; in the rest of the
pore the potential is the same as in native RyR.
3. Screening advantage (Fig. 11
D
and Fig. 12
D
). The
largest change is a reduction in the screening advantage
of Ca
21in and around both mutation sites. This
change—up to 2 kT—extends up to 7.5 A
˚ away from
the mutation sites.
[image:10.603.92.511.53.416.2]Altogether, the charge-deletion mutations result in an
envi-ronment with significantly smaller mean electrostatic and
screening advantages of Ca
21over K
1; Ca
21retains some
advantage, but in each case up to 2 kT less than in native RyR.
Because electrostatic correlations range over the local
screening (Debye) length (22,34), changes in the mutation
site produce changes in the ionic concentration a distance
away. Both Ca
21and K
1concentrations are reduced and
because of the loss of up to 4 kT between these two
electrostatic advantages, the K
1concentration is now
signif-icantly higher than that of Ca
21; the ratio of K
1concentration
to Ca
21concentration is less than 1 in the mutants so the
dashed lines in Fig. 11
A
and Fig. 12
A
are
,
0.
DISCUSSION
In equilibrium, the energetics of Ca
21versus monovalent
cation binding selectivity in the pore RyR can be
decom-posed into the four terms in Eq. 8: 1), the number advantage
that describes which ion species has a larger concentration in
the baths; 2), the mean electrostatic advantage that describes
the average electrostatic well/barrier in the channel due to the
long-time average local net charge (through the Poisson
equation); 3), the screening advantage that describes the
ability of an ion to electrostatically coordinate with other
ions within a screening (Debye) length on the atomic
timescale; and 4), the excluded-volume advantage that, in
this article, describes the effect of hard-sphere ions not being
able to overlap.
Each of the four chemical potential terms plays an
important role in Ca
21versus monovalent cation selectivity,
as detailed now.
Number advantage
In calcium-selective channels, the number advantage that
monovalents generally have over divalents is the challenge
that selectivity must overcome; all other energies must
overcome the number advantage. For example, in the
physiological conditions in the sarcoplasmic reticulum
encountered by RyR, [Ca
21] is
;
1 mM while [K
1] is
[image:11.603.93.513.59.418.2];
150 mM—a number advantage equivalent to 5 kT of
simulations, however, it is impossible to verify the theory or
its assumptions. Ideally, a theory like PNP/DFT that spans all
concentration ranges should be applied. Since PNP/DFT
directly computes the average thermodynamic quantities and
does not simulate particle trajectories, bath concentrations
are just input parameters for the theory.
Electrostatics
In total, the electrostatics of the system are the major driving
force for Ca
21versus monovalent selectivity, in general
agreement with Corry et al. (15,16). However, since DFT
naturally decomposes the electrostatics into the two
physi-cally distinct mean electrostatic and screening terms (see
Theory and Methods), the PNP/DFT approach can give a
more thorough understanding of how the electrostatics
contributes to selectivity. With 150 mM K
1in the bath,
the screening advantage of Ca
21is always more than the
mean electrostatic advantage if [Ca
21] is
.
0.1 mM (Fig. 7).
Moreover, the mean electrostatic advantage disappears as
[Ca
21] is increased while the screening advantage remains
largely unchanged (Fig. 7). Therefore, it is the screening
advantage of Ca
21that is the dominant electrostatic term.
Ionic screening is a reflection of an ion’s ability to
coordinate with neighboring ions and thereby lower the
system’s energy. This coordination is a function of both the
ion’s charge and size (as well as the other ions’ charges and
sizes) and is a balance of electrostatic and excluded-volume
forces (14,31,34); it is even possible that a small monovalent
ion can screen better than a large divalent (40,56). It is not,
however, possible to explain this term just with the
mean-field Poisson equation and the excluded volume components.
The mean electrostatic potential ignores the local
inhomo-geneities of the fluid because it includes only the average
concentration of the charges; for example, it does not
‘‘know’’ whether there is a liquid or a perfect crystal. In
fluids, this local structure can be described by the DFT used
here with the screening and excluded-volume components of
the chemical potential.
As a local balance of electrostatic and excluded-volume
forces, an ion species’ screening advantage then directly
—but still important in selectivity. If electrostatics were
purely responsible for Ca
21versus monovalent selectivity,
then there would be little difference in the concentration of
Ca
21and different monovalent cations in the selectivity
filter. The calculations, however, show a large difference
(Fig. 8); there is significantly less Ca
21in the pore with the
small Li
1(1.33 A
˚ diameter) as the monovalent than with the
large Cs
1(3.4 A
˚ diameter). The chemical potential
decom-position done in the DFT (Fig. 9) demonstrates that this
difference is due to changes in both the screening (up to
;
0.5 kT) and excluded-volume terms (up to
;
1 kT). The
larger the monovalent, the more both terms favor Ca
21binding.
This trend reflects the CSC selectivity mechanism: it is the
small ions (e.g., Li
1and Ca
21) that can more efficiently
balance the protein charges than the large ions (e.g., Cs
1)
because they occupy less space in the crowded selectivity
filter. Fig. 8 shows this in terms of ion concentrations in the
pore. If Cs
1is replaced by Li
1as the monovalent, then Ca
21concentration in the selectivity filter decreases
;
30% while
monovalent concentration increases
;
500% (compare
dot-ted
and
solid lines
in Fig. 8). The small Li
1takes up only 6%
of the volume of the large Cs
1and therefore fits more easily
into the selectivity filter. Ca
21is displaced because more
monovalents are in the filter to balance the negative
Asp-4899 protein charges. The exact ratio of Ca
21to monovalent
concentration in the pore is a balance of the electrostatic and
excluded-volume forces—charge/space competition.
consistent with a more general idea of selectivity that is
emerging from the study of other ion channels. In the
potassium channel, Noskov and Roux (57) and Varma and
Rempe (58) describe how the carbonyl oxygens in that
selectivity filter form an environment that best coordinates K
1.
In the sodium channel, Boda et al. (55) show how the amino
acids of the DEKA locus arrange around the permeant ions,
with Na
1being coordinated best compared to K
1and Ca
21. In
those channels and in the calcium channels studied previously
with Monte Carlo simulations (8–12,59), the channel protein
forms a flexible environment that coordinates the ‘‘correct’’
ion better than the other ions, leading to binding selectivity.
The situation is the same for RyR with the carboxyl groups
of the DDDD locus (from Asp-4899) coordinating Ca
21best
among the permeant ions. This is quantified by the screening
and excluded-volume advantages of Ca
21. Both of these
terms indicate how well an ion ‘‘fits into’’ the crowded
environment of the selectivity filter, either by its ability to
coordinate with (screen) neighboring ions and protein
charges (the screening advantage) or by its ability to find
space among the other atoms (the excluded-volume
advan-tage). In the L-type calcium channel, Nonner and Eisenberg
found screening and excluded-volume terms of similar size
both by adding excess chemical potentials as fitting
param-eters into PNP (13) and by modeling the pore contents as a
fluid with the mean spherical approximation (14). Because
the L-type channel is more narrow than RyR (60), the
concentrations were higher in that work, resulting in slightly
more positive excluded-volume terms and more negative
screening terms. These differences reproduced the
micro-molar Ca
21affinity of the L-type channel.
The same balance of electrostatics and excluded volume
has also been noted in other proteins. For example, cation
binding in the EF-hand loops of calmodulin has been found
to be a balance of the cation’s charge and size as well as the
flexibility of the loops (61). The EF-hand motif is a common
calcium binding site motif rich in aspartates, glutamates, and
asparagines, making the amino-acid structure very similar to
calcium channel selectivity filters.
CONCLUSION
A PNP/DFT model was used to analyze the energetics of
equilibrium binding selectivity in RyR. The extension of a
previous model (20) presented here uses nine data points to
determine model parameters that were then never changed.
The model reproduces both native and mutant RyR
perme-ation and selectivity data in over 100 different ionic solutions
and predicted the presence of different sized AMFEs when
Ca
21was added to Na
1and when Ca
21was added to Cs
1. It
had previously predicted an AMFE for mixtures of Na
1and
PNP/DFT approach has advantages over other methods
including fast computing time (minutes for an entire current/
voltage curve) and arbitrarily small bath concentrations.
The model shows that Ca
21versus monovalent cation
selectivity in RyR is determined by the CSC mechanism that
balances the electrostatic attraction of the negative protein
charges (especially Asp-4899) with the excluded volume of
the ions and protein charges in the selectivity filter. This
balance in favor of Ca
21is achieved by having a selectivity
filter that contains negatively-charged carboxyl groups on
tethers so they are free to move in response to the permeant
ions currently in the filter and by thermal motion. In this
sense, the CSC mechanism is consistent with the selectivity
by the flexible coordination provided by the channel protein
seen in other channels and proteins (55,57,58,61).
APPENDIX: CONSTRUCTING THE MODEL
The model of ion permeation through the open RyR channel is a refinement of the model described in Gillespie et al. (20) that includes new mutation data (43) that was not available when the first model was created. Specifically, two charge-neutralizing mutations of aspartates in the cytosolic (cis) vestibule of the pore (D4938N and D4945N) were shown to affect RyR conductance and selectivity: the conductances in 250 mM symmetric KCl were 65% and 92% of WT for D4938N and D4945N, respectively, and permeability ratios PCa/PKwere reduced from 7.0 to 3.3 and 6.5.
Charge-neutralizing mutations (D or E to N or Q) of other charged amino acids in the cytosolic vestibule did not affect either K1conductance or Ca21versus K1
selectivity (43).
Previous experiments (7,42) showed that neutralizing the charge on two negatively-charged amino acids (Asp-4899 and Glu-4900) significantly reduced both conductance and selectivity: the conductances in 250 mM symmetric KCl were 20% and 56% of WT for D4899N and E4900Q, respectively, and permeability ratios PCa/PKwere reduced from 7.0 to 3.4
and 3.2. Except for the mutation E4902Q, charge-neutralizing mutations of other charged amino acids in the lumenal vestibule did not affect either K1 conductance or Ca21 versus K1 selectivity. While the conductance of E4902Q was found to be similar to WT, a small but statistically significant change from WT in Ca21selectivity was found (42) so E4902 was also included in this model.
Only Asp-4899 and Glu-4900 were explicitly included in the first model of RyR (20), although a region of negative charge in the cytosolic vestibule was required to reproduce the data. In hindsight, these were the then-unknown Asp-4938 and Asp-4945. In the model described here, all of the charged amino acids found in mutation experiments to affect RyR conductance and selectivity (while still producing functional and caffeine-and ryanodine-sensitive channels) were included: Asp-4899 in the selectiv-ity filter, Asp-4938 and Asp-4945 in the cytosolic vestibule, and Glu-4900 and Glu-4902 in the lumenal vestibule (Fig. 1).
two helix-turns apart. Because the structure of the RyR pore in the open state has not yet been determined at a resolution sufficient to distinguish the conformation of the inner helices, the increase in pore radius near Asp-4945 was arbitrarily chosen to be 45°. The model is not sensitive enough to distinguish between different helix-tilt angles.
Each of the aspartates and glutamates were assumed to be fully charged and facing into the permeation pathway with the terminal carboxyl (COO) group on a flexible tether that can span a hemisphere of radius 5 A˚ for aspartates and 7 A˚ for glutamates (Fig. 1). In the one-dimensional Poisson-Nernst-Planck/Density functional theory (PNP/DFT) model (13,20), resi-dues Asp-4938, Asp-4899, and Glu-4900 were modeled as two independent, half-charged oxygen ions (2.8 A˚ diameter) confined to a region of the long axis of the pore spanned by each residue’s hemisphere (8,11,12,14,20). For example, the centers of the oxygens for Asp-4899 were confined to 15 A˚
,x,25 A˚ in Fig. 1. The other residues in the model (Asp-4945 and Glu-4902) were modeled as regions of uniform fixed charge (i.e., just a background charge and not as ions that take up space) because the pore radius where they were located was too wide for the residues to exert excluded-volume effects on the permeating ions; their presence was only felt electrostatically by the permeating ions.
Many important structural inferences were made from the first model (20) that have not changed in this model (e.g., selectivity filter radius of 4 A˚ and the location of Glu-4900 at the selectivity filter/lumenal vestibule interface and that its range of tethered movement overlapped with that of Asp-4899). Other structural parameters were constrained by known structural informa-tion (e.g., distance of Asp-4938 from Asp-4899 or distance of Asp-4945 from Asp-4938) or were chosen to have a reasonable value (e.g., range of tethered movement of side chains, location of Glu-4902, or pore radius in the cytosolic vestibule). The results were insensitive to the exact choice of these latter values. Given the constraints of the previous model and known structural information and the insensitivity of the other parameters, there were no adjustable parameters with respect to the structure in this model.
There were, however, some parameters for the ions that had to be determined from the experimental data: the diffusion coefficients of the permeating ions and water are inputs to the PNP/DFT model. Because water does not contribute to the current and Cldoes not permeate the channel, these were given diffusion coefficients of 1% of bulk within the pore. Previously it was shown that the results of the model did not change even when bulk diffusion coefficients were used (20). For the cations, three different diffusion coefficients were used within the pore, one in each of the following regions: in the cytosolic vestibule where Asp-4938 was confined (0 A˚ ,x,10 A˚ ), in the selectivity filter (10 A˚,x,25 A˚ ), and in the lumenal vestibule (25 A˚ ,x,32 A˚ ). In all other regions, bulk (infinite dilution) diffusion coefficients were used. The resulting piecewise constant profile was smoothed as described (20).
For K1the three diffusion coefficients were determined by reproducing the experimental current in symmetric 250 mM KCl in native RyR (80 pA at
1100 mV) and in the mutants E4900Q (10 pA at120 mV) and D4839N (52 pA at1100 mV). The diffusion K1coefficients (from cytosolic to lumenal)
coefficients inside a highly-charged calcium channel have been performed, these values for the selectivity filter diffusion coefficients are consistent with those used in other models of RyR (17–19) and consistent with diffusion coefficients used in models of other highly-charged ion channels (13,24,26,64,65) and of other channels (66–70). Diffusion coefficients in highly-charged pores like RyR have never been simulated, so it is unclear how large they are. It is known, however, that concentrating electrolytes can significantly reduce their diffusion coefficients (71,72).
With some simplifying assumptions, one can also do a back-of-the-envelope calculation to determine the order of magnitude of the selectivity filter diffusion coefficients. Assuming that the one-dimensional Nernst-Planck equation applies and that the baths are identical, one can integrate Eq. 4 to give
g
i¼
z
2ie
2kT
Z
ð
D
iA
r
iÞ
1
dx
1;
(9)
where the conductancegi¼zieJi/V. If the flux is limited in the selectivity
filter where the diffusion coefficient and area are constant and if the cation density is also assumed constant, then
g
i¼
z
2ie
2kT
D
iA
r
iL
;
(10)
whereLis the length of the selectivity filter. If there is only one cation species as the charge carrier, then charge neutrality givesriQ/ziALwhere
Qis the number of negative protein charges in the selectivity filter. Then
g
i¼
z
ie
2kT
D
iQ
L
2:
(11)
(Note that this estimate is independent of how the chemical potential is calculated.) In RyR, K1has a conductance of 800 pS (45). This corresponds
to DK ¼ 7.33 1011 m2/s for a 15 A˚ -long selectivity filter with four
negative protein charges—very close to the 6.9131011m2/s used in the
model. Similarly, for Ca21with a conductance of 120 pS (Supplementary
Material Fig. S9A–C,open triangles),DCa¼0.5431011m2/s—which is
close to the 0.4131011m2/s used in the model. It is usually estimated that
diffusion coefficients in narrow pores are reduced by at most a factor 10 from bulk. In this case, because the ion densityriis very large (13 M for the
the results of the model. The new model also reproduces the conductances of mutations not in the previous model without any adjustable parameters; in 250 mM symmetric KCl, the model conductance is 718 pS for D4945N (experimental 737611 pS (43)) and 792 pS for E4902Q (experimental 78264 pS (42)).
Details of the modeling not described here are discussed in Gillespie et al. (20).
Supplementary Material Figs. S1–S9 show the results of the model compared to experiments in 66 ionic solutions in both native and three mutants (D4899N, E4900Q, and D4938N). These experimental data have been published previously (20,42,43) and many were compared to the previous model (20). Supplementary Material Figs. S1–S9 compare this same data to the new model because there were important improvements in many cases (see figure captions). While not all comparisons showed improvement, the entire data set is included for completeness.
The Supplementary Material also discusses the model’s self-consistency and possible errors.
SUPPLEMENTARY MATERIAL
To view all of the supplemental files associated with this
article, visit www.biophysj.org.
The author is extremely grateful to Prof. Michael Fill and his lab (especially Alma Nani) for performing the experiments on the anomalous mole fraction predictions and for performing them so quickly. Many thanks to Prof. Gerhard Meissner and his lab (especially Le Xu) for wonderful discussions and for providing the experimental data that made this model possible. Also thanks to Montserrat Samso´ for very helpful conversations on RyR structure. Useful comments on the manuscript from Wolfgang Nonner, Bob Eisenberg, Dezs}o Boda, and Michael Fill are also gratefully acknowledged.
The author was supported through National Institutes of Health grant No. 5-R01-GM076013 (Robert Eisenberg, PI).
REFERENCES
1. Hess, P., J. B. Lansman, and R. W. Tsien. 1986. Calcium channel selectivity for divalent and monovalent cations. Voltage and concen-tration dependence of single channel current in ventricular heart cells. J. Gen. Physiol.88:293–319.
2. Almers, W., E. W. McCleskey, and P. T. Palade. 1984. A non-selective cation conductance in frog muscle membrane blocked by micromolar external calcium ions.J. Physiol.(Lond.). 353:565–583.
3. Almers, W., and E. W. McCleskey. 1984. Non-selective conductance in calcium channels of frog muscle: calcium selectivity in a single-file pore.J. Physiol.(Lond.). 353:585–608.
4. Smith, J. S., R. Coronado, and G. Meissner. 1985. Sarcoplasmic reticulum contains adenine nucleotide-activated calcium channels. Nature.316:446–449.
5. Heinemann, S. H., H. Terlau, W. Stuhmer, K. Imoto, and S. Numa. 1992. Calcium channel characteristics conferred on the sodium channel by single mutations.Nature.356:441–443.
6. Yang, J., P. T. Ellinor, W. A. Sather, J.-F. Zhang, and R. Tsien. 1993. Molecular determinants of Ca21 selectivity and ion permeation in
L-type Ca21channels.Nature.366:158–161.
7. Gao, L., D. Balshaw, L. Xu, A. Tripathy, C. Xin, and G. Meissner. 2000. Evidence for a role of the lumenal M3–M4 loop in skeletal muscle Ca21 release channel (ryanodine receptor). Activity and conductance.Biophys. J.79:828–840.
9. Boda, D., D. Henderson, and D. D. Busath. 2001. Monte Carlo study of the effect of ion and channel size on the selectivity of a model calcium channel.J. Phys. Chem. B.105:11574–11577.
10. Boda, D., D. Henderson, and D. D. Busath. 2002. Monte Carlo study of the selectivity of calcium channels: improved geometry. Mol. Phys. 100:2361–2368.
11. Boda, D., M. Valisko´, B. Eisenberg, W. Nonner, D. J. Henderson, and D. Gillespie. 2006. The effect of protein dielectric coefficient on the ionic selectivity of a calcium channel.J. Chem. Phys.125:034901. 12. Boda, D., M. Valisko´, B. Eisenberg, W. Nonner, D. J. Henderson, and
D. Gillespie. 2007. Combined effect of pore radius and protein dielectric coefficient on the selectivity of a calcium channel.Phys. Rev. Lett.98:168102.
13. Nonner, W., and B. Eisenberg. 1998. Ion permeation and glutamate residues linked by Poisson-Nernst-Planck theory in L-type calcium channels.Biophys. J.75:1287–1305.
14. Nonner, W., L. Catacuzzeno, and B. Eisenberg. 2000. Binding and selectivity in L-type calcium channels: a mean spherical approxima-tion.Biophys. J.79:1976–1992.
15. Corry, B., T. W. Allen, S. Kuyucak, and S.-H. Chung. 2001. Mech-anisms of permeation and selectivity in calcium channels.Biophys. J. 80:195–214.
16. Corry, B., T. Vora, and S.-H. Chung. 2005. Electrostatic basis of valence selectivity in cationic channels.Biochim. Biophys. Acta BBA Biomembr.1711:72–86.
17. Chen, D., L. Xu, A. Tripathy, G. Meissner, and B. Eisenberg. 1997. Permeation through the calcium release channel of cardiac muscle. Biophys. J.73:1337–1354.
18. Chen, D. P., L. Xu, A. Tripathy, G. Meissner, and B. Eisenberg. 1999. Selectivity and permeation in calcium release channel of cardiac muscle. Alkali metal ions.Biophys. J.76:1346–1366.
19. Chen, D., L. Xu, B. Eisenberg, and G. Meissner. 2003. Calcium ion permeation through the calcium release channel (ryanodine receptor) of cardiac muscle.J. Phys. Chem. B.107:9139–9145.
20. Gillespie, D., L. Xu, Y. Wang, and G. Meissner. 2005. (De)construct-ing the ryanodine receptor: model(De)construct-ing ion permeation and selectivity of the calcium release channel.J. Phys. Chem. B.109:15598–15610. 21. Nonner, W., D. Gillespie, D. J. Henderson, and B. Eisenberg. 2001. Ion
accumulation in a biological calcium channel: effects of solvent and confining pressure.J. Phys. Chem. B.105:6427–6436.
22. Gillespie, D., W. Nonner, and R. S. Eisenberg. 2002. Coupling Poisson-Nernst-Planck and density functional theory to calculate ion flux.J. Phys. Condens. Matter.14:12129–12145.
23. Corry, B., M. Hoyles, T. W. Allen, M. Walker, S. Kuyucak, and S.-H. Chung. 2002. Reservoir boundaries in Brownian dynamics simulations of ion channels.Biophys. J.82:1975–1984.
24. Miedema, H., A. Meter-Arkema, J. Wierenga, J. Tang, B. Eisenberg, W. Nonner, H. Hektor, D. Gillespie, and W. Meijberg. 2004. Permeation properties of an engineered bacterial OmpF porin containing the EEEE-locus of Ca21channels.Biophys. J.87:3137–3147.
25. Vrouenraets, M., J. Wierenga, W. Meijberg, and H. Miedema. 2006. Chemical modification of the bacterial porin OmpF: gain of selectivity by volume reduction.Biophys. J.90:1202–1211.
26. Miedema, H., M. Vrouenraets, J. Wierenga, D. Gillespie, B. Eisenberg, W. Meijberg, and W. Nonner. 2006. Ca21 Selectivity of a
chemi-cally modified OmpF with reduced pore volume.Biophys. J.91:4392– 4400.
27. Marconi, U. M. B., and P. Tarazona. 1999. Dynamic density functional theory of fluids.J. Chem. Phys.110:8032–8044.

![Figure S1. (A-H) Current/voltage curves in KCl. (I) The conductance at reversal potential with cytosolic [K+] held at 250 mM and lumenal [K+] is varied](https://thumb-us.123doks.com/thumbv2/123dok_us/8109346.235919/20.612.24.515.56.507/figure-current-voltage-conductance-reversal-potential-cytosolic-lumenal.webp)
![N {[1 (5 Benzylsulfanyl) 1,3,4 oxadiazol 2 yl]ethyl} 4 chlorobenzenesulfonamide](data:image/gif;base64,R0lGODlhAQABAIAAAP///wAAACH5BAEAAAAALAAAAAABAAEAAAICRAEAOw==)