An Evaluation of Educational Process with K-Means
Clustering for Students Grouping
Muhammad Syaeful Fajar
Master of Information System
Diponegoro University
Semarang, Indonesia
Kusworo Adi
Department of Physics
Diponegoro University
Semarang, Indonesia
Catur Edi Widodo
Department of Physics
Diponegoro University
Semarang, Indonesia
ABSTRACT
K-means clustering is a method of grouping data by looking for similarities between attributes possessed by data points and can overcome high data dimensions because of the simplicity of the algorithms it has. The disadvantage of the k-means method is that the initial centroid initialization will affect the end result of clustering and is very susceptible to outliner data because it will affect computational time. This study combines the huffman tree initialization and k-means to overcome the weaknesses of data grouping in k-means. This study uses 120 students data results taken from the results of try out activities conducted at one of the vocational high schools in Semarang City. The experiment aims to classify data based on the similarity of attributes possessed by the same data. Testing is done by measuring the level of accuracy of the expected results with the results of clustering. The results of this study indicate the highest accuracy value in cluster 1 with a value of 92% with an average value of 67% accuracy in all clusters.
General Terms
Evaluation Educational Process
Keywords
Information system, clustering, huffman tree, k-Means clustering, Educational Data Mining
1.
INTRODUCTION
Various ideas for creating additional value in business and organizations are always a concern. By the development of the amount of data and information development, many business and organizations are looking for ways to extract this information to find new insights and make better decisions [1].
In the era of digitalization, the academic process of educational institutions produced a large amount of data relating to students in electronic form. It is very important for educational institutions to effectively convert large data sets into information that will help teachers, education personnel and policy makers to analyze data to improve decision making. Furthermore, it can also advance the quality of the education process by providing appropriate information to various stakeholders [2].
Data clustering is one of the techniques of large-scale data management. Data clustering separates data into separated subsets [3]. The clustering k-means algorithm is one of the most widely used clustering algorithms and has been applied in various fields of science and technology. K-means is a grouping model based on the closest distance from the centroid, then the centroid value is recalculated along with the entry of new points that cause changes in the centroid in the cluster [4].
However, the k-means clustering method is susceptible to outliner and noise data, and is vulnerable to the determination of centroid initialization for the initial cluster. Because k-means is a partitional clustering that has a tendency towards a cluster, this algorithm is very sensitive to the initial placement of clusters therefore several methods can be applied to the initial centroid initialization to suppress and efficiency of computational time [5].
Considering these problems, it is necessary to increase the k-means algorithm based on initialization optimization in the initial centroid. One method that can be used is the Huffman tree algorithm that uses main component analysis based on variants to reduce data dimensions. The main advantage of the Huffman tree algorithm is not only improving detection rates and decreasing error rates, but also solving high-dimensional problems [4].
2.
RELATED WORK
One way to improve the quality of the education process is improving the decision-making procedure in various processes by providing the administration of educational institutions with useful knowledge. This knowledge can be found from data in various organizational databases or in the form of evaluations that collect data to evaluate quality criteria related to course assessment, lecturer assessment, student assessment, etc. and can be extracted through data mining technology. Data Mining is considered as one of the most appropriate technologies in providing new knowledge about the behavior of lecturers, students, alumni, managers, and other education staffs and it acts as active automatic assistants in helping to make better decisions regarding to education activities [6].
Some methods that can be applied to the application of data management in the scope of education are clustering, prediction, correlation, model discovery and data filtering approaches. The data can be obtained along with the existence of thousands of students who have similar learning experiences but in different contexts. The data have an influence in the unexpected influence to learn contextual factors in learning and students [7].
16 K-means is the most widely used algorithm and is widely
applied in various objects to identify groups at a distance between clusters smaller than the distance between other clusters. K-means has an efficient gradient reduction approach to the total error representation of squares and makes assumptions about the similarity of density between groups, but this method is very susceptible to noise and initial centroid shielding [9].
One of them is using the main component analysis of the huffman tree method to find the initial centroid value. The results show that the performance of k-means with huffman trees is better than k-means by random sampling method for determining the initial centroid. The selection of several features to eliminate noise in the data and distance measurements at each node can improve the accuracy and speed of processing data grouping [4].
3.
RESEARCH METHODOLOGY
The research methodology used to solve the problem of grouping students is described as follows:
3.1
k-Means Algorithm
There are two approaches commonly used in data grouping, namely hierarchical clustering and partition clustering. The hierarchical grouping method will combine similar groups into the agglomerative stage or divide large groups into smaller ones at the separation stage according to the conditions required. Meanwhile, the partitioning approach will produce one data partition and it is not a clustering structure [10].
K-means classifies existing data sets into the number of N from a particular group. The beginning number of K clusters has been determined from the start. The stages of this method are divided into two parts. The first stage randomly determines the initial K centroid, one centroid for one cluster, the next step is calculating each data point with the closest distance to the centroid. Euclidean distance is generally used to determine the distance between data points and centroids. If each data point has obtained the group, the first stage process is complete. The second stage calculates a new centroid because of new data points that can cause changes in cluster centroids. After the new centroid K is determined, the same way is done in the first stage In order to produce a cycle [4]. The steps of clustering with the k-Means method are as follows [11]:
a. The number of clusters is determined by k = 5 clusters b. Determination of the center value of the initial cluster
(initialization) centroid. It randomly determines the value of the first centroid which is used as the initial cluster as much as the number k in accordance with the first step. c. Distance Measurement
Calculation of the distance between two data points (Euclidean) in a particular cluster can be used with the euclidean distance formula [12].
𝑑(𝑥𝑗, 𝑐𝑖) = 𝑁𝑗 =1(𝑥𝑗 ,𝑎− 𝑐𝑖,𝑎)2 ... (1)
caption:
𝑑(𝑥𝑗, 𝑐𝑖) = data distance to – j with the cluster center to – i
𝑁 = the amount of data,
𝑥𝑗 ,𝑎 = data on attribute to j on record to a
𝑐𝑖,𝑎 = data on the centroid value i record to a
d. Determination of the shortest distance
Determination of the shortest distance by looking at the results of euclidean calculations of data points between all clusters. Data points whish have a distance to a cluster indicate that the data includes the cluster member. e. Determination of the new cluster center
𝑛𝑒𝑤 𝑐𝑒𝑛𝑡𝑟𝑜𝑖𝑑 =
𝑐𝑖𝑐𝑘
... (2)
caption:c_i = record i for each document selected as a cluster member in stage 4
c_k = the number of cluster members formed in stage 4 f. Looping process
The looping process is a process that is carried out repeatedly until the specified limit. Repetition is done in the 3th-6th process, which is calculating the distance, determining the shortest distance and looking for a new centroid until the value of each centroid has not changed much and each cluster has a fixed member
3.2
Huffman Tree
The initialization process implements the huffman tree method to solve problems with high dimension centroids in determining the initial centroid. The Huffman tree is adopted to build an initial centroid based on similarities between objects that have the same distance. Similarity is calculated by using a dissimilarity matrix to store similarities between data objects. The k-means algorithm using huffman tree has three phases [4].
The first phase to creating a huffman tree based on a dissimilarity matrix which records the similarity of two data points, the value of the node is not the number between data points, but the average. After the tree is built, the knot of k-1 will be found from root to twig. The value of each branch is used for the initial centroid in the k-means algorithm. Then the k-means algorithm can be run with the initial centroid obtained from the huffman tree. The initialization of the nodes in the huffman tree can be defined as follows:
𝑜𝑑 𝑖, 𝑗 =
𝑎𝑑𝑖𝑗𝑘 𝑛 𝑘−1
𝑛
... (3)
caption:𝑎𝑑𝑖𝑗𝑘 = Data that is on the k cluster on
n = Amount of data
3.3
k-Means with Initialization Huffman
tree
This study is a combination of the huffman tree algorithm as centroid initialization with the k-means clustering method. The merger can be described using the algorithm below:
Algorithm:
1. Input the data set with k = 5 2. If dataset = 0 then exit 3. Else
4. Construct huffman tree as the initial cluster centres. 5. Count of the distance between the data point and the
centroid then do cluster mapping by looking at the shortest distance
6. Update cluster means; after that for each cluster calculate the object’s mean value.
The variable used as a parameter to determine the cessation of the iteration process is that there is no change in distance to the centroid
4.
DESIGN OF RESEARCH
4.1
Material and Tools
The material is uses 120 students in vocational high schools and will be grouped into 5 criteria. The data will be processed using k-means clustering with the huffman tree initialization. This study uses primary data located in the city of Semarang, Central Java, Indonesia. Data processing is web-based software using PHP and SQL programming languages as test parameters.
[image:3.595.315.544.66.584.2]4.2
Research Procedure
Fig 1: Research Procedure
The research procedure of huffman tree and k-means implementation is shown in Figure 1.
The study began by looking for information about the development of the k-means clustering method and its application from the results of previous studies. Previous research can be found in research journals sourced from journal portals listed in the journal Scopus. Literature study is used as the basis of science in the research that will be conducted. The third stage is the collection of data that will be used for the implementation of the information system that will be carried out.
4.3
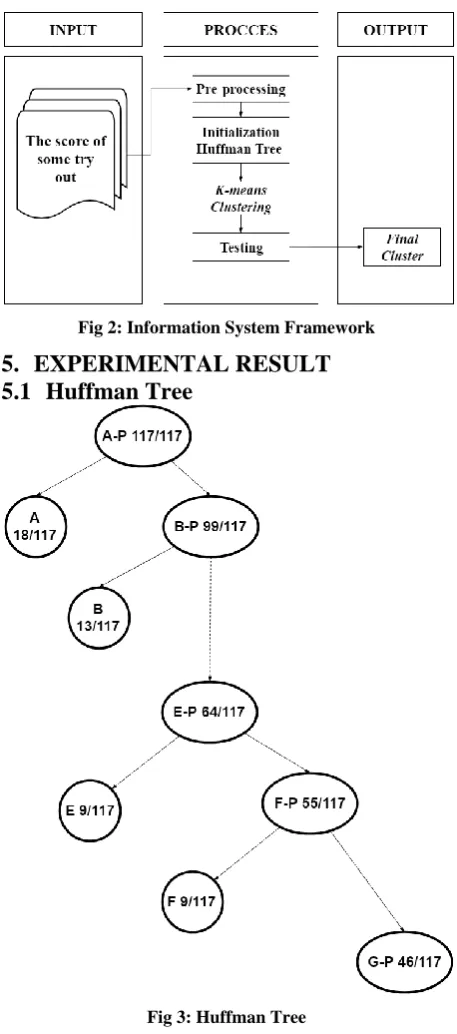
Information System Framework
The input from this research is in the form of 120 students try out in the form of numerical data, this numerical data will be processed further into the process. The process starts from the first level process in grouping by compressing data using the Huffman tree method to be used as the initial centroid for the first cluster. Then at the second level in the grouping process k-means calculation is done until the process stops at certain conditions.
Fig 2: Information System Framework
5.
EXPERIMENTAL RESULT
5.1
Huffman Tree
Fig 3: Huffman Tree
The huffman tree initialization method is a sampling method adapted from the data compression method. Basically the concept of the huffman tree method is to calculate the frequency of occurrence of the same variable. Then the tree is made from the appearance of the most variable to the least, the result of sampling is the average of the tree branches divided according to the predetermined k value of k = 5.
[image:3.595.121.209.219.490.2]18 Centroid initialization is obtained from the average of the
number of roots divided by the value of k. Initialization in the huffman tree can be defined as follows (Shunye, 2013):
𝑜𝑑 𝑖, 𝑗 = 𝑛𝑘−1𝑎𝑑𝑖𝑗𝑘
𝑛 ... (4)
caption:
𝑎𝑑𝑖𝑗𝑘 = Data in the cluster k
n = Amount of data
The advantages of initializing the huffman tree method when i tis compared to initialization using random sampling from the results of the research conducted is that the huffman tree shows stability in producing the initial centroid. In addition, this method can also overcome centroid sensitivity which is a weakness of the k-means clustering method. With the application of the huffman tree method based on the frequency of occurrence of variables, the expected result of the end of k-means clustering will produce a maximum cluster.
The application of random sampling method that is applied to traditional k-means clustering will have an impact on different centroid results when running a k-means algorithm on the same dataset. Different centroids will produce different clusters. Because in the k-means clustering method the initial centroid results will affect the end result of the clustering process.
5.2
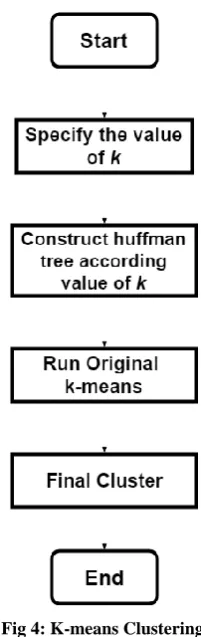
K-means Clustering
K-means clustering has the ability to classify high-dimensional numerical data because of the simplicity of the method it has. K value is the key in determining data grouping. The data points in k-means clustering are grouped based on the similarities between the attributes that exist in the data points. K-means in the first iteration will calculate euclidean distance from the data point with the centroid obtained from the huffman tree initialization. In the iteration process, it will find a new centroid along with the number of members and the distance between the data points and the new centroid that changes continuously.
[image:4.595.377.478.66.386.2]Data points can become Ci members if they have the closest euclidean distance compared to other clusters. The integrity of data points on a cluster can be changed until the iteration process stops with certain conditions. Some parameters that can be used to determine the stop of iteration in k-means clustering. In this study the parameters used are comparison of the value of the new centroid with the previous centroid value. This method is easy to be implemented to avoid continuous looping which will cause system failure.
Fig 4: K-means Clustering
5.3
Accuracy
Accuracy which can be drawn from this research is the results of grouping using k-means clustering with huffman tree initialization to classify students and to find out the academic pattern has similarity in the higest cluster 1 and cluster 5 by 92% and 90% with the average similarity with the indexing method 67%. The high similarity value caused by the cluster has the same pattern by looking at the correlation between values on an object.
Tabel 1. Accuracy of Huffman tree and K-means Clustering
Cluster C1 C2 C3 C4 C5
TRUE 12 11 21 16 18
FALSE 1 12 18 6 2
Total 13 23 39 22 20
Percentage True
92% 48% 54% 73% 90%
Percentage
False
8% 52% 46% 27% 10%
6.
CONCLUCION
the huffman tree method has the ability to simplify large dimension data so that it will make computational time more efficient. The Huffman tree has results based on the frequency of occurrence of a data point therefore it will produce a better cluster. This method can be a solution along with the rapid development of educational data in digital form.
7.
REFERENCES
[1] I. Mistrik, Software Architecture for Big Data and the Cloud. 2013.
[2] J. Han and M. Kamber, Data Mining: Concepts and Techniques, vol. 54, no. Second Edition. 2006.
[3] S. S. Yu, S. W. Chu, C. M. Wang, Y. K. Chan, and T. C. Chang, “Two improved k-means algorithms,” Applied Soft Computing Journal, 2017.
[4] W. Shunye, “An improved k-means clustering algorithm based on dissimilarity,” Proc. 2013 Int. Conf. Mechatron. Sci. Electr. Eng. Comput., vol. 133, pp. 2629–2633, 2013.
[5] M. E. Celebi, H. A. Kingravi, and P. A. Vela, “A comparative study of efficient initialization methods for the k-means clustering algorithm,” Expert Syst. Appl., vol. 40, no. 1, pp. 200–210, 2013.
[6] N. Delavari, M. R. Beikzadeh, and S. Phon-Amnuaisuk, “Application of enhanced analysis model for data
mining processes in higher educational system,” in ITHET 2005: 6th International Conference on Information Technology Based Higher Education and Training, 2005, 2005, vol. 2005.
[7] R. S. J. D. Baker, “Data mining for education,” Int. Encycl. Educ., vol. 7, pp. 112–118, 2010.
[8] D. Kabakchieva and K. Stefanova, “Data mining approach for analyzing student profiles to improve the university marketing policy,” in 17th European Concurrent Engineering Conference 2011, ECEC 2011 - 7th Future Business Technology Conference, FUBUTEC 2011, 2011, pp. 17–21.
[9] M. A. Rahman and M. Z. Islam, “A hybrid clustering technique combining a novel genetic algorithm with K-Means,” Knowledge-Based Syst., vol. 71, pp. 345–365, 2014.
[10] A. K. Jain, “Data clustering: 50 years beyond K-means,” Pattern Recognit. Lett., vol. 31, no. 8, pp. 651–666, 2010.
[11] H. Jiawei, K. Micheline, and P. Jian, DATA MINING (Concept and Techniques), vol. 3, no. 13. 2012. [12] S. J. Redmond and C. Heneghan, “A method for