Data Mining Analysis with Association Rules Method to
Determine the Result of Fish Catch using FP-Growth
Algorithm
Dito Sukma Wijaya
Faculty of Computer Science
Mercu Buana University
Devi Fitrianah
Faculty of Computer Science
Mercu Buana University
ABSTRACT
This study aims to analyze the data to determine the correlation between fish catch, whether certain fish affect the other fish. Lots of natural resources in Indonesia, especially in the marine sector that can be used one of them are fisheries. Each region has the potential of marine fish species with different numbers and species, this can lead to problems that lack of information on the correlation between fish catch, whether certain fish potentially affect the catch. To overcome this problem, it is necessary to analyze the pattern of fish catch data using data mining technique. The method used is association rules with FP Growth algorithm. The method of association rules is used to analyze the data so as to produce data in the form of correlation pattern between fish catch. Thus, based on the analysis of fish data the higher the minimum support and minimum confidence used, the less frequent itemset and rules that is formed and decreases the accuracy. All rules generated in this study have a value of lift ratio of more than 1.00 so that it can be used as a reference in knowing the correlation between fish catch to optimize the fisheries results for the fishermen.
General Terms
Data Mining, FP Growth Algorithm, Association rules, Rapid Miner.
Keywords
Data Mining, FP Growth Algorithm, Association rules, Fish Catch, Rapid Miner.
1.
INTRODUCTION
The condition of capture fishery in Indonesia is not optimal yet because of the lack of information on potential fish catch areas for fishermen which have an impact on the lack of contribution to the increase of capture fishery productivity [1]. This study aims to know the pattern of data to determine the correlation between fish catch to better optimize fishing conditions and improve productivity of capture fisheries in Indonesia by applying data mining techniques with the Association Rules method. Data Mining is a dataset observation analysis to find the interesting relationship of a large stored dataset, which is then identified to determine the relationship between the items and also to find out which items are most often obtained simultaneously with the Association Rules method [2]. After the identification process can be known the pattern of fish catch. The patterns obtained can be used as a reference in determining the most commonly obtained and interconnected catching fishing predictions, with the aim of optimizing and improving the productivity of capture fisheries with appropriate strategies. In previous research it was found that association rules method with FP Growth algorithm can be implemented in software by generating rules. In this research, the value of lift ratio of rules
produced with minimum confidence 50% is the highest lift ratio value of 2 and the lowest ratio value of 1 [3].
2.
LITERATURE REVIEW
2.1
Frequent Pattern Growth (FP-Growth)
FP Growth algorithm is a development of Apriori algorithm. The Frequent Pattern Growth Algorithm is an alternative algorithm that can be used to determine the most frequent itemset in a data set [4]. In the FP Growth algorithm using the concept of tree development, commonly called FP-Tree, in the search for frequent itemsets instead of generating candidate candidates as performed on the Apriori algorithm. By using the concept, FP Growth algorithm becomes faster than Apriori algorithm [5].The FP Growth method is divided into three main stages [6]:
1. The conditional pattern base generation stage,
2. Conditional generation phase FP-Tree, and
3. Frequent itemset search stage.
2.2
Association Rules
Association rules is a process in data mining to determine all associative rules that meet minimum requirements for support (minsup) and confidence (minconf) in a database. Both of these conditions will be used for the interesting association rules compared to the specified limits, minsup and minconf [7]. Association Rules Mining is a procedure for finding relationships between items in a dataset. Begin by searching for frequent itemset, which is the most common combination in an itemset and must satisfy minsup [7]. In this stage will be searching a combination of items that meet the minimum requirements of the support value in the database. To get the support value of an item A can be obtained with the following formula:
Support Α =𝑁𝑢𝑚𝑏𝑒𝑟 𝑜𝑓 𝑡𝑟𝑎𝑛𝑠𝑎𝑐𝑡𝑖𝑜𝑛 𝑐𝑜𝑛𝑡𝑎𝑖𝑛𝑖𝑛𝑔 𝑖𝑡𝑒𝑚 Α 𝑇𝑜𝑡𝑎𝑙 𝑡𝑟𝑎𝑛𝑠𝑎𝑐𝑡𝑖𝑜𝑛 [7]
Then, to get the support value of two items can be obtained with the following formula:
Support Α, Β = Ρ Α ∩ Β =
𝑁𝑢𝑚𝑏𝑒𝑟 𝑜𝑓 𝑡𝑟𝑎𝑛𝑠𝑎𝑐𝑡𝑖𝑜𝑛 𝑐𝑜𝑛𝑡𝑎𝑖𝑛𝑖𝑛𝑔 𝑖𝑡𝑒𝑚 Α and Β 𝑇𝑜𝑡𝑎𝑙 𝑡𝑟𝑎𝑛𝑠𝑎𝑐𝑡𝑖𝑜𝑛 [8]
After all frequent items and large itemsets are obtained, you can find the minimum confidence (minconf) condition using the following formula:
Confidence Α → Β = Ρ Α Β =
Lift Ratio =𝐵𝑒𝑛𝑐 𝑚𝑎𝑟𝑘 𝐶𝑜𝑛𝑓𝑖𝑑𝑒𝑛𝑐𝑒 Α,Β 𝐶𝑜𝑛𝑓𝑖𝑑𝑒𝑛𝑐𝑒 Α,Β [10]
To get the benchmark confidence value itself can be calculated using the following formula:
Benchmark Confidence = 𝐶𝑜𝑛𝑓𝑖𝑑𝑒𝑛𝑐𝑒 Α,Β
𝐵𝑒𝑛𝑐 𝑚𝑎𝑟𝑘 𝐶𝑜𝑛𝑓𝑖𝑑𝑒𝑛 𝑐𝑒 Α,Β [10]
Information:
Nc = number of transactions with items that become consequent.
N = number of database transactions.
2.3
Fish Catch
Capture fisheries are economic activities carried out covering the activities of catching or gathering of animals and aquatic plants that live in the sea or in public waters freely [11]. Capture fisheries development businesses require technological support, one of which is high-selectivity fishing gear technology that can be operated for deep-sea fish exploitation [12]. The dominant type of fishing gear used is gill net, shrimp net, purse seine [13]. In this research, the types of fishing gear used as attributes are: ship, motor boat, and fishing line.
2.4
Related Works Regarding to
Association Rules and Frequent Pattern
Growth (FP-Growth)
There is some writing related to FP-Growth Algorithm. Larasati et al [14] this research discusses the problem of how the Market Basket Analysis system works by using FP-Growth algorithm, system design using FP-FP-Growth algorithm, and assign frequent itemset and rules. The test results obtained are the average at minsupp = 0.006 and minconf = 0.6 does not generate rules, and the average processing time is 957 ms. Then, in 2016 Sumangkut et al [15] presents a study to determine the layout of goods at the daily mart using the FP Growth algorithm. Using FP-Growth algorithm and the help of Weka software, the result is a rule which is a collection of frequent itemset with high confidence value. If you buy mineral water then buy tissue, silverqueen, congratulations wafer, chips and briko wafer has a value of confidence of 0.94 which has the level of certainty consumers buy mineral water with tissue worth 0.94. The value of confidence is the result of
many transactions purchased simultaneously. And in 2016 Fauzy et al[10] successfully applied the method of association rules mining by using a priori algorithm on a rainfall prediction simulation system. In the test results obtained information that the higher minimum support and minimum confidence used, the less the number of frequent itemset and rules are formed and the accuracy is reduced. All the rules generated in this study have the value of lift ratio more than 1.00 so it can be used as a reference in predicting rain.
2.5
Related Works Regarding to Capture
Fisheries
There are several writings related to Capture Fishing. In 2015, Fitrianah et al [16] analyzed the potential zone of fisheries. From this research it is seen that ST.AGRID algorithm successfully applied. ST-AGRID can increase the execution time and also keep the accuracy of the clustering result. This can be seen from the value of the silhouette index approaching the positive value of 1. This study also shows that application of ST-AGRID algorithm with thresholding technique in fishery data can successfully identify potential fishery zone. Then in 2015, Andriani et al [17] showed that the application of the Decision Tree algorithm, Naive Bayes, SVM, and Neural Network in the case of predicted increase in average volume of capture fishery is quite good. The Neural Network algorithm has the highest accuracy value in making the classification in the case. But the classification results are still classified as fair classification category. In 2015 Fitrianah et al [18] conducted a potential zone study for tuna fishing using classification techniques, it was found that the last combination of features that include Chlorophyll, SST, the current Ocean and salinity gave the highest yield in classification (in Naïve Bayes reaching 69 , 03%, Decision Tree reached 82.32% and SVM achieved 68.30% accuracy) compared to "base" combination features including only Chlorophyll and SST (in Naïve Bayes reached 57.44%, Decision Tree reached 58.91% and SVM achieved 56.74% accuracy).
3.
METHODOLOGY
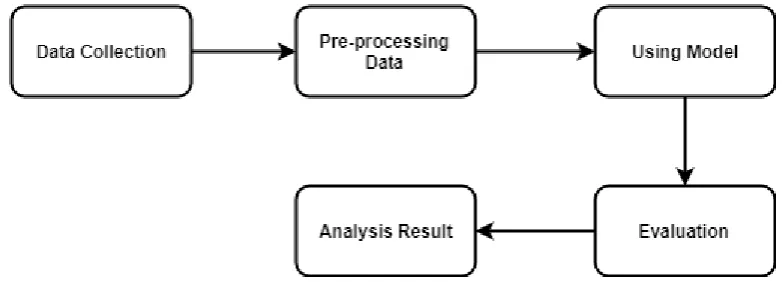
[image:2.595.101.493.536.677.2]The overall picture of the methodology is shown as in Figure 1 below. There is Data Collection, preprocessing data, testing using specified application and the last one is Analysis Result.
Fig 1: Block Diagram of Methodology
3.1
Data Collection
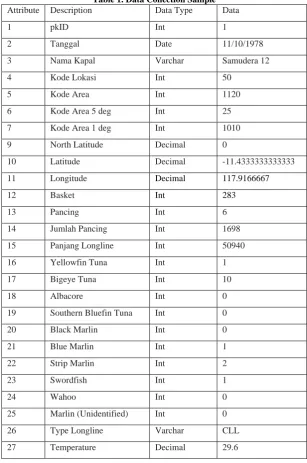
Table 1. Data Collection Sample
Attribute Description Data Type Data
1 pkID Int 1
2 Tanggal Date 11/10/1978
3 Nama Kapal Varchar Samudera 12
4 Kode Lokasi Int 50
5 Kode Area Int 1120
6 Kode Area 5 deg Int 25
7 Kode Area 1 deg Int 1010
9 North Latitude Decimal 0
10 Latitude Decimal -11.4333333333333
11 Longitude Decimal 117.9166667
12 Basket Int 283
13 Pancing Int 6
14 Jumlah Pancing Int 1698
15 Panjang Longline Int 50940
16 Yellowfin Tuna Int 1
17 Bigeye Tuna Int 10
18 Albacore Int 0
19 Southern Bluefin Tuna Int 0
20 Black Marlin Int 0
21 Blue Marlin Int 1
22 Strip Marlin Int 2
23 Swordfish Int 1
24 Wahoo Int 0
25 Marlin (Unidentified) Int 0
26 Type Longline Varchar CLL
27 Temperature Decimal 29.6
3.2
Pre-processing Data
Pre-preprocessing steps are performed to select which attributes match the scope of the study. Of all the capture
[image:3.595.144.452.601.756.2]fisheries data only use some data only. The following data will be used after preprocessing which can be seen in table 2.
Table 2. Pre-processing Data
Attribute Description Data Type Data
1 pkID Int 1
2 Tanggal Date 11/10/1978
3 Latitude Decimal -11.4333333333333
4 Longitude Decimal 117.9166667
5 Yellowfin Tuna Int 1
6 Bigeye Tuna Int 10
7 Albacore Int 0
9 Black Marlin Int 0
10 Blue Marlin Int 1
11 Strip Marlin Int 2
12 Swordfish Int 1
13 Wahoo Int 0
14 Marlin (Unidentified) Int 0
3.3
Using Model
The data that has been collected, checked and selected will be processed using RapidMiner. The explanations of all operators used in RapidMiner and the steps for the complete
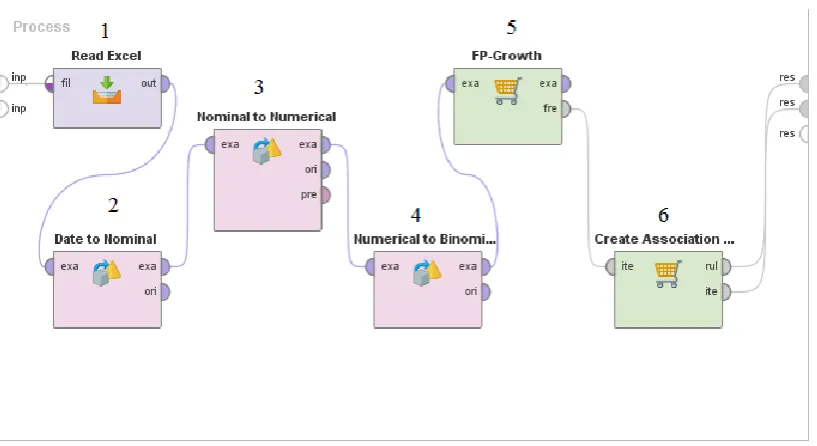
[image:4.595.96.505.245.468.2]process of producing the Association Rules are presented in the figure 2 below:
Fig 2: Operator Operator No.1: This operator reads an ExampleSet
from the specified Excel file. The user has to define which of the spreadsheets in the workbook should be used as data table.
Operator No.2: The Date to Nominal operator transforms the specified date attribute and writes a new nominal attribute in a user specified format. This conversion is done with respect to the specified date format string that is specified by the date format parameter.
Operator No.3: The Nominal to Numerical operator is used for changing the type of non-numeric attributes to a numeric type. This operator not only changes the type of selected attributes but it also maps all values of these attributes to numeric values. Binary attribute values are mapped to 0 and 1.
Operator No.4: The Numerical to Binominal operator changes the type of numeric attributes to a binominal type (also called binary). This operator not only changes the type of selected attributes but it also maps all values of these attributes to corresponding binominal values. Binominal attributes can have only two possible values i.e. 'true' or 'false'. If the value of an attribute is between the specified minimal and maximal value, it becomes 'false', otherwise 'true'. Minimal and
maximal values can be specified by the min and max parameters respectively. If the value is missing, the new value will be missing. The default boundaries are both set to 0.0, thus only 0.0 is mapped to 'false' and all other values are mapped to 'true' by default.
Operator No.5: The discovery of frequent itemsets is often viewed as the discovery of 'association rules', although the latter is a more complex characterization of data, whose discovery depends fundamentally on the discovery of frequent itemsets. Association rules are derived from the frequent itemsets. The FP-Growth operator finds the frequent itemsets and operators like the Create Association Rules operator uses these frequent itemsets for calculating the association rules. This operator calculates all frequent itemsets from an ExampleSet by building a FP-tree data structure on the transaction data base. All frequent itemsets are derived from this FP-tree. Many other frequent itemset mining algorithms also exist e.g. the Apriori algorithm. A major advantage of FP-Growth compared to Apriori is that it uses only 2 data scans and is therefore often applicable even on large data sets.
seemingly unrelated data. An example of an association rule would be "If a customer buys eggs, he is 80% likely to also purchase milk." An association rule has two parts, an antecedent (if) and a consequent (then). An antecedent is an item (or itemset) found in the data. A consequent is an item (or itemset) that is found in combination with the antecedent. Association rules are created by analyzing data for frequent if/then patterns and using the criteria support and confidence to identify the most important relationships. Support is an indication of how frequently the items appear in the database. Confidence indicates the number of times the if/then statements have been found to be true. The frequent if/then patterns are mined using the operators like the FP-Growth operator. The Create Association Rules operator takes these frequent itemsets and generates association rules.
3.4
Evaluation
In order to evaluate the research, research is doing by testing data with different support and confidence values to find the best values and rules. Here are the results of testing the data.
3.4.1
Analysis of the Influence of Minimum
Support on Frequent Itemset
Table 3. Frequent Itemset Minsupp
ItemSet
10% 20% 30% 40% 50%
1 11 11 11 11 9
2 32 31 31 31 23
3 40 37 37 38 26
4 23 20 20 22 14
5 5 4 4 5 3
Based on table 3, it can be seen that the highest number of frequent itemsets generated by the smallest minimum support in this test is 10%, while the frequent itemset is at least generated by the minimum support of 20%, 30%, 40%, and 50%. This is because the minimum value of support is the reference value in the calculation of an itemset. Only items whose support value is equal to or greater than the minimum support value are used as frequent itemset. While the minimum confidence has no effect in generating frequent itemset because there is no calculation of confidence at this stage. Then it can be concluded that the higher the minimum support used will be the less the number of frequent itemset generated.
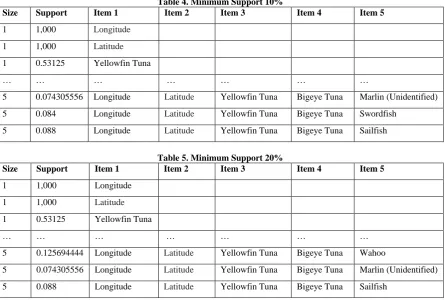
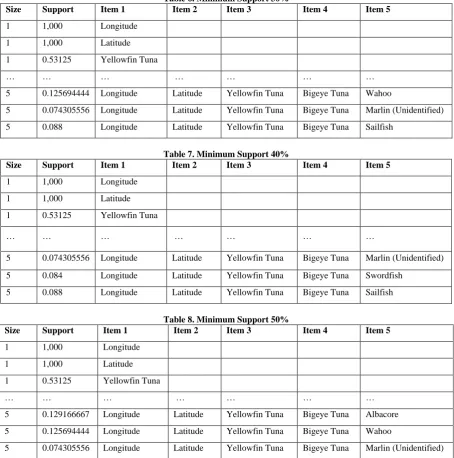
[image:5.595.320.532.79.250.2]The following list of samples of data frequent items with minimum support 10% to 50%:
Table 4. Minimum Support 10%
Size Support Item 1 Item 2 Item 3 Item 4 Item 5
1 1,000 Longitude
1 1,000 Latitude
1 0.53125 Yellowfin Tuna
… … … … … … …
5 0.074305556 Longitude Latitude Yellowfin Tuna Bigeye Tuna Marlin (Unidentified)
5 0.084 Longitude Latitude Yellowfin Tuna Bigeye Tuna Swordfish
5 0.088 Longitude Latitude Yellowfin Tuna Bigeye Tuna Sailfish
Table 5. Minimum Support 20%
Size Support Item 1 Item 2 Item 3 Item 4 Item 5
1 1,000 Longitude
1 1,000 Latitude
1 0.53125 Yellowfin Tuna
… … … … … … …
5 0.125694444 Longitude Latitude Yellowfin Tuna Bigeye Tuna Wahoo
5 0.074305556 Longitude Latitude Yellowfin Tuna Bigeye Tuna Marlin (Unidentified)
[image:5.595.77.523.432.732.2]Table 6. Minimum Support 30%
Size Support Item 1 Item 2 Item 3 Item 4 Item 5
1 1,000 Longitude
1 1,000 Latitude
1 0.53125 Yellowfin Tuna
… … … … … … …
5 0.125694444 Longitude Latitude Yellowfin Tuna Bigeye Tuna Wahoo
5 0.074305556 Longitude Latitude Yellowfin Tuna Bigeye Tuna Marlin (Unidentified)
5 0.088 Longitude Latitude Yellowfin Tuna Bigeye Tuna Sailfish
Table 7. Minimum Support 40%
Size Support Item 1 Item 2 Item 3 Item 4 Item 5
1 1,000 Longitude
1 1,000 Latitude
1 0.53125 Yellowfin Tuna
… … … … … … …
5 0.074305556 Longitude Latitude Yellowfin Tuna Bigeye Tuna Marlin (Unidentified)
5 0.084 Longitude Latitude Yellowfin Tuna Bigeye Tuna Swordfish
5 0.088 Longitude Latitude Yellowfin Tuna Bigeye Tuna Sailfish
Table 8. Minimum Support 50%
Size Support Item 1 Item 2 Item 3 Item 4 Item 5
1 1,000 Longitude
1 1,000 Latitude
1 0.53125 Yellowfin Tuna
… … … … … … …
5 0.129166667 Longitude Latitude Yellowfin Tuna Bigeye Tuna Albacore
5 0.125694444 Longitude Latitude Yellowfin Tuna Bigeye Tuna Wahoo
5 0.074305556 Longitude Latitude Yellowfin Tuna Bigeye Tuna Marlin (Unidentified)
[image:6.595.59.273.555.695.2]3.4.2
Analysis of the Influence of Minimum
Support and Minimum Confidence on Rules
Table 9. Number of Rules
Minsup
Minconf
10% 20% 30% 40% 50%
60% 413 367 367 399 269
70% 354 317 317 340 228
80% 245 217 217 240 164
Based on table 9, it can be seen that the number of associative rules that formed the most generated by minimum support
10% and minimum confidence 60% that is as much as 413 rules. At each additional minimum value of support and minimum confidence tested the rules appears to be
3.4.3
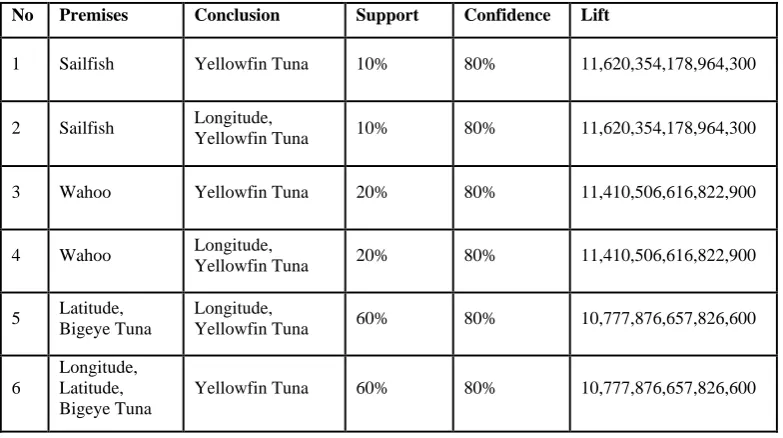
Analysis of Lift Ratio Based on Rules Result
Table 10. Lift Ratio
No Premises Conclusion Support Confidence Lift
1 Sailfish Yellowfin Tuna 10% 80% 11,620,354,178,964,300
2 Sailfish Longitude,
Yellowfin Tuna 10% 80% 11,620,354,178,964,300
3 Wahoo Yellowfin Tuna 20% 80% 11,410,506,616,822,900
4 Wahoo Longitude,
Yellowfin Tuna 20% 80% 11,410,506,616,822,900
5 Latitude, Bigeye Tuna
Longitude,
Yellowfin Tuna 60% 80% 10,777,876,657,826,600
6
Longitude, Latitude, Bigeye Tuna
Yellowfin Tuna 60% 80% 10,777,876,657,826,600
Based on Table 10, it can be seen that the lift ratio for all association rules has a value greater than 1 (lift ratio> 1). This shows that all the rules are strong and valid to be used as a reference to know the correlation of fish catch.
4.
RESULT & DISCUSSION
Fig 3: Association Rules
Based on Figure 3, it can be seen the rules generated with minimum confidence is 80% and maximum confidence is 89%. At the highlighted row it can be seen that Yellowfin Tuna has a correlation with Bigeye Tuna fish, with a confidence 80%. The position of BT means longitude and the position of LS means latitude also affects the fish catch, which means that certain locations or areas have the potential of Yellowfin Tuna and Bigeye Tuna fish.
5.
IMPLICATION
The implications of this research in the world of fishery technology it is to know the correlation pattern between fish, that Yellowfin Tuna and Bigeye Tuna have the same habitat and predators that hunt for the same food. Meanwhile, Black Marlin fish are rarely caught because the fish has a larger hunting area than other fish and the fish is a reliable swimmer.
6.
CONCLUSION
The association rules mining method using FP-Growth algorithm can be applied to fisheries data. The higher the minimum support and minimum confidence used, the less frequent itemset and rules are formed. At the highest minimum support and the highest minimum confidence of minsupp 50% and minconf 80% can be sure if getting Yellowfin Tuna is also sure to get Bigeye Tuna. Then at the minimum level of minimum support and minimum confidence
of minsupp 1% and minconf 10% appear Black Marlin fish on frequent itemset and rules.
7.
REFERENCES
[1] R. Noviyanti, “Kondisi Perikanan Tangkap Di Wilayah Pengelolaan Perikanan (WPP) Indonesia,” Univ. Terbuka, Jakarta, no. Gambar 1, 2011.
[2] D. Listriani, A. H. Setyaningrum, and F. E. M. A,
“PENERAPAN METODE ASOSIASI
MENGGUNAKAN ALGORITMA APRIORI PADA APLIKASI ANALISA POLA BELANJA KONSUMEN ( Studi Kasus Toko Buku Gramedia Bintaro ),” J. Tek. Inform., vol. 9, no. 2, pp. 120–127, 2016.
[3] C. D. dan B. D. S. Novadyana S, “IMPLEMENTASI
METODE ASSOCIATION RULE DENGAN
ALGORITMA FP GROWTH PADA DATA HASIL TANGKAPAN IKAN LAUT,” Doro J., vol. 4, no. 11, 2014.
[4] D. Samuel, “Penerapan Stuktur FP-Tree dan Algoritma FP-Growth dalam Optimasi Penentuan Frequent Itemset,” p. 6, 2008.
[5] Erwin, “Analisis Market Basket Dengan Algoritma,” J. Generic, vol. 4, pp. 26–30, 2009.
and Techniques. 2012.
[7] G. Gunadi and D. I. Sensuse, “Penerapan Metode Data Mining Market Basket Analysis Terhadap Data Penjualan Produk Buku Dengan Menggunakan Algoritma Apriori Dan Frequent Pattern Growth ( Fp-Growth ) :,” Telematika, vol. 4, no. 1, pp. 118–132, 2012.
[8] Raorane AA, Kulkarni RV, and Jitkar BD, “Association Rule – Extracting Knowledge Using Market Basket Analysis,” Res. J. Recent Sci. Feb. Res.J.Recent Sci, vol. 1, no. 2, pp. 19–27, 2012.
[9] S. Gupta and R. Mamtora, “A Survey on Association Rule Mining in Market Basket Analysis,” Int. J. Inf. Comput. Technol., vol. 4, no. 4, pp. 409–414, 2014. [10] M. Fauzy, K. R. Saleh W, and I. Asror, “Penerapan
Metode Association Rule Menggunakan Algoritma Apriori Pada Simulasi Prediksi Hujan Wilayah Kota Bandung,” J. Ilm. Teknol. Inf. Terap., vol. 13, no. 2, pp. 115–124, 2014.
[11] D. G. Bengen, “Pelatihan Pengelolaan Wilayah Pesisir Terpadu,” Pengelolaan Wil. Pesisir Terpadu, no. November, pp. 1–167, 2001.
[12] H. E. Irianto and I. Soesilo, “Dukungan Teknologi Penyediaan Produk Perikanan,” J. Chem. Inf. Model., vol. 53, pp. 1689–1699, 2013.
[13] D. I. Perairan et al., “Laporan penelitian komposisi jenis alat tangkap yang beroperasi di perairan teluk banten, serang,” no. 060, 2002.
[14] D. P. Larasati, M. Nasrun, and U. A. Ahmad, “Analisis Dan Implementasi Algoritma Fp-Growth Pada Aplikasi Smart Untuk Menentukan Market Basket Analysis Pada Usaha Retail ( Studi Kasus : Pt . X ) Analysis and Implementation of Fp-Growth Algorithm in Smart Application To Determine Market Basket Analysi,” Sist. Komput., vol. 2, no. 1, pp. 749–755, 2015.
[15] K. Sumangkut, A. Lumenta, and V. Tulenan, “Analisa Pola Belanja Swalayan Daily Mart Untuk Menentukan Tata Letak Barang Menggunakan Algoritma FP-Growth,” Tek. Inform., vol. 8, no. 1, pp. 52–56, 2016.
[16] D. Fitrianah, A. N. Hidayanto, H. Fahmi, J. L. Gaol, and A. M. Arymurthy, “ST-AGRID : A Spatio Temporal Grid Density Based Clustering and,” Int. J. Softw. Eng. Its Appl., vol. 9, no. 1, pp. 13–26, 2015.
[17] A. Andriani, “Prediksi Kenaikan Rata-Rata Volume Perikanan Tangkap Dengan Teknik Data Mining ISBN : 979-26-0280-1 ISBN : 979-26-0280-1,” pp. 117–121, 2015.
[18] D. Fitrianah, “Feature Exploration for Prediction of Potential Tuna Fishing Zones,” Int. J. Inf. Electron. Eng., vol. 5, no. 4, pp. 270–274, 2015.