Hybrid Particle Swarm Optimization and k-Means
Clustering for Education Quality Mapping
Muhammad Lintang Cahyo
Department of Information System
Diponegoro University
Semarang, Indonesia
Jatmiko Endro Suseno
Department of Physics
Diponegoro University
Semarang, Indonesia
Oky Dwi Nurhayati
Department of Informatic
Diponegoro University
Semarang, Indonesia
ABSTRACT
Quality mapping on education can be useful information to evaluate how well the quality of education is attained in each school. Solutions to overcome this problem required an information system for mapping the quality of education based on the five categories of quality achievement levels set by the government of Indonesia. This study was conducted using 200 school datasets in the city of Semarang. the study used the test parameters of input 20 particles, 40 particles, 80 particles and 160 particles. parameters were tested using PSO and PSO + k-Means methods. As a result, the use of the 20 particles parameter provides an optimal solution in grouping data at a central point.
General Terms
Education quality mapping
Keywords
Information system, clustering, particle swarm optimization, k-Means clustering
1.
INTRODUCTION
Mapping of the quality of education is a process that seeks to ensure the implementation of the quality of education. The function of quality assurance of education is aimed at the quality of schools in accordance with the criteria that have been determined by the government. Implementation of the basic standard of education in quality mapping in schools can be useful information for evaluating the quality of education achievement in each school. The solution to solve this problem requires an information system to categorize the quality of education based on the five categories of quality achievement levels established by the government in Indonesia as one of the benchmarks in evaluating school quality achievement. One scientific method capable of grouping large data into each category can use hybrid k-Means and particle swarm optimization (PSO) methods.
Clustering is one statistical analysis that aims to group data into each cluster, used in assisting data modeling [1]. Clustering in the information system application plays a role in facilitating grouping in information retrieval [2]. Clustering can be used as a tool for preprocessing on other algorithms [3].
k-Means is able to build an empirical data classification [4] and can also be applied in grouping heterogeneous data into more homogeneous sub data [5]. The k-Means algorithm can be applied to large amounts of data. The approach uses an entire set of data divided into smaller sets [6].
The k-Means algorithm is one of the best and very efficient Clustering algorithms but its performance is very sensitive to
cluster initialization with optimal results. k-Means will be able to find the right central point if the initial generation of the central point made with the random value is close to the final solution of the cluster center. If the beginning of the central point is far from the final solution of the cluster center then it is likely that the clustering result will be incorrect [7]. The solution to solve this problem is with a PSO hybrid. PSO algorithm produces optimization based on population data. The algorithm is able to find the optimal solution, or near-optimal on the problem of quantitative and qualitative data. PSO and k-Means hybrid algorithms produce better results than without hybrid [8].
The PSO + k-Means method aims to classify school education standard data into five categories: first level education standard, second level education standard, third level education standard, fourth level education standard and fifth level education standard. The application of hybrid k-Means and PSO in this research is expected to develop an effective quality education information system for management, decision making in guaranteeing and improvement of education quality.
2.
RELATED WORK
Implementation of k-Means Clustering Algorithm and PSO is able to partition a number of clusters that have been determined. The PSO algorithm is used as a search for the best initial centroid values for each cluster to be established [9]. The k-Means and PSO method approach can shorten computing time. The PSO-coupled algorithm with k-Means Algorithm shows a high degree of classification accuracy with a slight degree of classification error compared with regular k-Means [10].
The grouping of PSO and k-Means in data clustering is capable of performing rapid data groupings [11]. Basically PSO is used to improve clusters formed by k-Means [12]. As the performance of PSO is able to initialize the initial value on global search. When it is close to the optimal value, then switch to the k-Means algorithm as a clustering step. This suggests that hybrid algorithms are better at clustering data [13].
3.
RESEARCH METHODOLOGY
The research methodology used to solve the problem of educational mapping is described as follows :
3.1
k-Means Algorithm
Euclidean distance. The value of k is required as an input parameter and a partition in a set of objects 𝑛 of cluster 𝑘. The average value of the set of objects is taken as the resemblance of parameters to form clusters [14].
The k-Means algorithm classifies the object n into cluster 𝑘 by observing each of the closest middle values into the cluster. The resembling data resides in the same cluster and the unequal data resides in another cluster. Each cluster is associated with the centroid that is the center of the cluster [15]. The steps of clustering with the k-Means method are as follows [1]:
a. Determine the number of 𝑘 values to be established. The number of 𝑘 values is five clusters based on the five categories of standar education.
b. Determination of the value of the center of the early cluster (centroid). Randomly determining the value of the centroid that will be the center of the cluster as much as the number of 𝑘 according to the first stage.
c. Determine the distance between the weights on each data that is not the cluster center (centroid) with the weight of each data in each cluster center using the euclidean distances formula [16].
𝑑 𝑥𝑗,𝑐𝑖 = 𝑁
𝑗 =1 𝑥𝑗 ,𝑎− 𝑐𝑖,𝑎 2
….………(1)
caption :
𝑑
(𝑥𝑗 ,𝑐𝑖)= distance of data to the cluster center𝑁
= the amount of data𝑥
𝑗 ,𝑎= data on attribute to 𝑗 on record to 𝑎𝑐
𝑖,𝑎= data at centroid value to 𝑖 record to 𝑎 d. The shortest distance determination.After getting the distance between data with the centroid, then specify 𝑑 that has minimum value on each data to become cluster member.
𝑐𝑒𝑛𝑡𝑟𝑜𝑖𝑑 𝑣𝑎𝑙𝑢𝑒 = 𝑐𝑖
𝑐𝑘 ……….……….(2)
caption :
𝑐
𝑖= record to 𝑖 against each data selected to be a cluster member at the stage 4.𝑐
𝑘 = the number of cluster members formed in stage 4. e. Termination of iteration.f. Repeat steps 3-6 until the centroid value of each cluster member is unchanged. So get clusters that contain similar data.
3.2
Particle Swarm Optimization
PSO is a stereotypical optimization method that represents the solution of problems in the form of particles[17]. The PSO algorithm is inspired by the social behavior of animals such as a collection of birds in a population (swarm). Social behavior consists of individual actions and the influence of other individuals in a group. The particles show a bird in a flock of birds. Each individual or particle behaves by using its own intelligence and also influenced by the behavior of its collective group.
The PSO algorithm is guided by personal experience or Particle Best (Pbest), the overall experience of the swarm
process of particle position displacement is multiplied by the inertia factor 𝑤 varying in the range of 𝑤_𝑚𝑖𝑛 to 𝑤_𝑚𝑎𝑥. The initial velocity of the population
𝑣 = [𝑣
1, 𝑣
1, … , 𝑛]
𝑇, where 𝑇 is the transpose operator. So the velocity of each particle𝑋
𝑖(𝑖 = 1,2, … , 𝑁)
becomes𝑣
𝑖= [𝑣
𝑖,1, 𝑣
𝑖,1, … , 𝑣
𝑖,𝑛]
[18]. The steps in using PSO algorithm are as follows:a. Spesify parameter, 𝑤, 𝑐1,𝑐2 , 𝑖, 𝑚𝑎𝑥𝑖𝑡𝑒
Caption :
𝑤 = inertia factor value 𝑐1 = learning rate for particle
𝑐2 = learning rate for swarm
𝑖 = number of particle 𝑚𝑎𝑥𝑖𝑡𝑒 = maximum iteration
b. Initialize the random (random) position of each particle 𝑥𝑖, and the velocity of each particle 𝑣𝑖.
Caption :
𝑥𝑖 = Position of particles (position)
𝑦𝑖= Particle velocity (velocity)
𝑖 = index of particles in one population, 𝑖 ∈ 1,2, … , 𝑛
c. Determine the initial iteration 𝑘 = 1.
d. Calculates the 𝐹𝑖 particle fitness value on the initial
iteration based on the formula below and find the best index for particle 𝑏.
𝐹𝑖𝑘= 𝑓 𝑥𝑖𝑘 ……….(3)
and do a fitness value calculation on the next iteration of the entire population (swarm) to get the particle 𝑏1.
𝐹𝑖𝑘+1= 𝑓(𝑥𝑖𝑘+1) ……..………(4)
Caption:
𝑏 = the best particle index in a population
𝐹
𝑖𝑘= the value of the objective function of the particles in one population at the iteration to 𝑘𝑓 𝑥𝑖𝑘 = evaluation of objective function
e. Select
𝑃𝑏𝑒𝑠𝑡𝑖𝑘= 𝑥𝑖𝑘 and 𝐺𝑏𝑒𝑠𝑡𝑘 = 𝑥𝑏𝑘….………...…….(5)
Caption :
𝑃𝑏𝑒𝑠𝑡𝑖𝑘= personal best (local) ever achieved
particle to in one population until iteration to 𝑘
𝐺𝑏𝑒𝑠𝑡𝑘 = global best ever achieved by one population
until iteration to 𝑘
f. Calculate the value of inertia vector using the equation
𝑤 = 𝑤𝑚𝑎𝑥 − 𝑘 × (𝑤𝑚𝑎𝑥 − 𝑤𝑚𝑖𝑛)/𝑀𝑎𝑥𝑖𝑡𝑒 …....……...(6)
g. Update velocity and position values for particle in whole population (swarm) :
if 𝐹𝑖𝑘+1 then 𝑃𝑏𝑒𝑠𝑡𝑖𝑘+1= 𝑥𝑖𝑘+1
else 𝑃𝑏𝑒𝑠𝑡𝑖𝑘+1=
𝑃𝑏𝑒𝑠𝑡𝑖𝑘….………..…………(9)
i. Update Gbest population
if 𝐹𝑏1𝑘+1< 𝐹𝑏𝑘 then 𝐺𝑏𝑒𝑠𝑡𝑘+1= 𝑃𝑏𝑒𝑠𝑡𝑏1𝑘+1
and
set 𝑏 = 𝑏1 else 𝐺𝑏𝑒𝑠𝑡𝑘+1= 𝐺𝑏𝑒𝑠𝑡𝑘 …..……….(10)
i. If 𝑘 < 𝑚𝑎𝑥𝑖𝑡𝑒 then 𝑘 = 𝑘 + 1 and go back to step 6. If 𝑘 > 𝑚𝑎𝑥𝑖𝑡𝑒 then go to step 11.
j. The calculation cycle of velocity and position will continue to be repeated until iteration is complete. When iteration is over, the best particles come out as the optimum solution
𝐺𝑏𝑒𝑠𝑡
𝑘.3.3
Hybrid PSO + k-Means
Hybrid-PSO algorithm is a hybrid of k-Means and PSO methods of clustering. In this, k-Means is executed once and the results of k-Means are used to seed one of the particles in PSO clustering algorithm. Then PSO algorithm is executed. 1) Algorithm for hybrid PSO clustering
1. Select number of particle
2. Execute k-Means on the data and assign the calculated centroid to one particle
3. Initialize other particle to have randomly selected 𝑁𝑐
cluster centroid. 4. For 𝑖 in range 𝑚𝑎𝑥𝑖𝑡𝑒 :
a. For 𝑗 in range number of particles : i. For each data vector :
a) Calculated the Euclidean distance to all cluster centroid
b) Assign the data vector to the cluster such that the Euclidean distance is minimum ii. Calculate the fitness function using equation 3. b.Update local best position using equation 5.
c.Update the global best position as the position particle which minimize the fitness function.
d.Update the cluster centroid with equation 7 and 8.
4.
DESIGN OF RESEARCH
4.1
Material and Tools
The tools and materials used in this research are 200 school datasets with 8 criteria. the data is processed using PSO and K-Means methods. we use secondary data which located in semarang city, Indonesia. Data processing is done by using matlab software as the first step in doing parameter test.
4.2
Research Procedure
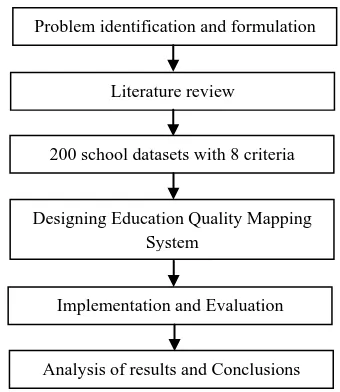
[image:3.595.342.512.82.278.2]The research procedure of PSO + k-Means implementation is shown in Figure 1.
Fig 1: Research Procedure
4.3
Physical Data Model
4.3.1
User Login Table
User login table used to store users who can login, as shown
[image:3.595.310.548.368.438.2]in Table 1.
Table 1. Login User
Attribute Type Length Detail
Id Integer 10 Primary key
Username Varchar 20 Name of user
Password Varchar 20 passcode
4.3.2
Data Table
Data tables are used to store school identity and scores obtained from secondary data.
Table 2. Data Table
Attribute Type Length Detail
Id Integer 15 Primary key
School name Varchar 20 School identity
First value Float 5 Standar score
Second value Float 5 Standar score
Third value Float 5 Standar score
Fourth value Float 5 Standar score
Fifth value Float 5 Standar score
Sixth value Float 5 Standar score
Seventh value Float 5 Standar score
Eight value Float 5 Standar score
4.3.3
Setting Table
Setting table is used as the input parameter setting. Problem identification and formulation
Literature review
200 school datasets with 8 criteria values
Designing Education Quality Mapping System
Implementation and Evaluation
Table 3. Setting Table
Attribute Type Length Detail
Id Integer 5 Primary key
C1 Float 5 Cognitive 1
C2 Float 5 Cognitive 2
Swarm Float 5 Swarm size
Number of k Float 5 Number of cluster
w Float 5 Weight score
4.3.4
Clustering Result table
[image:4.595.333.516.110.267.2]this table is used as showing the output of clustering results.
Table 4. Result Table
Attribute Type Length Detail
Id Integer 5 Primary key
School name Float 5 School name
Level score Float 5 score
5.
EXPERIMENTAL RESULT
5.1
Information System Framework
[image:4.595.52.281.256.338.2]200 The data on school education value is processed using PSO method to find the best centroid value. The best centroid results are processed using K-Means method for value grouping process. the results are grouped into five level categories.
Fig 2: Information System Framework
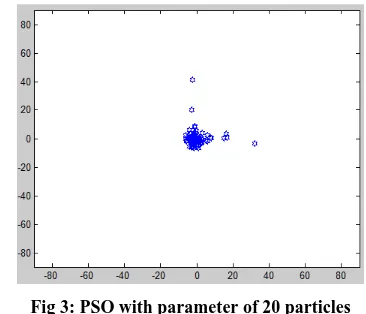
In this case the K-Means method requires accurate initial centroid values in order to properly cluster the data into each cluster. The PSO algorithm can solve the problems in the K-Means Algorithm. Hybrid PSO + k-K-Means testing was done using 200 school data in which there were 8 assessment criteria. To test the system, tested by experimenting with several particle inputs on the PSO, 20 particles, 40 particles, 80 particles and 160 particles. In addition to the particle parameter input, other parameters used as trials in this case are inertia weigth (w), c1, c2, and initial velocity. The input
scattered data is almost gathered at one optimal point. Some other data still have not reached to the optimum point.
Fig 3: PSO with parameter of 20 particles
[image:4.595.328.516.321.634.2]In figure 4 and figure 5 below using the 40 particles and 80 particles parameters, the optimal point search for the whole data is almost towards the optimum point, there are some data populations that have not reached the optimum point.
Fig 4: PSO with parameter 40 particles
Fig 5: PSO with parameter 80 particles
[image:4.595.55.279.426.596.2]Fig 6: PSO with parameter 160 particles
Figure 7 below describes the implementation of the PSO + K-Means hybrid. Hybrid results by using different particle parameters, resulting in different data groupings. The output of PSO + K-Means method is not so different from the results obtained by using PSO method. The accuracy produced using PSO + K-Means method is different. The results are more accurate using PSO+K-Means method than without hybrid.
Fig 7: PSO+K-Means with different parameter
Figure 8 below describes the fitness values used to find the optimal value in the data population. Fitness value using the PSO method there is a decrease in the value of the use of 40 particles parameters and increased in parameters 80 and 160 particles. In PSO, the fitness value is very relative. When the use of hybrid PSO + K-Means in the search for the optimal value to clustering data, there is an increase in fitness value when adding particle parameters. The smaller the fitness value, then the search for the optimal value will be better.
Fig 8: Fitness values with PSO and PSO+K-Means
[image:5.595.54.281.326.512.2]Figure 9 below describes the purity values in a data cluster. The results obtained by using PSO and PSO + K-Means result in purity values that are not fixed. This is due to differences in test parameters being tested. Dataset in this case is very suitable when using the parameter 20 particles that produces purity 34.06 and with the smallest fitness value value is 7.45 as in figure 7 above.
Fig 9: Purity Values with PSO and PSO+K-Means
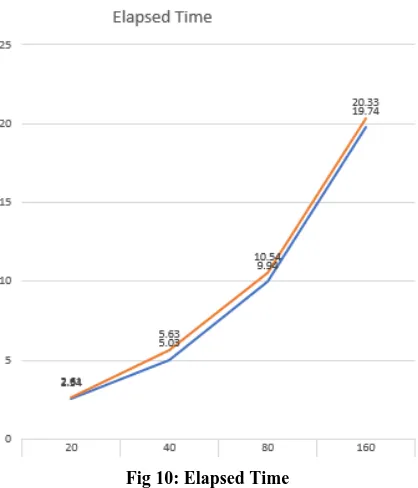
[image:5.595.326.532.426.652.2]Fig 10: Elapsed Time
experimental results can be shown in the comparison table 5 below :
Tabel 5. Comparison experiment table PSO and PSO + k-Means
Method Particle Fitness Purity Elapsed Time
PSO
20 0.82 17.06 2.54
40 0.25 15.47 5.05
80 0.26 20.76 9.94
160 0.32 15.9 19.74
PSO+k-Means
20 7.45 34.06 2.61
40 7.85 22.49 5.65
60 7.99 27.57 10.54
80 8.65 21.36 20.33
6.
CONCLUCION
Technically the use of PSO + k-Means method is very good in the search for optimal value in a population of data, but the addition of time range of data execution will increase due to hybrid computing usage, otherwise the use of PSO method has a little data excess time span, weakness is still difficult in finding the optimal value, especially the value of purity and fitness value. In this case the use of the school dataset is suitable when using the input parameter of 20 swarm. The graphs in figure 8 and figure 9 above show that the lowest fitness value and highest purity value are in the 20 swarm parameters. The application of hybrid PSO + k-Means can provide accurate data in providing the right grouping within the implementation of school quality mapping. This method is very useful when implemented to a large dataset. Large datasets will make the use of this method more accurate, and
applied in the education sector, school stakeholders can see how far their educational achievement.
7.
REFERENCES
[1] H. Jiawei, K. Micheline, and P. Jian, DATA MINING (Concept and Techniques), vol. 3, no. 13. 2012.
[2] C. Cobos, H. Muñoz-Collazos, R. Urbano-Muñoz, M. Mendoza, E. León, and E. Herrera-Viedma, “Clustering of web search results based on the cuckoo search algorithm and Balanced Bayesian Information Criterion,” Inf. Sci. (Ny)., vol. 281, pp. 248–264, 2014.
[3] L. Rokach and O. Maimon, The Data Mining and Knowledge Discovery Handbook. 2010.
[4] B. Mirkin, Clustering for Data Mining - A Data Recovery Approach. 2005.
[5] O. R. Vincent, A. S. Makinde, O. S. Salako, and O. D. Oluwafemi, “A self-adaptive k-Means classifier for business incentive in a fashion design environment,” Appl. Comput. Informatics, 2017.
[6] M. Capó, A. Pérez, and J. A. Lozano, “An efficient approximation to the K-Means clustering for massive data,” Knowledge-Based Syst., vol. 117, pp. 56–69, 2017.
[7] B. Everitt, “Cluster analysis,” Qual. Quant., vol. 14, no. 1, pp. 75–100, 1980.
[8] N. Kamel, I. Ouchen, and K. Baali, “A sampling-PSO-K-Means algorithm for document clustering,” in Advances in Intelligent Systems and Computing, 2014, vol. 238, pp. 45–54.
[9] B. F. . Solaiman and A. . Sheta, “Energy optimization in wireless sensor networks using a hybrid K-Means PSO clustering algorithm,” Turkish J. Electr. Eng. Comput. Sci., vol. 24, no. 4, pp. 2679–2695, 2016.
[10]S. Kalyani and K. S. Swarup, “Particle swarm optimization based K-Means clustering approach for security assessment in power systems,” Expert Syst. Appl., vol. 38, no. 9, pp. 10839–10846, 2011.
[11]X. Cui and T. E. Potok, “Document Clustering Analysis Based on Hybrid PSO+K-Means Algorithm,” Engineering, pp. 185–191, 2005.[12] D. W. Van Der Merwe and A. P. Engelbrecht, “Data clustering using particle swarm optimization,” 2003 Congr. Evol. Comput. 2003 CEC 03, vol. 1, pp. 215–220, 2003. [12]Ahmadyfard and H. Modares, “Combining PSO and
k-Means to enhance data clustering,” in 2008 International Symposium on Telecommunications, IST 2008, 2008, pp. 688–691.
[13]P. Arora, Deepali, and S. Varshney, “Analysis of K-Means and K-Medoids Algorithm for Big Data,” in Physics Procedia, 2016, vol. 78, pp. 507–512.
[14]B. S. Serapião, G. S. Corrêa, F. B. Gonçalves, and V. O. Carvalho, “Combining K-Means and K-Harmonic with Fish School Search Algorithm for data clustering task on graphics processing units,” Appl. Soft Comput. J., vol. 41, pp. 290–304, 2016.
[image:6.595.50.284.373.569.2]45 [16]J. Kennedy and R. Eberhart, “Particle swarm
optimization,” Neural Networks, 1995. Proceedings., IEEE Int. Conf., vol. 4, pp. 1942–1948 vol.4, 1995.
[17]R. C. Eberhart and Yuhui Shi, “Particle swarm optimization: developments, applications and resources,” Proc. 2001 Congr. Evol. Comput. (IEEE Cat. No.01TH8546), vol. 1, pp. 81–86, 2001.