ISSN Online: 2164-5353 ISSN Print: 2164-5345
DOI: 10.4236/mnsms.2018.82002 Apr. 13, 2018 21 Modeling and Numerical Simulation of Material Science
Electron Density Response to Phonon Dynamics
in MgB
2
: An Indicator of Superconducting
Properties
Jose A. Alarco, Peter C. Talbot, Ian D. R. Mackinnon
Institute for Future Environments and Science and Engineering Faculty, Queensland University of Technology (QUT), Brisbane, Australia
Abstract
Electron density differences resulting from atom displacement patterns aligned with phonon modes in MgB2 have been calculated using density
func-tional theory (DFT). The extent of phonon anomalies, identified as indicators of the superconducting transition temperature, Tc, under a range of
condi-tions in AlB2-type structures, reduce as boron atoms are displaced from their
equilibrium positions along E2g mode directions. The Fermi energy for
dis-placements along the directions of the E2g phonon mode accounts for changes
in the covalent B−B bond electronic charge density. We applied differential atom displacements to show that the shifted σ band structure associated with the light effective mass became tangential to the Fermi level and that the Fer-mi surface undergoes a topological transition at a critical relative displace-ment of ~0.6% of the boron atoms from equilibrium. The difference in Fermi energies at this critical displacement and at the equilibrium position corres-pond to the superconducting energy gap. The net volume between tubular σ surfaces in reciprocal space correlated with the depth of the phonon anomaly and, by inference, it is a key to an understanding of superconductivity. This ab initio approach offers a phenomenological understanding of the factors that determine Tc based on knowledge of the crystal structure.
Keywords
Electron Density, MgB2, Phonon Dispersion, Kohn Anomaly, Phonon
Dynamics, Superconducting Transition Temperature, Superconductivity Mechanism
1. Introduction
Density Functional Theory (DFT) offers an effective alternative to solution of a How to cite this paper: Alarco, J.A.,
Tal-bot, P.C. and Mackinnon, I.D.R. (2018) Electron Density Response to Phonon Dynamics in MgB2: An Indicator of Super-conducting Properties. Modeling and Nu-merical Simulation of Material Science, 8, 21-46.
https://doi.org/10.4236/mnsms.2018.82002
Received: February 10, 2018 Accepted: April 10, 2018 Published: April 13, 2018
Copyright © 2018 by authors and Scientific Research Publishing Inc. This work is licensed under the Creative Commons Attribution International License (CC BY 4.0).
http://creativecommons.org/licenses/by/4.0/
DOI: 10.4236/mnsms.2018.82002 22 Modeling and Numerical Simulation of Material Science many-body Schrodinger wave equation for multi-atom structures to determine the ground state electronic properties of a crystalline material [1]. For many materials including superconductors, DFT provides facile resolution of fine-scale structural variations (i.e. picometer) because electron density is the key variable in real, three-dimensional coordinate space for a particular crystallography [1]. This fundamental attribute of DFT arises because charge distribution calcula-tions are an explicit feature of these methods [2]. It follows then, that detailed analysis of calculated charge distributions could provide insight into the under-lying mechanisms of superconductivity and other electron dependent pheno-mena. We evaluate charge distributions in the boron-boron (B−B) plane of a conventional superconductor, MgB2, that complement earlier work on phonon
distributions in the type structure. There are many theoretical and experimental studies on MgB2 extant in the literature. This abundance of information
com-bined with a simple structure containing two atom types provides an excellent reference for detailed DFT modelling of electron distributions in a conventional BCS superconductor.
The superconducting transition temperature, Tc, not only determines the
practical applicability of a superconducting material, but it also helps identify mechanisms from which superconductivity emerges [3]. Current approaches to determine the Tc of a material from knowledge of its crystal structure still rely on
adjustment of Coulomb pseudo-potentials and effective electron phonon coupl-ing constants; thus, significant ab initio value and prediction capacity are lost. In light of excellent correlations found between temperatures derived from anoma-lies in phonon dispersions and Tc for AlB2 type compounds [4] [5], under a wide
range of external conditions and without any corrections or adjusting parame-ters [6] [7], this work explores electron density responses to the phonon dynam-ics. This ab initio approach provides a basis for design of new materials with a priori predictable superconducting transition temperatures.
A valuable contribution to superconductivity models is the use of DFT to cal-culate the deformation potentials [8] of MgB2, a superconductor at 39 K [9]. This
approach determines the amount of energy that breaks the degeneracy of σ elec-tronic bands per unit length of B−B inter-bond distances. These distances are modified according to specific vibration patterns and then frozen in a model calculation [2]. Using this approach, An and Pickett [2] observe that the dis-placement patterns of B1g, A2u, and E1u modes produce no visible effect in the
electronic bands of MgB2. They estimate that the deformation potentials of these
modes are at least a factor of 25 smaller than those for displacement patterns as-sociated with the E2g mode [2]. This approach clearly identifies the E2g vibration
mode as a key factor in the superconducting mechanism for MgB2 as emphasised
DOI: 10.4236/mnsms.2018.82002 23 Modeling and Numerical Simulation of Material Science we explore these variations of modes with inter-bond distance which we show corresponds to effects of temperature.
Recently, deformation potentials have been used in McMillan equations to ex-plain the effects of structural parameters on the Tc of MgB2 and substituted
forms [7] [8]. The McMillan equation determines reasonably well the Tc of
known superconductors based on normal state parameters [8] [10] [13]. This fact offers hope that standard DFT may provide all the necessary characteristics of a superconducting material based only on knowledge of the crystal structure
[14]. However, the temperature dependencies of Tc estimates using McMillan
equations are often not identified in preference to comparisons of the electron density of states for different related structures [7] [8]. For example, recent at-tempts to identify thermal effects on superconductivity from lattice vibrations invoke zero point lattice fluctuations [15] without consideration of increased amplitude of vibration for temperatures above 0 K.
We now extend these concepts and, in taking a lead from the early work of An and Pickett [2], use DFT calculations to examine the deformation of specific atomic bonds or their charge distribution relevant to particular vibration modes within a structure. We also make an explicit correlation of the increased ampli-tude of vibration expected as a function of temperature for different phonon modes. In this work, we show that such an approach using ab initio DFT me-thods is an effective way to visualise the transition to superconductivity in MgB2.
In addition, we use this approach to re-examine the effects of displaced atom positions that align with key phonon vibration modes on the electronic proper-ties of MgB2. We utilize this technique to identify specific response(s) of electron
density to these atom displacements and relate these effects to changes in the Fermi energy and Fermi surface of MgB2. These changes, explicitly determined
using DFT calculations, explain variations of the depth of phonon dispersion (PD) anomalies with strong correlation to Tc [5] [6], directly influence
super-conductivity and establish a direct connection to variations in temperature. While these correlations are exemplified for MgB2 in this article, we submit that
this phenomenological approach is applicable across a broad range of com-pounds.
2. Computational Methods
DFT calculations are undertaken using the CASTEP module of Materials Studio 8.0, using the linear response method from this software suite [16] [17]. The li-near response within the Local Density Approximation (LDA) and Generalized Gradient Approximation (GGA) with norm-conserving pseudo-potentials, a plane-wave basis set and a dense k-grid provide the most consistent model out-comes for the MgB2 structure [4] [5] [6]. Calculations are undertaken with a
DOI: 10.4236/mnsms.2018.82002 24 Modeling and Numerical Simulation of Material Science Unless specified, calculations have been customized to spin-unpolarized metal, cut-off energy 990 eV, a non-relativistic treatment and convergence criteria as follows: energy at 5 × 10⁻⁶ eV per atom; maximum force at 0.01 eV Å−1;
maxi-mum stress at 0.02 GPa and maximaxi-mum atom displacement at 5 × 10⁻⁴ Å.
For unit cell calculations on MgB2 with P6/mmm symmetry, lattice
parame-ters a = b = 3.085 A and c = 3.523 A are used as input values [9] [18] [19]. For electronic band structure calculations, the computation time is significantly shorter than that required for PD calculations [5]. Therefore, higher resolution grids (i.e. for k-grid separation Δk < 0.02 A−1) are utilized for band structure
calculations. We also define relative atom displacement values, Dx, in terms of
relative unit cell coordinates for the B−B plane. Thus, a value for Dx = 0.008
de-fines a movement, or displacement of the boron atoms, along a real space direc-tion relative to the a lattice parameter of 0.8% relative where the cell parameter is 1.0. Using the unit cell dimensions for MgB2, this example represents a
dis-placement of 2.468 pm. A positive or negative sign for the Dx value designates an
extension or compression of the atom-atom displacement, respectively. This atom displacement is annotated with respect to the B–B plane due to its signifi-cant contribution to superconductivity in MgB2 [2] [11] [13].
Materials Studio 8.0 allows for the determination of electron density differ-ences and electron localization functions by selecting appropriate options in the set-up for each calculation [17]. Materials Studio provides the option of gene-rating the electron density difference in two different ways: 1) to calculate elec-tron density differences with respect to a linear combination of the atomic den-sities or 2) to calculate the electron density differences with respect to a linear combination of the densities of sets of atoms contained in the model. Alterna-tively, the program provides for both approaches to be selected simultaneously. For this work, electron density differences are calculated with respect to a linear combination of the atomic densities.
The electron localization function (ELF) provides a useful qualitative descrip-tion of chemical bonding. This funcdescrip-tion, retrievable from Materials Studio 8.0 through set-up conditions, follows the approach introduced by Becke and Edge-combe [20] and the revised interpretation in more recent literature [21]. The outputs from electron density difference and electron localization function cal-culations are very sensitive to choice of the iso-value for the corresponding iso-surfaces. Within a comparison series, iso-values are selected in order to en-hance the contrast of properties but are maintained at constant value within a series of computations. This approach highlights the influence of the displace-ment parameter and changes made to this parameter in a computational series.
DOI: 10.4236/mnsms.2018.82002 25 Modeling and Numerical Simulation of Material Science
[22], are shown to successfully estimate Tc for MgB2 [8]. This approach is
visual-ly demonstrated on two web sites [23] [24] which display the dynamic behaviour of σ electronic bands that are strongly linked to E2g phonon modes in MgB2.
For the initial structural model, geometry optimization is undertaken as re-ported previously [4] [5]. However, for subsequent calculations in which an atom displacement position is assumed, further geometry optimization is not undertaken. In this way, a frozen picture of the electron distribution at an in-termediate position of the particular phonon mode is created. We have evaluated displacement patterns corresponding to the A2u, E1u and both E2g modes, as
de-scribed by Kunc et al. [10]. For the E2g modes, these displacement patterns
pre-dominantly involve boron atoms in the a-b plane.
With displaced atom positions frozen in place, electronic band structures are calculated using the selected configuration with appropriate consideration of structural symmetries invoked by the displaced atom positions. By constraining these atom positions to a new symmetry condition, the computation is simpli-fied and the calculation time is reduced. We have demonstrated in earlier work [5] [6] [7] that comparison of models using the LDA and GGA functionals pro-vides an excellent measure of internal consistency for AlB2-type structures and a
source of error estimates for a generic model.
In order to calculate the phonon dispersions (PD’s) for displaced positions of boron atoms, geometry optimization is required, and may be limited to atom projections without changing lattice parameters. To prevent geometry optimiza-tion from relocating displaced atoms to their equilibrium posioptimiza-tions, a primitive symmetry and very high force convergence tolerances are used. For the MgB2
structure, force tolerances of 0.35 eV/Å and 0.5 eV/Å are required for bond dis-tance changes up to ±0.006 (= ±0.6%) and for ±0.008 (= ±0.8%) in terms of rela-tive coordinates. Thus, large restoring forces are maintained and accordingly, computational models achieve convergence for PD calculations. Because these PD calculations are computationally intense (using 196 q-points), we have li-mited this type of study to one E2g PD mode and the corresponding σ band
Fer-mi surface using the LDA functional. Outcomes from this calculation are shown in Section 3.3 for selected displaced atom positions with reduced symmetry ap-proximating the G−A, G−K and G−M directions.
3. Modelling Results
DOI: 10.4236/mnsms.2018.82002 26 Modeling and Numerical Simulation of Material Science displacement from equilibrium, the phonon anomalies collapse with clear implica-tions for the Fermi surfaces and, by inference, for superconductivity of MgB2.
3.1. Electron Density
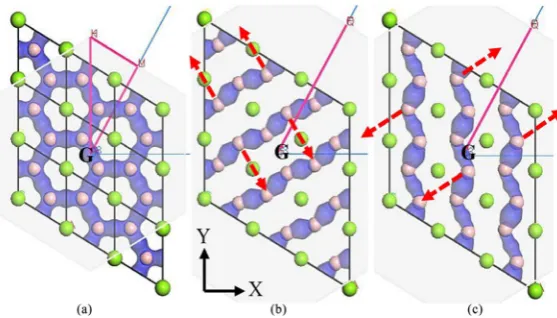
As noted, the choice of iso-value greatly influences the visual representation of electron density differences and the electron localization function. Furthermore, to illustrate the influence of atom displacement, we show in Figure 1 the differ-ence in electron density (in blue) for the symmetric MgB2 structure and for two
situations with perpendicular in-plane displacements of boron atoms. These in-plane displacement directions correspond to two different E2g modes in the
MgB2 structure, with an exaggerated relative displacement of +0.05 (in relative
coordinates) using the same iso-value of 0.15. This relative displacement value may be extreme compared to what is physically reasonable. However, the dis-placement demonstrates that substantial changes to the electron density occur within the a-b plane of the MgB2 structure when boron atoms are shifted along
the dominant optical phonon mode direction.
[image:6.595.233.512.474.633.2]For each calculation represented in Figure 1, the iso-value is kept constant in order to avoid introducing secondary effects on these results. Figure 1 demon-strates that electron density migrates from regions with longer B–B distances to regions with shorter B−B distances. This outcome is not unexpected because an increase in B−B repulsion requires a corresponding response in electronic bond charge population to reduce the overall energy. However, the sustained localiza-tion of the electron density differences along the highly covalent B−B bonds is informative. Similar visualizations of electron density differences can be ob-tained for smaller atom displacements with appropriate adjustment of the iso-value.
Figure 1. Calculated representations of electron density differences (in
DOI: 10.4236/mnsms.2018.82002 27 Modeling and Numerical Simulation of Material Science For comparison, we also show the effects on electron density with atom dis-placements along the A2u vibration mode in Figure 2. In Figure 2, the relative
displacement of boron atoms is the same as used for calculations shown in Fig-ure 1 (+0.05 in relative coordinates). FigFig-ure 2(a) shows electron density differ-ences for the A2u mode looking along the c-axis equivalent direction and Figure
2(b) is the view perpendicular to the c-axis. Figure 2(b) shows that the boron
planes, with the superimposed electron density difference, are closer to Mg atoms in the plane immediately above the boron plane than to the Mg plane immediately below. This outcome is also expected for the A2u mode of the MgB2
structure. The view of electron density difference along the c-axis (Figure 2(a)) shows the in-plane symmetry of MgB2 is similar to that in Figure 1(a).
Figure 3 shows the electron density difference of the E1u mode for a similar
level of relative displacement with (+0.05 in relative coordinates) along the di-rection of the B−B bond. Figure 3 shows atom positions viewed along the c axis in which the Mg atoms are shifted in the direction of the arrows or approx-imately along <110>. In Figure 3, Mg atoms are closer to the B atoms of the ad-jacent hexagonal ring rather than symmetrically at the centre of the (001) pro-jection in an undistorted unit cell. Nevertheless, a change in symmetry of the electron density difference on the boron plane is not detected with this imposed relative displacement of atoms along E1u modes.
To illustrate the effect of an incremental increase or decrease in B–B bond length due to incremental displacement of atoms along an E2g phonon mode,
Figure 4 shows the resulting electron density differences in a series of single unit cells with superimposed electron density differences (in light blue) and localiza-tion funclocaliza-tions (in dark blue) using the same iso-value (e.g. 0.15) as in Figure 1. Scrutiny of the series of relative displacements in Figure 4 shows that there is an asymmetric arrangement of the electron density differences and the electron
Figure 2. Electron density difference distributions (in blue) in
DOI: 10.4236/mnsms.2018.82002 28 Modeling and Numerical Simulation of Material Science
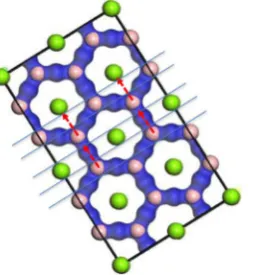
Figure 3. View along the c-axis direction of MgB2 showing the electron density
dif-ference (in blue) for displacements corresponding to the E1u mode (red dashed arrows denote direction of displacement). Note the minor shift of Mg atoms in the direction of the displacement; light blue grid lines are guides only.
Figure 4. View along the nominal c-axis direction of
MgB2 showing the electron density difference (light blue) with superimposed electron localization func-tions (dark blue) for a series of incremental atom displacements corresponding to one of the E2g mod-es. The relative displacement values (Dx = ±0.00 n) are enumerated for each unit cell configuration. Mg atoms are green and boron atoms are pink; red ar-rows are guides to regions of significant change.
[image:8.595.274.471.280.565.2]DOI: 10.4236/mnsms.2018.82002 29 Modeling and Numerical Simulation of Material Science in electron distribution are more subtle in Figure 4 than in Figures 1-3 because the magnitudes of the displacements are smaller.
The data in Figure 4 show an asymmetry between the elongated and the compressed directions of the inter-bond distance. For example, in this configu-ration a complete B−B bond is located in the centre of the unit cell and four half-bonds (i.e. two net bonds) point towards the unit-cell edges. This results in an imbalanced response (by a factor of 2) to compression or extension. In com-pression, an increased electronic charge is established between the boron atoms within the same unit cell. When these bonds are stretched or extended, adjacent B−B bonds are compressed with a resulting build-up of equivalent increased electronic charge at the edges of the unit cell, but distributed to twice the num-ber of bonds.
It is clear from the above analyses that the E2g modes are the only modes to
generate observable modulated electron density differences within the boron plane. This modelled outcome is consistent with previous experimental data and calculations that show the E2g mode is strongly electron-phonon coupled and a
key enabler of superconductivity in MgB2. These electron density differences
produce bond charge modulations which have super-lattice periodicities with respect to the original MgB2 crystal. These changes reflect the effects of mobile
electronic charge response along the bond direction(s) due to the changes in in-teratomic attractions and/or repulsions from atomic displacements induced by the E2g phonons (see Discussion).
3.2. Band Structures
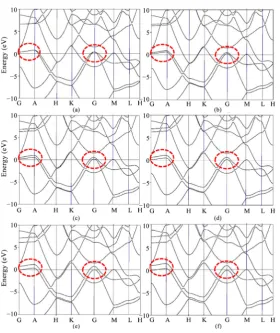
We have evaluated the influence of atom displacements—using similar parame-ters as in Section 3.1—on the electronic band structure of MgB2. Figure 5 shows
the electronic band structures for a series of incremental changes in relative dis-placement from the equilibrium position that follow the movement of an E2g
mode along the B−B inter-bond direction. These band structures are calculated using the LDA functional with k-grid separation Δk = 0.01 A−1.
With increased distance between displaced boron atoms, the primary influ-ence on the band structures is removal of band degeneracy along the G−A (or G−Z) reciprocal direction adjacent to the Fermi level (Figure 5; circled). In ad-dition, a corresponding separation of the inverted parabolas (nearly free-hole like) occurs at G. Figure 5(e) also shows that an electronic σ band (the inverted parabolas at the G point near the Fermi level) becomes nearly tangential to the Fermi level for the relative atom displacement Dx = ±0.006.
3.2.1. Fermi Energy
We determine the calculated Fermi energy for each model of MgB2 with a
DOI: 10.4236/mnsms.2018.82002 30 Modeling and Numerical Simulation of Material Science
Figure 5. Electronic band structures for MgB2 calculated using the LDA
functional with B–B atom displacements along an E2g direction corres-ponding to (a) Dx = 0.0; (b) Dx = −0.002; (c) Dx = −0.003; (d) Dx = −0.004; (e) Dx = −0.006 and (f) Dx = −0.008. Note that for a displacement around −0.006, the lower parabolic branch of the electronic band at G becomes tangential to the Fermi level, and for −0.008 this branch is al-ready below the Fermi level.
Boltzmann’s constant and T is temperature, participate in electronic transport properties at the Fermi energy. Use of DFT with a consistent approach and software suite can provide accurate values of the Fermi energy for MgB2 and
similar structures with reference to the total number of valence electrons. Note that some earlier computational studies choose to denote a reference point for the Fermi energy at different values to that used in this and our earlier studies [4] [5], closer to the top of the valence band, emphasizing the hole nature of the charge carriers.
DOI: 10.4236/mnsms.2018.82002 31 Modeling and Numerical Simulation of Material Science
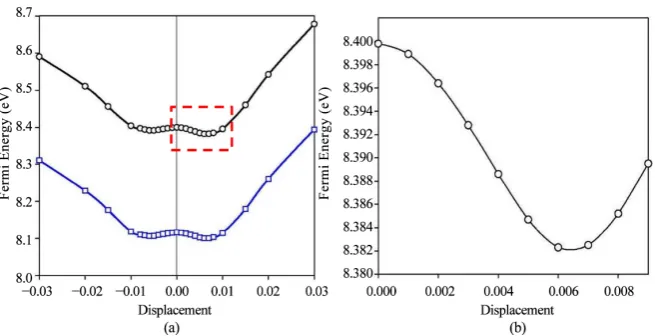
Figure 6. (a) Fermi energies using the LDA and GGA functionals with Δk = 0.01 A−1
(and lattice expansion factor 1.000x) for MgB2 with various displaced B–B bond dis-tances; (b) Enlarged view of the Fermi energies in the region within the red dotted rectangle. These data are obtained using the LDA functional calculated at a k-grid, Δk = 0.01 A−1.
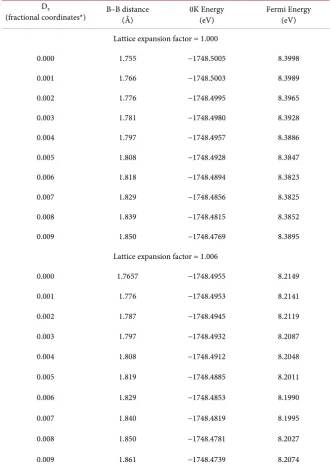
lengths and Fermi energy determined with the LDA functional for a range of atom displacements and for a lattice expansion of 1.006x in Table 1. This factor of 1.006x is an approximation to an isotropic expansion of the entire lattice (or unit cell) equivalent to ~40 K. In contrast, an expansion factor of 1.000x represents lattice parameters optimised for absolute zero temperature.
Figure 6 shows that the variation of calculated Fermi energies using the LDA and GGA approximations are similar in form and appearance but with a differ-ence in energy of ~0.38 eV. In all other respects, the curves for both calculations are identical. In both cases, the Fermi energy displays local minima at relative displacements of about Dx = ±0.006 and a local maxima at the equilibrium
posi-tion (Dx = 0.000). The depth of the energy minimum at the elongated position
(Dx = +0.006) is approximately two times the value of the energy minimum at
the contracted position (Dx = −0.006). The difference in Fermi energies between
the elongated minimum and the equilibrium position is ~17.5 meV and 15.9 meV, for lattice expansion factors 1.000x and 1.006x, respectively. These values, particularly the difference for the lattice expanded by 1.006x, are comparable to two times the value of the MgB2 superconducting gap [25] [26]. The differences
in Fermi energies for the contracted and elongated displacements appear related to the number of contracted bonds identified in Figure 4.
3.2.2. Fermi Surface
The widely accepted topology of the MgB2 Fermi surface consists of coaxial,
DOI: 10.4236/mnsms.2018.82002 32 Modeling and Numerical Simulation of Material Science
Table 1. Parameters for MgB2 calculated using the LDA functional.
Dx
(fractional coordinates*) B–B distance (Å) 0K Energy (eV) Fermi Energy (eV)
Lattice expansion factor = 1.000
0.000 1.755 −1748.5005 8.3998
0.001 1.766 −1748.5003 8.3989
0.002 1.776 −1748.4995 8.3965
0.003 1.781 −1748.4980 8.3928
0.004 1.797 −1748.4957 8.3886
0.005 1.808 −1748.4928 8.3847
0.006 1.818 −1748.4894 8.3823
0.007 1.829 −1748.4856 8.3825
0.008 1.839 −1748.4815 8.3852
0.009 1.850 −1748.4769 8.3895
Lattice expansion factor = 1.006
0.000 1.7657 −1748.4955 8.2149
0.001 1.776 −1748.4953 8.2141
0.002 1.787 −1748.4945 8.2119
0.003 1.797 −1748.4932 8.2087
0.004 1.808 −1748.4912 8.2048
0.005 1.819 −1748.4885 8.2011
0.006 1.829 −1748.4853 8.1990
0.007 1.840 −1748.4819 8.1995
0.008 1.850 −1748.4781 8.2027
0.009 1.861 −1748.4739 8.2074
*From geometry optimized relative coordinates (0.3333, 0.6666, 0.5).
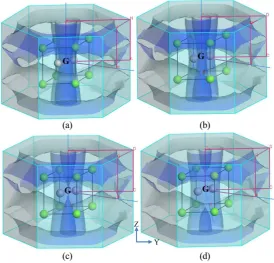
incremental increase in atom displacement from the equilibrium position. These Fermi surfaces are shown for calculations using the LDA functional with Δk = 0.01 A−1 in Figure 7.
Ulti-DOI: 10.4236/mnsms.2018.82002 33 Modeling and Numerical Simulation of Material Science mately, the Fermi surface collapses into a thin line at the mid-point of the reci-procal cell when the relative atom displacement, Dx = −0.006 as shown in Figure
7(c). This relative atom displacement is the point at which the corresponding σ
band becomes almost tangential to the Fermi level as identified in Figure 5. With further atom displacement, the σ Fermi surface breaks apart into two ap-proximate paraboloid sections that face in opposite directions as shown in Fig-ure 7(d).
Parallel warped tubes coaxial with the z-direction shown in Figure 7(a) cor-respond to the heavy (outer tube) and light (inner tube) effective mass σ bands. The light effective mass σ band displays a topological transition to separate pa-raboloid sections facing in opposite directions (Figure 7(d)) as the B-B distance is gradually increased (or decreased) about 0.6% in relative coordinates. Other Fermi surfaces near the surrounding Brillouin zone boundaries do not change significantly and correspond to the π bands.
3.3. Phonon Dispersions
We have utilized the phonon dispersion (PD) in previous computational analys-es to illustrate the strong link between optical phonon behaviour and band structure in MgB2 [5]. We have also shown that the depth of the PD anomaly
[image:13.595.235.510.420.683.2]provides a temperature which corresponds to the superconducting transition temperature for a wide range of external conditions, accurate within experimental and calculation errors [5] [6] [7] [14]. Consistent with this approach, we also
Figure 7. Fermi surfaces of MgB2 calculated with LDA for Δk = 0.01 A−1
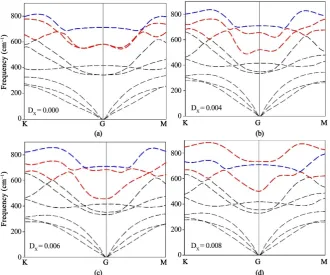
DOI: 10.4236/mnsms.2018.82002 34 Modeling and Numerical Simulation of Material Science highlight in Figure 8 the influence of incremental atom displacements on spe-cific phonon modes. As noted in earlier work, PD calculations are computation-ally intensive [5] [7]. Hence, this evaluation of atom displacements is performed using the LDA functional with fewer sampling points and limited reciprocal space directions (e.g. along G−M, G−K and G−A only). Figure 8 shows the changes in PD modes for G−M and G−K reciprocal directions with particular emphasis on the E2g phonon with increase in relative atom displacement from
[image:14.595.208.539.394.669.2]the equilibrium position.
Figure 8 shows significant change in the form of the E2g phonon anomaly with
increased atom displacement from equilibrium and an increase in energy of one of the degenerate modes at G. At large atom displacement (e.g. Dx = 0.008;
Fig-ure 8(d)), the E2g phonon anomaly (below the B2g mode) is absent and the order
of modes (i.e. relative energy or frequency) is reversed between the B2g and E2g
phonons. Evaluation of the band structures in Figure 5 shows a corresponding change in form of a σ electronic band branch which shifts below the Fermi level. This feature also corresponds with changes in the Fermi surface as shown in
Figure 7 where, at relative displacement Dx = 0.008, the surface becomes two
separate paraboloids. These computational outcomes further confirm the strong link between the electronic bands, Fermi surface nesting and the depth of the PD anomaly. These inter-relationships are clearly associated with the supercon-ducting transition temperature for AlB2-type structures [4] [5] [6] [7] [29].
Figure 8. Phonon dispersion plots for MgB2 calculated with the LDA functional for
DOI: 10.4236/mnsms.2018.82002 35 Modeling and Numerical Simulation of Material Science
4. Discussion
In earlier publications, we utilize ab initio DFT to recognize the shape and extent of the E2g phonon anomaly in MgB2 [4] [5] as well as in metal-substituted MgB2
[5] [7] and MgB2 under the influence of hydrostatic pressure [6]. In each of these
studies, we compare computational outcomes with experimental data to show that the phonon dispersion (PD) is an effective tool for recognition of a phonon anomaly and that the thermal energy of this anomaly is correlated with the ex-perimentally determined value of Tc for the superconducting transition of MgB2
compounds. This approach—based primarily on calculated PDs—is extended to other AlB2-type compositions [5] and is also the basis for prediction of new
compounds that are likely to be superconductors [5] [7].
As is well-known, a strong crystallographic link exists between band structure calculations and PD models based on DFT. This link between phonon behaviour and electronic band structure requires fine k-grid resolution and thus high computational cost to elucidate PD data [5] [7]. However, MgB2 offers an ideal
structural format to highlight this link between electron and phonon behaviour consistent with the well understood view of electron-phonon coupling as key to conventional superconductivity [30]. A connection between the E2g phonon and
the Fermi surface as well as components of the E2g phonon anomaly with the
band structure at or near G is described for MgB2 [5] [6] and more recently,
elu-cidated by experiment [31] using Inelastic X-ray Scattering (IXS). In this work, we elaborate further on the interaction between the electronic band structure and phonon behaviour of MgB2, in particular, as revealed by electron density
difference distributions in response to deformation potentials.
4.1. Fermi Energy
Born and Oppenheimer introduced the adiabatic approximation, in which elec-trons are expected to move much faster than heavier nuclei, allowing for a very rapid redistribution of electronic charge, every time a nuclei undergoes move-ment [32] [33]. This assumption allows for substantial separation of nuclear and electronic coordinates while solving the Schrodinger equation [33]. As pointed out by Boeri et al. [34], the Born-Oppenheimer approximation is implicitly as-sumed in DFT, whereby the electron density distribution can be calculated for each ionic configuration. According to Uchiyama et al. [35] the close agreement between DFT calculated electronic bands and Angle Resolved Photoemission (ARPES) data up to binding energies as high as 2.5 eV suggests that electronic correlations in MgB2 are unimportant. As a result, they contend that this
materi-al is well described by conventionmateri-al band theory [35].
Boeri et al. [34] argue against the validity of the adiabatic approximation for MgB2, based on an abnormally small (~0.5 eV) Fermi energy (EF) calculated for
DOI: 10.4236/mnsms.2018.82002 36 Modeling and Numerical Simulation of Material Science electron densities or charge carriers determined experimentally from resistivity measurements and from Drude approximations. For example, measurements of the Hall coefficient for MgB2, indicate that the charge carriers are holes with a
density of 1.7 - 2.8 × 10²³ holes cm−3 at 300 K [27] [36] [37]. In contrast,
calcula-tions by Suzuki [38], referred to the vertex of the parabolic bands, estimate a carrier concentration of ~1022 holes cm−3 an order of magnitude different to
ex-periment.
The disparity between calculated Fermi energy and experimental measure-ments—albeit indirect—appears in many publications that refer the energies to the top of the valence bands and reset the reference Fermi level to zero energy. We consider this disconnect between the absolute Fermi energy values calcu-lated by DFT (from the total number of available valence electrons and states) and the traditional “zeroing” of the reference level to cause loss of valuable in-sight and to be a source of potential confusion in the literature. A critical factor for this work, and others requiring similar detail and accuracy, is that the topol-ogies of Fermi surfaces are determined by the absolute calculated Fermi energy with respect to Brillouin zone dimensions, where valence states are essentially filled with the total number of valence electrons (with a two times division to account for spin directions in spin unpolarized calculations). This change in ref-erence point for the Fermi energy, combined with aggregation of information in reduced Brillouin zone schema in reciprocal space lead to complications with interpretation as outlined in the next section.
The calculated Fermi energies for a range of configurations in MgB2,
pre-sented in Table 1 are consistent with earlier DFT models for metal substituted or pressure dependent forms [5] [6] [7]. DFT calculations for MgB2 using
CASTEP in Materials Studio result in a Fermi energy of 8.3998 eV and 8.1165 eV using the LDA and GGA approximations, respectively. The results from CASTEP are more consistent with the high carrier densities determined from Hall effect measurements [27] [36] [37]. Thus, we consider that the absolute value of Fermi energy ranges between 8.1 eV and 8.4 eV as consistently demon-strated in a number of DFT computations undertaken previously [5] [6]. The in-sight we learn from ab initio DFT is that choice of appropriate functionals and proper account of valence electron numbers help elucidate the strong correlation between electronic, vibrational and superconducting properties for MgB2.
Fur-thermore, we argue that the adiabatic approximation is a justifiable assessment for MgB2 for a wider range of conditions than previously considered.
4.2. Fermi Surfaces, Phonons and Gap Values
The Fermi surface separates the filled electronic states from the empty electronic states in three-dimensional reciprocal space at absolute zero temperature [39]. The widely accepted topology of the MgB2 Fermi surface consists of coaxial,
ef-DOI: 10.4236/mnsms.2018.82002 37 Modeling and Numerical Simulation of Material Science fective masses for the σ bands, respectively [2] [28] [40]. The hole nature of the tube implies that at absolute zero temperature the inside of the tube is empty and the outside of the tube is filled. This requires that in an extended zone scheme, tubular Fermi surfaces should be located away from the origin, possibly at the corners or outside the first Brillouin zone. Referral of the Fermi energy to the vertex of the approximate parabolic σ bands may unnecessarily confuse in-terpretation of electronic parameters and construction of Fermi surface topolo-gies in this structure and others. Apparent confusion in the literature arises be-cause in graphic representations, boundaries for Fermi surfaces are displayed without a clear delineation of where electrons and empty states, respectively, re-side.
Furthermore, two parallel tubular Fermi surfaces also create a dilemma when the two tubes are represented in a coaxial fashion. This is because at zero tem-perature, in the volume between these two surfaces, electrons occupy energy le-vels outside the inner light effective mass tubular section, while empty states with identical magnitude of momentum and energy exist inside the outer, heavy effective mass tubular section [27] [30]. We suggest that this dilemma is, in practical terms, resolved via the schematic shown in Figure 9 for the coaxial σ Fermi surfaces of MgB2. In this schematic, we neglect the warping of the σ Fermi
surfaces as previously described [6].
[image:17.595.216.531.439.658.2]In the reduced zone scheme of the Brillouin zone, the inter-tube volume is an important region where levels close to the Fermi energy with identical k-vectors plus or minus a reciprocal space G vector (and similar energy) show filled character
Figure 9. Idealised schematic of the σ Fermi surfaces for MgB2 represented in an
DOI: 10.4236/mnsms.2018.82002 38 Modeling and Numerical Simulation of Material Science relative to the light effective mass, but an empty character relative to the heavy effective mass [6]. We assume that a reduced zone representation, in essence, aggregates tubes of different diameter that occur at different places in an ex-tended Brillouin scheme, connected by reciprocal space G vectors. Therefore, we infer that an extended zone scheme explicitly manifests a resonating behaviour between the tubes at different reciprocal space locations (shown in Figure 9) [6] and may be a more appropriate representation of these states compared with a reduced zone schematic.
We have previously shown that the apparent inter-tubular volume controls the depth of the phonon dispersion anomalies in AlB2-type structures [5] [7].
We have also demonstrated a correlation between a temperature associated with the PD anomaly (i.e. Tδ) and Tc, and, as an extension of this phenomenom,
pro-pose that this inter-tubular volume is a key region in reciprocal space for super-conductivity. As pointed out by Geballe et al. [3], Tc itself and its response to
controlled changes in external parameters, often help reveal the responsible me-chanisms for superconductivity. Given the excellent correlation between the depth of PD anomalies, Fermi surfaces and Tc, it appears that useful insights on
superconducting mechanisms are hidden within these inter-tubular Fermi sur-face constructs.
4.3. Dynamic Fermi Surfaces and Bond Charge Modulations
Figure 8 shows a clear transition of Fermi surfaces with increased atom dis-placement from the equilibrium position for MgB2. This transition involves thecollapse of one σ Fermi surface as the B−B distances are displaced relative to the equilibrium value. This transition also corresponds to a disruption of the cohe-rent interconnection, or nesting, between the two tubular sections. When these tubes are parallel, the hole/electron states are at exactly the same k-point plus or minus a reciprocal space vector G and similar energy for the separate light and heavy mass surfaces. These filled/vacant electron states can be nested by pho-nons of the exact same magnitude. However, once one surface collapses, this perfect nesting is disrupted and the model suggests that this is when the super-conducting Tc is breached. This modelling also suggests that the condition at
which these tubular sections cannot be connected by the same magnitude pho-non may signal the beginning of incoherent scattering in MgB2.
The form of parallel Fermi surfaces shown in Figure 9 (and, more precisely, in Figure 7) are similar to the ideas and figures discussed by Bardeen (Figure 1 in ref [41]). In Bardeen’s article, a shell structure around the Fermi surface is identified as the region of electron states that are important for superconductiv-ity. The Fermi surface of MgB2 for significantly displaced boron atoms is also
similar to the effect of Al substitution in Mg1-xAlxB2 [42] (compare Figure 7 of
this work with Figure 4 of [42]). Both results show an evolution to a topology with two separate cusps, with corresponding degradation of superconducting properties.
DOI: 10.4236/mnsms.2018.82002 39 Modeling and Numerical Simulation of Material Science separate sets of cusps that retain similar parallel shapes. In contrast, and as shown in Figure 7, after the critical displacement or separation of boron atoms is achieved (at relative displacement Dx = ±0.006), one surface completely
col-lapses and the remaining Fermi surface cusps consist of single surfaces. Alterna-tively, we may consider that as the temperature is lowered towards the super-conducting transition temperature, the mixed topology of parabolic cusps and tubular sections is interacting more strongly and evolving into the set of ap-proximately parallel tubular sections. This interpretation would then be more in-line with important concepts proposed earlier on topological transitions that determine or enhance Tc [14] [15] [43].
Figures 4-8 also highlight the duality of real and reciprocal space interactions between Fermi energy, phonon frequencies and electron density. This duality is because of a direct connection to the directional bond charge distribution that modulates the repulsive B−B forces determining the key E2g phonon frequencies
and the apparent strong localization of the electron density at the Fermi energy along the highly covalent B−B bonds. Similar undulating shapes of the PD curves [4], and the dependence of the Fermi energy on the relative atom dis-placement shown in Figure 6 reflects this duality.
The E2g frequency of the appropriate branch increases as the B–B distance is
displaced from the equilibrium position. The simultaneous drop in the Fermi energy seems to account for the energy that is passed onto the generated pho-nons, as a result of an electron jumping to alternative bonds responsible for the modified electron density differences (see Figure 4 and Figure 6). In the PD, this manifests as a higher E2g frequency with an associated reduced PD anomaly.
Once the displacement exceeds the “gap” limit, it will generate such energetic phonons that other modes become involved and the system cannot maintain coherency. A mechanical analogy to this condition is as if a natural spring is overstretched and then released, causing a disturbed movement back to the equilibrium position.
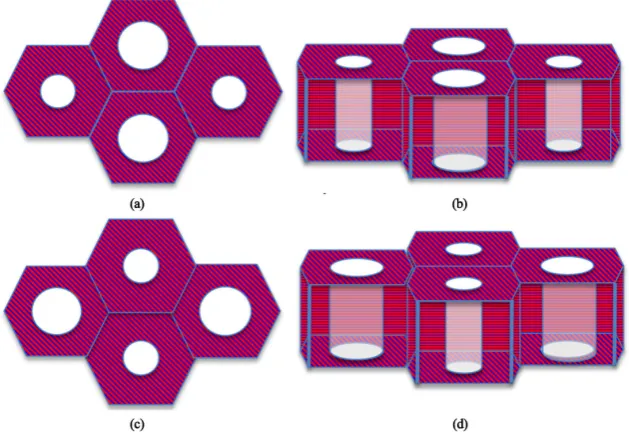
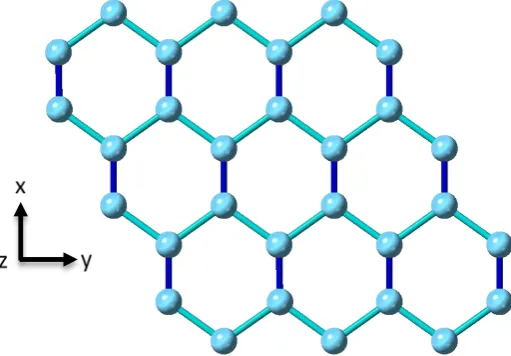
A schematic of the bond charge modulation pattern in the boron plane of MgB2 is shown in Figure 10. The charge modulation has a complex pattern that
only appears as the atoms deviate from their equilibrium positions. As the res-toring forces bring atoms back to their equilibrium positions, the modulated charge pattern disappears. The dynamic origin of the bond charge modulation observed in MgB2 may be different to that of a standard charge density wave
DOI: 10.4236/mnsms.2018.82002 40 Modeling and Numerical Simulation of Material Science
Figure 10. Schematic of the bond charge modulation pattern in the
boron plane of MgB2 based on DFT calculations for displaced atom configurations. Blue spheres represent boron atoms; dark blue bonds represent regions of higher electron density and light blue bonds represent lower electron density. Distortion along the x direction (equivalent to an E2g mode direction) for the average hexagonal unit cell is accentuated in this schematic.
The schematic in Figure 10 also reveals that modulated bond charge distribu-tions can be largely represented by net dipolar contribudistribu-tions, if not collectively, at least at the local scale. The alternating dark blue and light blue bonds between boron atoms in the a-b plane represent locally enhanced (positive) and reduced (negative) electron densities at the largely covalent B−B bonds (see also Figure 1 and Figure 4).
4.4. Temperature Dependent Mechanism
Two of the most direct manifestations of temperature effects on the geometrical structure that can be measured are the thermal expansion and the temperature dependence of lattice parameters. Both thermal expansion and changes in lattice parameters with temperature have been investigated for MgB2 [45] [46] [47] [48]
[49]. Thermal expansion is modest or even negative before and soon after the superconducting transition temperature, but develops a much sharper and linear increase at higher temperatures. The change in lattice parameters with tempera-ture follows a similar pattern. Detailed neutron refinement investigations by Jorgensen et al. [45], provide Debye Waller factors and mean square atomic dis-placements over a wide temperature range for MgB2.
Our atom displacement calculations impose an increasing change in the B–B inter-bond distance from the equilibrium distance. This approach indirectly mimics the effect of increased temperature on this inter-bond distance. For ex-ample, the mean square displacement for boron at 37 K [45] is measured as U11
= 0.00333 (11) Å2, U
33 = 0.00455 (18) Å2 and U12 = 0.00166 (6) Å2. The square
respec-DOI: 10.4236/mnsms.2018.82002 41 Modeling and Numerical Simulation of Material Science tively. If we compare these values to the difference in B–B bond distance at equi-librium and at a relative displacement Dx = ±0.006 at the transition temperature
(~39.4 K), we obtain 0.0631 Å (= 1.7551 - 1.6920) and 0.064 Å (= 1.7782 - 1.7142) for the LDA and GGA functionals. This relative displacement is for an expansion factor of 1.000x in all three real space directions. These calculated values display good correspondence with the square root of the mean square displacement for boron at 37 K based on precise experimental data [45]. There-fore, our assumption that a relative displacement of Dx = ±0.006 corresponds
approximately to the superconducting transition temperature (~39.4 K) is rea-sonable given the relative errors in calculations and in experimental measure-ments. The estimated inter-bond displacement required for collapse of super-conductivity is consistent with experimental measurements of the square root of the mean square displacements by Jorgensen et al. [45]. This consistency be-tween theory and experiment further supports our suggestion that these calcu-lated effects are directly linked to temperature.
A critical, and perhaps unique, aspect of superconductivity in MgB2 is that
electron density differences and phonon modes are largely confined to the a-b plane. This configuration allows a direct correlation of DFT calculations to key properties in the structure. This computational approach highlights that the electron density difference responds to increased atom-atom repulsion as the distance between atoms is reduced. As a result, an increased electronic bond charge is required to minimize the overall energy. These bond charges are loca-lized along the highly covalent inter B−B bond distances, and along with a pho-non mode that is oriented along the same direction, seem to moderate the cor-relation. The proportion of transferred charge density directly affects the Cou-lomb repulsions and can translate into a net force change. This net force is re-lated to a change in the magnitude of the phonon frequency.
DOI: 10.4236/mnsms.2018.82002 42 Modeling and Numerical Simulation of Material Science
5. Conclusions
The Fermi energy of the valence electrons in MgB2 is sufficient to justify the
adiabatic or Born-Oppenheimer approximation in quantum mechanics calcula-tions for MgB2. In this work, we present a model that identifies the distribution
of electrons and empty states on the MgB2 Fermi surface and, through this, a
mechanism associated with the inter-tubular volume between the σ Fermi sur-faces that tracks the onset (or demise) of superconductivity.
The net volume enclosed between the parallel heavy and light effective mass σ Fermi surfaces when represented in the reduced Brillouin zone is an important region of reciprocal space for superconductivity. This region, when represented in an extended zone (e.g. Figure 10; [6]) is suitable for a resonant interaction between separate heavy and light hole Fermi surfaces. This inter-surface region is also ideal for nesting to occur between different sections of the Fermi surface, by a phonon vector of constant magnitude, within a thermal energy range kBT
from the Fermi energy. Analysis of frozen, displaced boron atoms along the B−B inter-bond distance confirms that the phonon anomaly collapses as the in-ter-bond distance increases. The variation of Fermi energy for displacements along the E2g phonon mode that stretches or contracts along the inter-bond
dis-tance is smooth and accounts for changes in the electronic charge density along predominantly covalent B−B bonds, which reduces the overall energy by neutra-lizing increased atomic core repulsions.
The difference between the Fermi energy at a critical displacement of ~0.6% (Dx = ±0.006) in relative coordinates and the Fermi energy at the equilibrium
position displays a strong correlation to the superconducting energy gap, or multiples of the gap, depending on the number of bonds that are involved in electron density transfer. Our analysis of the shift in E2g and B2g PD bands with
atom displacement suggests that the interplay between potential energy and ki-netic (or thermal) energy stored in the inter-bond distance is a key determinant of Tc in AlB2-type materials. This analysis of displaced atomic positions also
highlights that the Fermi surface is time dependent and dynamic in character. The dynamic character of the Fermi surface is not only important for an under-standing of superconductivity, but also for many other electronic properties.
Earlier studies using McMillan equations, invoked normal state parameters to explain or predict Tc, and, consistent with this, DFT is a tool that provides all
necessary information to understand superconductivity in AlB2-type structures.
Phonon dispersion (PD) calculations shown in this work linked to band struc-ture calculations via DFT, is an effective, reliable and consistent method to ac-curately determine a temperature strongly correlated with the superconducting Tc of an AlB2-type material from knowledge of the crystal structure.
Acknowledgements
DOI: 10.4236/mnsms.2018.82002 43 Modeling and Numerical Simulation of Material Science with, QUT’s HPC facilities particularly from Ashley Wright and Abdul Sharif, is gratefully acknowledged.
References
[1] Kohn, W. (1999) Nobel Lecture: Electronic Structure of Matter—Wave Functions and Density Functions. Reviews of Modern Physics, 71, 1253-1266.
https://doi.org/10.1103/RevModPhys.71.1253
[2] An, J.M. and Pickett, W.E. (2001) Superconductivity of MgB2: Covalent Bonds Dri-ven Metallic. Physical Review Letters, 86, 4366-4369.
https://doi.org/10.1103/PhysRevLett.86.4366
[3] Geballe, T.H., Hammond, R.H. and Wu, P.M. (2015) What Tc Tells. Physica C: Su-perconductivity and Its Applications, 514, 9-16.
https://doi.org/10.1016/j.physc.2015.02.009
[4] Alarco, J.A., Chou, A., Talbot, P.C. and Mackinnon, I.D.R. (2014) Phonon Modes of MgB2: Super-Lattice Structures and Spectral Response. Physical Chemistry Chemi-cal Physics, 16, 24443-24456.
https://doi.org/10.1039/C4CP03449J
[5] Alarco, J.A., Talbot, P.C. and Mackinnon, I.D.R. (2015) Phonon Anomalies Predict Superconducting Tc for AlB2-Type Structures. Physical Chemistry Chemical Phys-ics, 17, 25090-25099. https://doi.org/10.1039/C5CP04402B
[6] Alarco, J.A., Talbot, P.C. and Mackinnon, I.D.R. (2017) Phonon Dispersion Models for MgB2 with Application of Pressure. Physica C: Superconductivity and Its Appli-cations, 536, 11-17.
[7] Mackinnon, I.D.R., Talbot, P.C. and Alarco, J.A. (2017) Phonon Dispersion Ano-malies and Superconductivity in Metal Substituted MgB2. Computational Materials Science, 130, 191-203. https://doi.org/10.1016/j.commatsci.2017.01.011
[8] Zheng, J.-C. and Zhu, Y. (2006) Searching for a Higher Superconducting Transition Temperature in Strained MgB2. Physical Review B, 73, Article ID: 024509.
https://doi.org/10.1103/PhysRevB.73.024509
[9] Nagamatsu, J., Nakagawa, N., Muranaka, T., Zenitani, Y. and Akimitsu, J. (2001) Superconductivity at 39K in Magnesium Diboride. Nature, 410, 63-64.
https://doi.org/10.1038/35065039
[10] Kunc, K., Loa, I., Syassen, K., Kremer, R.K. and Ahn, K. (2001) MgB2 under Pres-sure: Phonon Calculations, Raman Spectroscopy, and Optical Reflectance. Journal of Physics: Condensed Matter, 13, 9945-9962.
https://doi.org/10.1088/0953-8984/13/44/310
[11] Heid, R., Bohnen, K.-P. and Renker, B. (2002) Electron-Phonon Coupling and Su-perconductivity in MgB2 and Related Diborides.Advances in Solid State Physics, 42, 293-305. https://doi.org/10.1007/3-540-45618-X_23
[12] Baron, A.Q.R., Uchiyama, H., Tsutsui, S., Tanaka, Y., Ishikawa, D., John, J.P., Sut-ter, P., Lee, S., Tajima, S., Heid, R. and Bohnen, K.-P. (2007) Review: Phonon Spec-tra in Pure and Carbon Doped MgB2 by Inelastic X-Ray Scattering. Physica C: Su-perconductivity, 456, 83-91. https://doi.org/10.1016/j.physc.2007.01.028
[13] Kortus, J. (2007) Current Progress in the Theoretical Understanding of MgB2. Phy-sica C: Superconductivity, 456, 54-62. https://doi.org/10.1016/j.physc.2007.01.023
DOI: 10.4236/mnsms.2018.82002 44 Modeling and Numerical Simulation of Material Science [15] Innocenti, D., Valletta, A. and Bianconi, A. (2011) Shape Resonance at a Lifshitz
Transition for High Temperature Superconductivity in Multiband Superconduc-tors.Journal of Superconductivity and Novel Magnetism, 24, 1137-1143.
https://doi.org/10.1007/s10948-010-1096-y
[16] Clark, S.J., Segall, M.D., Pickard, C.J., Hasnip, P.J., Probert, M.I.J., Refson, K. and Payne, M.C. (2005) First Principles Methods Using CASTEP. Zeitschrift für Kris-tallographie—Crystalline Materials, 220, 567-570.
https://doi.org/10.1524/zkri.220.5.567.65075
[17] Refson, K., Tulip, P.R. and Clark, S.J. (2006) Variational Density-Functional Per-turbation Theory for Dielectrics and Lattice Dynamics. Physical Review B, 73, Ar-ticle ID: 155114. https://doi.org/10.1103/PhysRevB.73.155114
[18] Hinks, D., Claus, H. and Jorgensen, J. (2001) The Complex Nature of Superconduc-tivity in MgB2 as Revealed by the Reduced Total Isotope Effect. Nature, 411, 457-460. https://doi.org/10.1038/35078037
[19] Lee, S., Mori, H., Masui, T., Eltsev, Y., Yamamoto, A. and Tajima, S. (2001) Growth, Structure Analysis and Anisotropic Superconducting Properties of MgB2 Single Crystals. Journal of the Physical Society of Japan, 70, 2255-2258.
https://doi.org/10.1143/JPSJ.70.2255
[20] Becke, A.D. and Edgecombe, K.E. (1990) A Simple Measure of Electron Localization in Atomic and Molecular Systems. The Journal of Chemical Physics, 92, 5397-5403.
https://doi.org/10.1063/1.458517
[21] (2002) Electron Localizability. http://www2.cpfs.mpg.de/ELF/index.php
[22] Liu, A.Y., Mazin, I.I. and Kortus, J. (2001) Beyond Eliashberg Superconductivity in MgB2: Anharmonicity, Two-Phonon Scattering, and Multiple Gaps. Physical Review Letters, 87, Article ID: 087005. https://doi.org/10.1103/PhysRevLett.87.087005
[23] Kortus, J. http://www.physik.tu-freiberg.de/~kortus/kortus-research.html [24] Yildirim, T. http://www.ncnr.nist.gov/staff/taner/mgb2/
[25] Bugoslavsky, Y., Miyoshi, Y., Perkins, G., Berenov, A., Lockman, Z., MacMa-nus-Driscoll, J., Cohen, L., Caplin, A., Zhai, H. and Paranthaman, M. (2002) Struc-ture of the Superconducting Gap in MgB2 from Point-Contact Spectroscopy. Su-perconductor Science and Technology, 15, 526.
https://doi.org/10.1088/0953-2048/15/4/308
[26] Buzea, C. and Yamashita, T. (2001) Topical Review—Review of the Superconduct-ing Properties of MgB2.Superconductor Science and Technology, 14, R115-R146.
https://doi.org/10.1088/0953-2048/14/11/201
[27] Choi, H.J., Roundy, D., Sun, H., Cohen, M.L. and Louie, S.G. (2002) The Origin of the Anomalous Superconducting Properties of MgB2. Nature, 418, 758-760.
https://doi.org/10.1038/nature00898
[28] Kong, Y., Dolgov, O.V., Jepsen, O. and Andersen, O.K. (2001) Electron-Phonon In-teraction in the Normal and Superconducting States of MgB2. Physical Review B, 64, Article ID: 020501.
[29] Alarco, J.A., Talbot, P.C. and Mackinnon, I.D.R. (2014) Coherent Phonon Decay and the Boron Isotope Effect for MgB2. Physical Chemistry Chemical Physics, 16, 25386-25392. https://doi.org/10.1039/C4CP04114C
[30] Vinod, K., Kumar, R.G.A. and Syamaprasad, U. (2007) Prospects for MgB2 Super-conductors for Magnet Application. Superconductor Science and Technology, 20, R1-R13. https://doi.org/10.1088/0953-2048/20/1/R01
DOI: 10.4236/mnsms.2018.82002 45 Modeling and Numerical Simulation of Material Science Karpinski, J., Zhigadlo, N.D., Bossak, A. and Krisch, M. (2016) Non-Adiabatic Ef-fects in the Phonon Dispersion of Mg1-xAlxB2. Physical Review B, 93, 1-5.
[32] Born, M. and Oppenheimer, R. (1927) Zur Quantentheorie der Molekeln. Annalen der Physik, 389, 457-484. https://doi.org/10.1002/andp.19273892002
[33] Schutte, C.J.H. (1971) The Adiabatic Born-Oppenheimer Approximation. Quarterly Reviews, Chemical Society, 25, 393-405. https://doi.org/10.1039/QR9712500393
[34] Boeri, L., Bachelet, G.B., Cappelluti, E. and Pietronero, L. (2002) Small Fermi Ener-gy and Phonon Anharmonicity in MgB2 and Related Compounds. Physical Review B, 65, Article ID: 214501. https://doi.org/10.1103/PhysRevB.65.214501
[35] Uchiyama, H., Shen, K.M., Lee, S., Damascelli, A., Lu, D.H., Feng, D.L., Shen, Z.-X. and Tajima, S. (2002) Electronic Structure of MgB2 from Angle-Resolved Photoe-mission Spectroscopy. Physical Review Letters, 88, Article ID: 157002.
https://doi.org/10.1103/PhysRevLett.88.157002
[36] Kang, W.N., Jung, C.U., Kim, K.H., Park, M.-S., Lee, S.Y., Kim, H.-J., Choi, E.-M., Kim, K.H., Kim, M.-S. and Lee, S.-I. (2001) Hole Carrier in MgB2 Characterized by Hall Measurements. Physical Review Letters, 79, 982-984.
https://doi.org/10.1063/1.1392979
[37] Kang, W.N., Kim, H.-J., Choi, E.-M., Kim, H.J., Kim, K.H.P., Lee, H.S. and Lee, S.-I. (2002) Hall Effect in c-axis-oriented MgB2 Thin Films. Physical Review B, 65, Ar-ticle ID: 134508. https://doi.org/10.1103/PhysRevB.65.134508
[38] Suzuki, S., Higai, S.I. and Nakao, K. (2001) Two-Dimensional σ-Hole Systems in Boron Layers: A First-Principles Study on Mg1−xNaxB2 and Mg1−xAlxB2. Journal of the Physical Society of Japan, 70, 1206-1209. https://doi.org/10.1143/JPSJ.70.1206
[39] Ashcroft, N.W. and Mermin, N.D. (1976) Solid State Physics. Saunders, Philadel-phia.
[40] Calandra, M., Lazzeri, M. and Mauri, F. (2007) Review: Anharmonic and Non-Adiabatic Effects in MgB2: Implications for the Isotope Effect and Interpreta-tion of Raman Spectra. Physica C: Superconductivity, 456, 38-44.
https://doi.org/10.1016/j.physc.2007.01.021
[41] Bardeen, J. (1951) Electro-Vibration Interactions and Superconductivity. Reviews of Modern Physics, 23, 261-270. https://doi.org/10.1103/RevModPhys.23.261
[42] de la Penha, O., Aguayo, A. and de Coss, R. (2002) Effects of Al Doping on the Structural and Electronic Properties of Mg1−xAlxB2. Physical Review B, 66, Article ID: 012511.
[43] Bianconi, A. (2005) Feshbach Shape Resonance in Multiband Superconductivity in Heterostructures. Journal of Superconductivity, 18, 626-636.
https://doi.org/10.1007/s10948-005-0047-5
[44] Johannes, M.D. and Mazin, I.I. (2008) Fermi Surface Nesting and the Origin of Charge Density Waves in Metals. Physical Review B, 77, Article ID: 165135.
https://doi.org/10.1103/PhysRevB.77.165135
[45] Jorgensen, J.D., Hinks, D.G. and Short, S. (2001) Lattice Properties of MgB2 versus Temperature and Pressure. Physical Review B, 63, Article ID: 224522.
[46] Lortz, R., Wang, Y., Abe, S., Meingast, C., Paderno, Y.B., Filippov, V. and Junod, A. (2005) Specific Heat, Magnetic Susceptibility, Resistivity and Thermal Expansion of the Superconductor ZrB12. Physical Review B, 72, Article ID: 024547.
https://doi.org/10.1103/PhysRevB.72.024547
DOI: 10.4236/mnsms.2018.82002 46 Modeling and Numerical Simulation of Material Science the Thermal Characteristics of MgB2. Journal of Experimental and Theoretical Physics, 97, 70-77. https://doi.org/10.1134/1.1600798
[48] Shi, L., Zhang, H., Chen, L. and Feng, Y. (2004) The Raman Spectrum and Lattice Parameters of MgB2 as a Function of Temperature.Journal of Physics: Condensed Matter, 16, 6541-6550. https://doi.org/10.1088/0953-8984/16/36/019
[49] Wu, S.Y., Shih, P.-H., Ji, J.-Y., Chan, T.-S. and Yang, C.C. (2016) Direct Observa-tion of Charge Re-DistribuObserva-tion in a MgB2 Superconductor.Superconductor Science and Technology, 29, Article ID: 045001.