Discovering Performance Evaluation Features of faculty
Members using Data Mining Techniques to Support
Decision Making
Amani M. Ghazzawi
King Abdulaziz University Jeddah
Saudi Arabia
Faculty of Business Administration, Taif University, Taif
Shaimaa Salama
King Abdulaziz University Jeddah
Saudi Arabia
Faculty of computers & AI, Helwan University, Egypt
ABSTRACT
Human resources in organizations need to understand their employees and know the factors that influence their performance and behavior to help them in decision-making. Factors affecting employee performance may differ depending on the environment, whether in business or educational sector. The use of data mining technology is an effective tool in analyzing the characteristics of staff and evaluating them to support decision-making. This paper proposes a model based on data mining in educational sector to understand the factors that affect faculty members performance. Based on selected attributes, K-means algorithm is applied to group faculty members into clusters with similar characteristics and the appropriate decision is specified for each cluster. Based on the resulted decisions for each cluster, a classification algorithm is applied to predict the decision needs to be taken for coming staff.
Keywords
Data mining, clustering, classification, faculty members, human resource, decision making.
1.
INTRODUCTION
Human resources management is intended to regulate and control all activities, practices and policies related to the selection, development, training, appointment, care and reward of employees to accomplish organizational objectives [1]. Each organization needs to make a regular evaluation of its employees` performance in achieving organization's objectives and to know the level of their competence and efficiency. Therefore, it was necessary to provide the managers with tools to help them Evaluate their employees and make decisions about them
The objective of data mining depends on analyzing the relationships and patterns in huge amounts of data, through using methods from the fields of statistics, computer science, and artificial intelligence [2]. Data mining tasks (DM) are separated into two groups; predictive tasks and descriptive tasks. Predictive tasks depend on a set of valuable data that is used to predict behavior and other objects in the future. While the descriptive task depends on clearly describing the data, summarizing the properties for target data and finding the rules of associations and patterns [3].
In general, data mining is an advanced area that contributes to solving administrative and educational problems [4]. Research contributions to the applications of data mining in education
Mining EDM"[5]. The term "EDM" refers to the tools that are used to get educational information then analyze and obtain results. This technique "EDM" is useful in many areas such as evaluation of teacher performance, student performance assessment, identifying education needs and curriculum improvement [6].
More recently, research contributions have relied data mining for human resource management activities such as employee selection, performance evaluation, assurance of work efficiency and predicting of staff turnover [7]. This study uses of data mining as a tool for analyzing human resources data and to evaluate employees’ performance in order to help organizations make decisions concerning their employees. To achieve this aim, a model based on clustering and classification techniques is proposed. Appropriate attributes that affect faculty members performance are identified, then faculty members are clusters into groups with same characteristics using k-means algorithm. Each cluster is analyzed to get up with appropriate decision. At the end, classification algorithm is applied to predict suitable decisions for faculty staff depending on specified attributes. The proposed model will help human resources management predict future decisions for new faculty member. The rest of this paper is organized as follows: section 1 presents the literature review, section 2 introduces the model and mythology, section 3 shows evaluation and discussion of results and section 4 concludes the paper and proposes future work to extend this research.
2.
LITERATURE REVIEW
The literature review dates from 2013 to 2018 and discusses the use of data mining to evaluate the performance of employee in field of business and education. To measure employee’s performance, researchers have used different data mining algorithms. In the business sector, previous studies have been based on assessing employee performance to decide on promotions, performance correction and put the right person in the right place.
26 most accurate technique. As researchers pointed out that age
has no effect, but the training attribute had revealed an insignificant effect on the performance of the employees. ALDaher [10], proposed an intelligent decision support prototype for human resource management to predict employee performance, based on classification technique (Nearest Neighbor, Network Neural, and Decision Tree). Features included personal data, skills and degree of assessment. The results showed that the accuracy of the classifications ranged from 70% to 80%, where the decision tree and Nearest Neighbor obtained the highest accuracy between the results.
Researchers in the education sector have focused on the evaluation the performance of teachers to give the necessary recommendations and raise their competence.
Zaheng et al [11] , proposed a model three indicators for clustering of the teachers (individual background - course content - teaching method) by using K- means algorithm. Statistics showed that gender and age are effective attribute to the assessment of the students. Young male teachers got higher degree in student assessment. The Asanbe et al [4], study provided an effective model to predict teachers’ performance in higher education. The most contributing attributes to the performance of teachers are working experience and rank. The study showed that decision tree C4.5 got accuracy of (83.5%). The study of Agaoglu [12], aims to predict the performance of the trainer through students evaluation. Findings of the analysis pointed that the best technique in terms of accuracy and quality was the “C5.0”, where it achieved a level of accuracy of 90%. While Ramla and Ramsh [13], provided a model for predicting teacher performance and correcting the transfer of knowledge in programming courses. The study depended on the basic information for the teachers and the comments of students. Algorithm of (SVM) was used and obtained (93%) accuracy. In this study, Hamid and Alaa [14], relied on examining the factors that influence teachers' performance evaluation to predict the training course of the teacher and achieve the highest level of quality in performance. The study included academic qualifications, experience and courses held by teachers. By applying K-NN classifier, they obtained a 79.92% accuracy. The Related works reviewed the papers that used data mining to evaluate the performance of employees and help HR to make the right decisions in the commercial and educational sector. Most of these studies lack the following:
- Need more features to give more accuracy to predict the appropriate decision, where the highest accuracy in these studies was 93%.
- More evaluation criteria for faculty staff since most of the evaluation is done based on student evaluation only.
3.
METHODOLOGY
The aim of this study is to identify the attributes that affect the performance of faculty staff and then categorize faculty staff into groups with similar characteristics to make better decisions for each group to obtain better educational results. The data were analyzed using the clustering technique through the K - means algorithm. This work contributes to the discovery of the features that help divide faculty members into groups for analysis, and then put the appropriate decision for each group. Consequently, human resources management makes it easier to predict the appropriate decision for new staff based on their characteristics.
3.1
Data description
The data set contains 5820 records. Each record represents one faculty members (Lecturer Assistant - Lecturer - Assistant Professor - Associate Professor) from Gaze University in Ankara (Turkey). They were assessed by students, supervisor and HR. The data set contains students’ answers on 28 questions which were used to evaluate faculty staff. It also contains two attributes for supervisor and HR assessment. There were 23 attributes that included personal data and academic information for the faculty member. The software used for analysis and prediction is Rapid Miner version 9.2. The data set was divided into two separate groups, the first set includes a dataset of lecturers, lecturer assistants and the second dataset includes associate professors and assistant professors. The study applied the clustering then classification techniques on the two sets of data separately.
3.2
Proposed Model
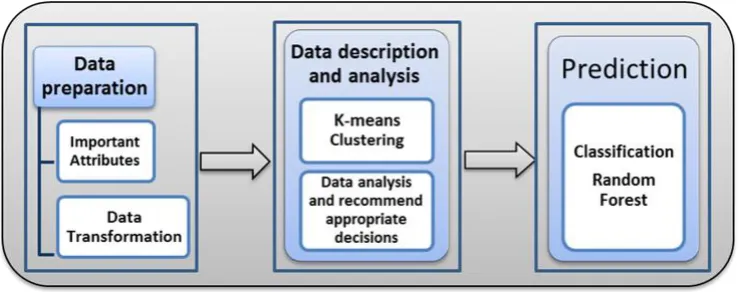
[image:2.595.126.499.568.714.2]The proposed model consists of three stages as illustrated in figure 1. In the pre-processing stage, the data is processed and then the important features of the study are selected. In the data description and analysis phase, the clustering technique is used with the K-means algorithm to divide faculty members into similar groups in characteristics. Each group is analyzed to identify the appropriate decision for it. Followed by the stage of predicting appropriate decisions identified previously for new faculty members based on their characteristic using Random forest algorithm.
3.3
Data Preprocessing
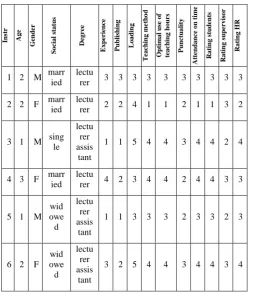
[image:3.595.42.304.311.610.2]This phase includes the choice of important attributes for the study and the removal of insignificant ones. Then convert nominal attributes to numeric. There were 28 questions answered by students about faculty members. 11 questions were selected and 9 of them were merged under one feature called teaching skills and two questions were placed independently in the database named: Optimal use of teaching hours, Attendance on time .The remaining 17 questions were deleted because they were not important in evaluating of the faculty members. In addition, some attributes have been deleted because they didn’t affect the study on staff performance like(university, Specialization, Languages, difficulty of course). Part of the dataset is illustrated in table 1. It is the dataset of lecturer and assistant lecturer. The data set was divided into two parts to analyze each separately: firstly: lecturer assistant and lecturer and secondly: assistant professor and associate professor. The data set of assistant professor and associate professor contains an additional feature which is the number of supervisions of thesis.
Table 1. The dataset of lecturer assistant and lecturer
In st r Age Gend er S oc ial s tat u s De gr ee E xp er ience P u b li sh in g L oad in g T eac h in g m e th o d Op ti m al u se of te ac h in g h ou rs P u n ct u a li ty At te n d an ce on t im e Rat in g st u d en ts Rat in g su p er vis or Rat in g HR
1 2 M marr ied
lectu
rer 3 3 3 3 3 3 3 3 3 3
2 2 F marr ied
lectu
rer 2 2 4 1 1 2 1 1 3 2
3 1 M sing le
lectu rer assis tant
1 1 5 4 4 3 4 4 2 4
4 3 F marr ied
lectu
rer 4 2 3 4 4 2 4 4 3 3
5 1 M wid owe d lectu rer assis tant
1 1 3 3 3 2 3 3 2 3
6 2 F wid owe d lectu rer assis tant
3 2 5 4 4 3 4 4 3 4
The attributes considered for the analysis of staff performance as illustrated in table 2 are: age, gender, social status, academic qualification, Experience, the number of supervision of thesis, the number of published researches, the number of teaching hours, teaching skills , optimal use of teaching hours, attendance on time, punctuality, rating of students, rating of supervisor, rating of human resources.
Table 2. Attribute Information
Classification Attribute Variable format
Personal
information
ID 1,2,3…
Age {1,2,3,4} for age<25, age[25-35], age[35-45], age>45
Gender female and male
Social status single, married, widowed, divorced Education & Experiences of lecturer Academic qualification
lecturer assistant, lecturer, associated professor and
assistant professor
Experience
{1,2,3,4,5}for Exp<2, Exp<[3-7], Exp[8-12], Exp[13-1Exp<[3-7],
Exp>18
The number of supervision
of thesis
{1,2,3,4,5} for N.s=0, N.s<5, N.s[6-9], N.s[10-14], N.s>15
The number of published researches
{1,2,3,4,5} for Pub=0, Pub<4, Pub[5-9], Pub[10-17] , Pub>18
The number of teaching
hours
{1,2,3,4,5} for L<8, L<[9-12], L [13-16], L[17-21], L>22
Teaching skills
{1,2,3,4,5} 1 very poor, 2 poor, 3 reasonable, 4 good, 5 very
good Optimal use of teaching hours Attendance on time Punctuality Assessment of lecturer Rating of students Rating of supervisor Rating of human resources
4.
DATA DESCRIPTION AND
ANALYSIS
28
4.1
Cluster analysis and recommended
decisions
As a result of applying k-means algorithm on the two data sets, the data was divided into 3 groups. Each group for each data set was analyzed and decision was suggested based on the characteristics of each group.
In the lecturer and lecturer assistant database, the decisions included:
- Sending a group of faculty members to a scholarship for their excellence.
- for group that has low assessment, training is required to enhance their performance
- Attend workshops that support the writing of scientific research.
In the Associate Professor and Assistant Professor database, the decisions included:
- Honoring outstanding faculty members.
- Granting training to a group of members.
- Encouraging to increase scientific research, this group has low scientific production.
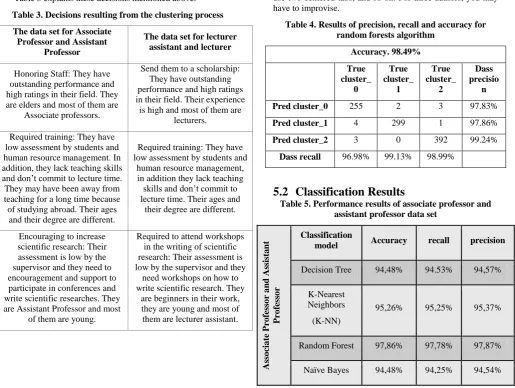
Table 3 explains these decisions mentioned above:
Table 3. Decisions resulting from the clustering process
The data set for Associate Professor and Assistant
Professor
The data set for lecturer assistant and lecturer
Honoring Staff: They have outstanding performance and high ratings in their field. They are elders and most of them are
Associate professors.
Send them to a scholarship: They have outstanding performance and high ratings in their field. Their experience
is high and most of them are lecturers.
Required training: They have low assessment by students and human resource management. In addition, they lack teaching skills and don’t commit to lecture time. They may have been away from teaching for a long time because of studying abroad. Their ages
and their degree are different.
Required training: They have low assessment by students and
human resource management, in addition they lack teaching skills and don’t commit to lecture time. Their ages and
their degree are different.
Encouraging to increase scientific research: Their assessment is low by the supervisor and they need to encouragement and support to participate in conferences and write scientific researches. They are Assistant Professor and most
of them are young.
Required to attend workshops in the writing of scientific research: Their assessment is low by the supervisor and they
need workshops on how to write scientific research. They
are beginners in their work, they are young and most of them are lecturer assistant.
5.
PREDICTION
The next step in the proposed model is the classification. The input feature space is the characteristics of the faculty member. The space of the output feature is the decision taken in the previous step based on the characteristics given. The classification applied with four algorithms: Naïve Bayes, K-Nearest Neighbors (K-NN), Random forest, and decision tree. A comparative analysis of the performance of the 4 algorithms was carried out..
5.1
Evaluation of classification algorithm
The data set was split into two, 70% was used for training and 30% was used for validation. 10-fold cross validation was used to estimate the accuracy of the model. The study used three measures to compare the performance of the classification models, which are: precision, recall and accuracy given by the equations below respectively:
Precision= True positive /(True positive+ False positive) (1) Recall= True Positive/(True positive+ False negative) (2) Accuracy= (True positive+ True negative)/(TP+TN+FP+FN) (3)
Table 4 shows precision, recall and accuracy resulting from the random forest algorithm for the lecturer's assistant and lecturer data set: of this page for three addresses. If only one address is needed, center all address text. For two addresses, use two centered tabs, and so on. For three authors, you may have to improvise.
Table 4. Results of precision, recall and accuracy for random forests algorithm
Accuracy. 98.49%
True cluster_
0
True cluster_
1
True cluster_
2
Dass precisio
n
Pred cluster_0 255 2 3 97.83%
Pred cluster_1 4 299 1 97.86%
Pred cluster_2 3 0 392 99.24%
Dass recall 96.98% 99.13% 98.99%
5.2
Classification Results
Table 5. Performance results of associate professor and assistant professor data set
precision recall
Accuracy Classification
model
As
so
cia
te
Pro
fe
ss
o
r
a
n
d
As
sista
n
t
Pro
fe
ss
o
r
94,57% 94.53%
94,48% Decision Tree
95,37% 95,25%
95,26% K-Nearest
Neighbors
(K-NN)
97,87% 97,78%
97,86% Random Forest
94,54% 94,25%
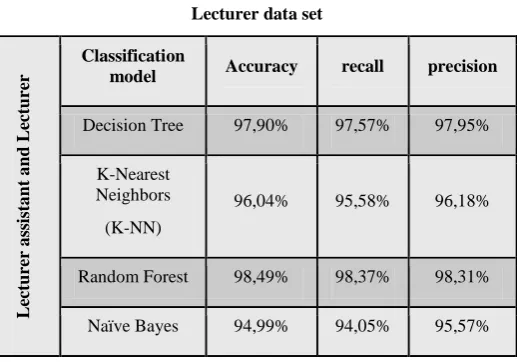
[image:4.595.42.558.347.735.2]Table 6. Performance results of Lecturer assistant and Lecturer data set
precision recall
Accuracy Classification
model
Le
ctu
re
r
a
ss
ista
n
t
a
n
d
Le
ctu
re
r
97,95% 97,57%
97,90% Decision Tree
96,18% 95,58%
96,04% K-Nearest
Neighbors
(K-NN)
98,31% 98,37%
98,49% Random Forest
95,57% 94,05%
94,99% Naïve Bayes
The table 5 and 6 indicate that random forest algorithm gives high accuracy compared to other algorithms. It is the best from the other algorithms because of its modus operandi. It depends on a decision taken based on a set of decision trees that produce a lower error rate with reasonable drawbacks. In addition, the random forest deals with numerical and nominal values and is characterized by its speed in calculation and its predictive power, so it is suitable for this study.
6.
CONCLUSION AND FUTURE WORK
This study proposed a model contributed to the discovery of the characteristics on which the assessment of the faculty member in the universities is done. The research pointed out personal information and individual skills in evaluating of the faculty members, as well as evaluating them from several different perspectives (student evaluation, supervisor evaluation and HR evaluation). The model used a mix up of a clustering and classification techniques to be able to cluster staff into groups with similar characteristics using K-means algorithm. The study found no effect of gender and social status on the accuracy of cluster, while some previous studies indicated their impact on the assessment of faculty members. Each group was analyzed to indicate the suitable decision for it to help HR enhance the staff performance. Then, classification technique is applied to help HR to predict the suitable decision identified before in the clustering step for newcomers depending on the specified characteristics by the study. By applied the classification technique with using random forests algorithm, the study achieved high accuracy was 97.86% for the associate professor and assistant professor data set and 98.49% for lecturers and lecturer assistant data set.
The study indicated some areas of improvement that could be applied in the future. The features used for analysis may be extracted automatically without human intervention. Also, it is recommended to use another algorithm in the clustering phase and compare the results with those of k-means.
7.
ACKNOWELDGMENT
Special thanks to Dr. Basma Al-Harbi from the University of Jeddah who supported the researcher in the Rapid Miner program.
8.
REFERENCES
[1] Schuler, R.S. and MacMillan, I.C., 1984. Gaining competitive advantage through human resource management practices. Human Resource Management, 23(3), pp.241-255.
[2] Bajo Rouvinen, A. (2017). Data Mining Thesis Topics in Finland, Helsinki Metropolia University of Applied Sciences.
[3] NIAKŠU, O. (2015). DEVELOPMENT AND APPLICATION OF DATA MINING METHODS IN MEDICAL DIAGNOSTICS AND HEALTHCARE MANAGEMENT. Doctoral Dissertation, Vilnius University.
[4] Asanbe, M.O., Osofisan, A.O. and William, W.F., 2016. Teachers’ Performance Evaluation in Higher Educational Institution using Data Mining Technique. International Journals of Applied Information System (IJAIS) Volume, 10, pp.10-15.
[5] Fayyad, U., Piatetsky-Shapiro, G. and Smyth, P., 1996. From data mining to knowledge discovery in databases. AI magazine, 17(3), pp.37-37.
[6] Algarni, A., 2016. Data mining in education. International Journal of Advanced Computer Science and Applications, 7(6), pp.456-461.
[7] Strohmeier, S. and Piazza, F., 2013. Domain driven data mining in human resource management: A review of current research. Expert Systems with Applications, 40(7), pp.2410-2420.
[8] Anzanello, M., Fernandes, A. and Tortorella, G., 2017. AGRUPAMENTO DE FUNCIONÁRIOS BASEADO NO BIG FIVE MODEL EM UM PROJETO DE FRANQUIA DE ACADEMIAS. Iberoamerican Journal of Project Management, 8(1), pp.1-21.
[9] Kirimi, J.M. and Moturi, C.A., 2016. Application of Data Mining Classification in Employee Performance Prediction. International Journal of Computer Applications (0975-8887), 146(7).
[10] AL-Daher, J. (2014). Design An Intelligent Decision Support System Prototype for Human Resources Management. Syrian Virtual University, Syria.