ISSN Online: 2329-3292 ISSN Print: 2329-3284
DOI: 10.4236/ojbm.2018.63048 Jun. 22, 2018 632 Open Journal of Business and Management
Combination Method between Fuzzy Logic and
Neural Network Models to Predict Amman
Stock Exchange
Mohammad M. Alalaya
1, Hani A. Al Rawashdeh
2, Ahmad Alkhateb
31Economics and Quantitative Methods, College of Administrative and Economics, Al-Hussein Bin Talal University, Ma’an, Jordan
2Mechanical Engineering Department, Engineering Faculty, College of Administrative and Economics, Al-Hussein Bin Talal
University, Ma’an, Jordan
3Accounting Department, College of Administrative and Economics, Al-Hussein Bin Talal University, Ma’an, Jordan
Abstract
The purpose of this paper is to consider the potential in the projection of Fuzzy logic and Neural networks, also to make some combination between models to address implementation issues in the prediction of index and prices for Amman stock exchange in different models, where the previous research-ers have to demonstrate the differences between these measures. We have used in this research Amman stock Exchange index prices data as a sample set to compare the different application models, where predicting the stock mar-ket was very difficult since it depends on nonstationary financial data, in addi-tion to the most of the models are nonlinear systems. These papers draw an existing academic and practitioner in literature review as a combination of these models and compare them, the facilities of the development of concep-tual methods and the research proposition are the basis for serving this com-bination. Hence, the present and recent papers can serve the further ers into addressing contemporary barriers in the direction of these research-ers. The authors show in this paper the Fuzzy logic and Neural networks, in addition to time series analysis through these models, utilized of RSI, OS, MACD, and OBV, then using MSE, MAPE, and RMSE. The research implica-tion represents of too much data for the period of study, also this paper is conceptual in its nature, the paper highlights in finding that the implementa-tion challenges, and how these challenges can facilitate the trader decision in the stock market. The results of the analysis show that the ANFIS is the better model to achieve prediction of stock market more than others. When are MAPE and RMSE the best more than simulating the errors in other methods? Also the fuzzy-neural models as the results of table show that more prominent in fuzzy-neural models ,while it appears that in MSE as medium, MAD posses How to cite this paper: Alalaya, M.M., Al
Rawashdeh, H.A. and Alkhateb, A. (2018) Combination Method between Fuzzy Logic and Neural Network Models to Predict Amman Stock Exchange. Open Journal of Business and Management, 6, 632-650. https://doi.org/10.4236/ojbm.2018.63048
Received: January 26, 2018 Accepted: June 19, 2018 Published: June 22, 2018
Copyright © 2018 by authors and Scientific Research Publishing Inc. This work is licensed under the Creative Commons Attribution International License (CC BY 4.0).
DOI: 10.4236/ojbm.2018.63048 633 Open Journal of Business and Management less amount than other models in all table testing fuzzy-neural models, there-fore, it becomes superior in stock prediction.
Keywords
MAPE, MACD, Fuzzy Logic, Neural Network, Time Series, ASE, Wavelet ANFIS
1. Introduction
1.1. Objectives of the Study
The purpose of this study has been proposed to find the extent which is the hy-brids of the different technologies, which have been used to develop market forecast and trading rule, and implement these technologies in prediction of stock markets, in our paper we combine methods to have the accuracy predic-tion, and we have utilized from this method to predict Amman Stock Exchange index and trading volume, based on these methods and compare the outputs of these different models results in order to leverage the best result model, to be used in forecasting in future, as important tools, hence, to learn capabilities of Fuzzy modeling which has required big computational effort, to improve the prediction process efficiency, where subtractive clustering algorithm is used to have the computational advantages, but in this paper, we are searching this me-thod, the Fuzzy rules are formally using, and stamp the work.
1.2. Problem Statement and Limitations
The stock market is important for trader and companies in both long-term and short-run investments due to its attractiveness for profit making. For the trader, it provides a good place for profit-making, but it is very risky, there-fore, their decision is critical, and must be taken correctly and at the right time, hence, the experience shows that high profits are in other hand which is very risky implication, which should be filtered in order to have good financial decision, thus this process needs to develop models where traders can identify and state one of these in use. So far, this paper proposes to have simple infe-rence indicator models, to simplify the complicity to the stock market envi-ronment, therefore, the paper takes account of this field Fuzzy Logic and dual time series to perform among the compression good decisions in trading the stock assets.
DOI: 10.4236/ojbm.2018.63048 634 Open Journal of Business and Management combination techniques which used in this paper, and the empirical results. Sec-tion six is concluded the results of the study and gives a brief conclusion in order to simplify the computations of fuzzy time series.
2. Literature Review
2.1. Recent Studies
According to its high profits, stock market expected returns, where the trading process in this field is very risky, due to the decision which related to process in stock trading, it is an important process and very critical, because it must be a decision should be in a correct and on the right time. Therefore from the recent investment experience showed that the higher risk accompanied with higher ex-pected returns [1].
Many models have been used in recent studies, and some of them have been developed over the years, in order to understand, also to have the accurate pre-diction of the stock market, some of them belong to the stochastic models; such as Garch, Arch, and volatility models [2]. Also many various artificial intelli-gence techniques as the models which used by [3], another researcher as [4], have environment, their study based on inputs from technical analysis [5], em-ployed in his research an exchange rate forecasting model, depends on wavelet transform time series analysis to predict the stock market, it seems that Chan. T on his study based on multi scale wavelet decomposition to provide the applica-tion of Fuzzy models [6] compare in this study the results of his analysis by the application of the Neural network, Garch-m model, E-Garch model.
Fuzzy logic model is derived from Fuzzy set theory and the main purpose aims of how to deal with imprecise information which provides a mechanism for the decision system, and this model manipulating imprecise concepts for the analyzed process. The network will produce three cases of outputs; buy, or sell a stock or keep. This based on the information which serves the indicator. The Fuzzy set theory was introduced by [7] [8], when the questions cannot be solved by the two-valued logic of traditional set theory, therefore it differs from the tra-ditional theory. The solution can be reached by using membership function in Fuzzy logic, the Fuzzy set theory has been used in many fields as a control theory, decision analysis, artificial intelligence, management, and economics.
The Fuzzy set used to capture uncertainty and vagueness work in our day to day ventures, Where time-series models have utilized the Fuzzy set theory to solve various domain forecasting problems, therefore in this study we utilized of the Fuzzy dual-factor time series to forecasting ASE index returns as a part of this paper, also the future trading volume as a determinant of prices in different momentum phases.
DOI: 10.4236/ojbm.2018.63048 635 Open Journal of Business and Management ([9] [10]), saw that much Fuzzy logic and genetic algorithms significantly im-prove the analysis methods; they built their opinion according to these technol-ogies are for the most part complementary and synergistic, in the same time that they are complementary, follows from the observations and use neural networks for market forecasting, and used for curve fitting. Were Fuzzy-logic deals with imprecision and uncertainty, and genetic algorithms are used to reach the opti-mization, many numerous facts about Fuzzy logic and market forecasting and trading rules with applications, and merging the technologies which allow for exploitation for tolerance for imprecision , the partial truth is to achieve tracta-bility, low solution cost, and robustness.
[11] applied the neuro-Fuzzy model to predict future values of the largest government-owned bank, he used the profitability ratios (R.O.A. R.O.E, and P. E, with the closing prices for the current prior three months. then he compared the output of the model of Fuzzy logic with basic back propagation algorithm. He concluded that the neuro-Fuzzy model was able to recognize the general characteristics of the stock market better than the back propagation algorithm [12], utilized of neural network modified to predict the stock price index, the method used aimed to use globally searched future dieselization to reduce the dimensionally of future space, mitigate the limitations gradient descent, and il-luminates irrelevant factors.
Neural network used by [13], their paper aimed to predict Istanbul stock ex-change market index value, in their method they have investigated the index by different methods of neural network, in their study they have shown that prefe-rence of neural network, and finally that this model can let one ahead in forecast-ing stock prices. Stock market prediction models usually belong to two categories. Fundamentals annual analysis involves global economic conditions, such as budg-et, company information, conditions as environments around the stock markbudg-et, where technical analysis involves technical indicators like William-R%, MACD, RSI, The stock status can be classified by fuzzy logic, neural network, and SVM.
Many methods can be used to predict stock exchange index or prices, [14] de-cided that neural network has emerged as one of these tools to predict the mar-ket, the aim of this is critical to analyze the alternative tools which are based on the neural network. This can be fluctuation to the investor belief, where the stock indices are chaotic in its nature. The stock market index represents the di-rectional movement of the economy, and to predict stock indices, this process requires ample information about the nitty-gritty of the market happing.
[15] has decided on his research that many findings are of an on-going project, he used neural network modeling and learning techniques to search for and decode non-linear regularities in asset price movements. Where [16], Used Markov models approach to forecast the financial market; these models are used to recognize the pattern of a dynamic financial system.
DOI: 10.4236/ojbm.2018.63048 636 Open Journal of Business and Management
2.2. Fuzzy Times Series and Fuzzy Logic
In fuzzy time series models, one factor to forecast enrollment is simplified the complex problem, but not give good and accuracy time series forecasting, mul-tiple factors can be used to derive better performance. In this research to have more accuracy performance of forecasting for Amman stock exchange, we fol-low the [18], which proposed by using two factors which influence the future stock index, instead of trading volume [19], used the following equation:
( )
( )
( )
1 1
1
n n
up Downimp
i i
n i
V V t V
VR t
V t
= =
=
− −
=
∑
∑
∑
(1)where: VR(t): Stock trading volume. Vup: the trading volume when stock index
closes up. VDownimp: the trading volume when stock index closes down. In this
model, we have two factors separately integrated the process by a dual factor li-near forecasting equation. The dual factor is:
( )t1
(
vr t( ) ( )t ( )t1 ( )t ( )t1)
VR + = +a M L ∗I + ∗b forecast + −I +I + (2)
In main summarized for this model by [20], this leads to detailed by the algo-rithm. The dual factor forecast in proposed by [20].
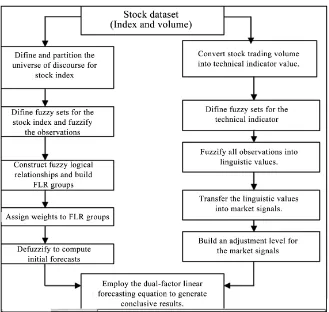
Below diagram shows how the forecasting processes through fuzzy dual time series, Figure 1. According to Song and Chisoms model which consist of six steps, first step is to define the partition of universe of discourse, second step is to define the fuzzy set for the observation, where the fifth step is forecast and sixth step is defuzzify forecast result. This fuzzy time series model employ one factor to forecast enrolment, to improve the forecasting process as shown in Figure 1, the two forecasting factors which proposed by [21], instead of stock trading volume ,we use technical analysis indicator of stock trading volume ,in this figure two forecasting approach to deal with the two forecast factor sepa-rately linear forecasting. In general we crystallize the proposed model in to de-tailed algorithm.
In this paper, the application we have used financial date set from Amman stock exchange forecast where (t) represent the stock index; forecast (t + 1),
LVR(t) is the value of the indicator. Where: (b) is an adjustment parameter
represents the initial forecast based on the stock index. a is the initial forecast based on technical analysis indicator, and M is a signal transferring function.
2.3. Network Architecture
DOI: 10.4236/ojbm.2018.63048 637 Open Journal of Business and Management
Figure 1. Forecasting processes through fuzzy duality time series. Source: Application of
Fuzzy-neural networks in multi-ahead forecast of stock price, Gholamreza Jandaghi. African Journal of Business Management Vol. 4(6), pp. 903-914.
In fuzzy-neural network there is no specific limitation pattern for the estima-tion parameters, model can be specified by learning and form the new member-ship functions formation of non-linear model can be caused by modification, which carried out in input membership function:, Figure 2 shows the member function input.
When using technical analysis for prediction of stock values some assumption should be considered:
Some say that history repeats itself.
Price move and able to have the tendency to go with trend not against. It supposes that market moves in trends.
The movement of the prices depends on the momentum of the trend move-ment.
DOI: 10.4236/ojbm.2018.63048 638 Open Journal of Business and Management
Figure 2. Membership function input of ASE. Source: Author
calculation and drown, using Mat Lab.
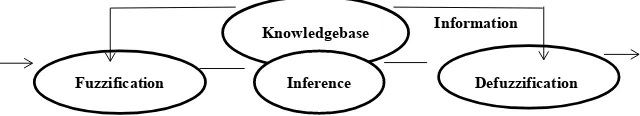
Figure 3. Fuzzy inference systems. Source: Ashwini. A. Mate. I. P. Keswani. Journal of
Engineering Research and Applications,Vol4, issue 7, pp.105,2014.
There was limitation of neural network on forecasting; such as:
1) With a large amount of data, there is back propagation of neural networks which can take a long time to train this data.
2) Arima model cannot support stationary of time series data.
3) The archiving data mining technique achieving the highest confidence up to 70%.
4) Neural network functions are block box function and results are unstable. 5) Operation rules of the neural network are unknown.
2.4. Measurements
Enhance; the model should be proposed the methodology with a hidden Markov model or fuzzy logic to improve the accuracy and effectiveness of the stock market price movement where the problem of the fuzzy system is of eliciting IF then rules from a raw input and output data. Two steps are proceeds for this:
A: Specification of output relations IF.
B: Clustering algorithm which used to recognized and categorized data also model construction and used for data comparison.
The subtractive clustering is a good technique for generating fuzzy inference systems which drawn up, by detecting clusters in input-output trading data. In cluster, the data point is estimated depends on the distance of this data point potential which can be measured as:
Knowledgebase
Inference Defuzzification
Fuzzification
[image:7.595.212.532.306.364.2]DOI: 10.4236/ojbm.2018.63048 639 Open Journal of Business and Management
2
n a
i i i j
P = te− X −X
∑
(3)where a 4 .2 r
=
Xi = represent ith data point, Ra is the vector consists of positive constant, and
it is the types sphere cluster radius in data space. C: Stochastic oscillator (SO):
This indicator indicates to the relation between the stock last closing price and to the stocks trading, it plotted with a range of 0 to 100, the overbought condi-tion decided by this indicator about 80 and oversold analysis this indicator con-tains two variable as follows:
(
)
3( )
% % , 3
3 n
n
K not
D mot =
∑
− n≥ (4)( )
( )
( )
( )
% 100
max min
R ent R not K int
R not R t
−
= ⋅
− (5)
where: %D is the moving average of %K used to formulate the idea of the mo-mentum, Rmax(not) represented the momentum down the trading period, and
Rmin(nt) is the momentum down the trading period. When Stochastic oscillator increases above 80, then sell should be, if (SO) lied between 20 - 80 Which im-plies normal state then should and when 80 below 20 implied oversold then by.
D: On-Balance Volume (OBV):
This measurement tool reflects the movement in the volume of stocks. It is calculated by total volume for the trading period and assigning it whether posi-tive or negaposi-tive there are 4 cases of measurement as:
When prices today’s close is greater Than yesterday close then: OB V = yesterday – Today’s volume.
When today close is equal to yesterday then:
OB V = yesterday’s OB V results of this indicator of trading rules can be de-termined as following:
- If the line is down warded then sell.
- And when the line is upward then bay finally the MACD indicators use in long-term 26 weeks data and in short-run 12 weeks.
The fuzzy rules are a combination of the rules the 4 indicators combination also extracted from the expert from the trading expert; as:
When MACD is high and Rsi low and so is low and O B V is high then buy if MACD is low RSI is high and so is high and O B V is low then buy. When MACD is low, RSI is med so is high and O B V is low then sells.
2.5. Causality in Stock Markets
DOI: 10.4236/ojbm.2018.63048 640 Open Journal of Business and Management which contains a mutual influencing factors. The functional form of causality:
1
t jt
T =
∑
Vt− +∑
bjt j ui− + (6)1 1
vt livt= − +
∑
kjt− +ut (7) where: Vt: represents the future trading volume, Ii is the future index of the stockmarket.
3. Methodology and Data
The data collection from previous record of Amman stock exchange of financial and banking sector for the period under investigation, the major variable of this study used as a time series of prices of stock exchange, from reports of ASE and central bank of Jordan, for exogenous variables in the study both previous records and stock market indexes which from 1/2010 to 12/2016 with record da-ta 265.
The purpose of this study is to predict Amman stock exchange stock price through index and trading volume, which has the most influential factor in (A S E), enhance; we use the classical statistical methods the artificial intelligence model to simulate the results of interaction s through those influential variables. We use the fuzzy neural network to simulate the complex interactions in stock’s environment. Figure 4 illustrates this idea.
The external Factors and the internal factors are determined beyond the management process of the stock market the efficiency of the stock market, also are can call these influential factors, and the stock market environment which affected the efficiency of the stock market. We can obtain the information of stock market from records of this market which comes from relevant data. Also in this paper, we have categorized the data into four major categories. The first type is the technical data which included data which refers to the stock market: The volume of shares traded per day.
The closing prices at the end of the day.
[image:9.595.231.509.543.684.2] The highest and lowest prices of the trading day.
Figure 4. The conceptual framework of the research. Source: Gholamreza
DOI: 10.4236/ojbm.2018.63048 641 Open Journal of Business and Management 907.
The second type is the derived data which comes from combining and trans-forming technical, or the third type of data is the fundamental data, such as returns which can be expressed as:
1
vt yt i Rt
y t
− −
=
− (8)
The third type of data is fundamental which related to the interstice value of category the fundamental data category included:
Trade balance.
Indexes of industries and companies. Interest rates.
Net profit margin.
4. The Models of the Study
4.1. The Time Series Model
When we matched the time Series and the pattern templates, we can through this method identifying the existing of Elliott waves, this method proposed by ([18]). In their method, the amplitude-distance between two points can be per-formed as:
(
,)
1 nn1 1(
)
2AD SpA Cp =
∑
− Mk− SAn EA+ (9)where: (A, C) are listed in the point in the time series and templates, SpA, CPA are considered as (P1PS) in P.
This proffered to be considered as horizontal distortions of pattern against templates, and the temporal distance can be performed us (TD):
(
,)
1 n1 21(
)
2n
TD SpA Cp =
∑
−k= SpA LA+ (10)The SPTA and CTA: represents the time coordinate of the sequence points. Other models such as; Black-Litter man studied the active portfolios with views.
The Black-Letterman optimized portfolios, resembling portfolios of real mar-ket participants. Type four is the volatility and stability and government policies which measure the risk of an investment and described the variability of a stock market.
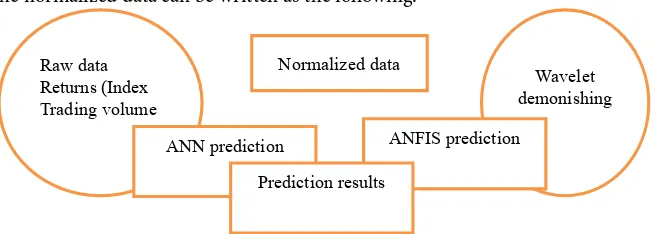
The two models which are used in his research are categorized as a fuzzy neural network which depends or based on fuzzy loge model and time series, and the equivalent ANFIE model. And wavelet with their modifications; first step we normalized the data. The forecasting model comes from different cate-gories of information data as below in Figure 5.
DOI: 10.4236/ojbm.2018.63048 642 Open Journal of Business and Management the normalized data can be written as the following:
Figure 5. The forecasting model of the study. Source: Adapted by author from:
Gholamreza Jandaghi, et al., 2010 African Journal of Business Management Vol. 4(6), pp. 907.
(
)
(
min) (
min)
max
min min
10.2 Normalized data
0.2 0.2
Xt X X
X
t X X
− −
=
− − (11)
We can notice in the equation that increases to the maximum of twenty per-cent, and. Decline minimum to twenty percent this can be considered to cover the domain changes in prediction period.
The data of each index or trading volume included 570 data which are formed in daily periods. 570 data input variable sets are tested with the selected model ANFIS.
We use the following formula:
(
)
1
Input variables cash flow efficiency= t− +Es t−1 (12)
We applied the formula of ANFIS:
Input 1 cash flow efficiniecy 1 and previous daily stockt− (13) Input 2 = ts (t − 1) was able to forecast with R2 equal in ASE (0.893) by 342
primary modeling data for the whole data 570 data, then we have applied the mean absolute percentage error (MAPE) which can be expressed as:
[
]
21 1
k
i
MAPE p C P mi
=
=
∑∑
= − (14)where: N: is the total number of data records, P: represents forecasted output, m
is actual output.
4.2. Design of Fuzzy Logic-Based Stock Prediction
The technical indices’ are used along domain expertise with the definition of the rule of the fuzzy system.
I: The Moving Average Convergence (MACD) divergence.
This indicator uses to comprises of two exponential moving Averages which help to measure momentum in the security .when the MACD is the positive sig-nal this can suggest upward momentum when it is negative it is down warded momentum. This can be calculated as:
1) A/2 day EMA of closing Prices.
Normalized data Raw data
Returns (Index Trading volume
Wavelet demonishing
DOI: 10.4236/ojbm.2018.63048 643 Open Journal of Business and Management 2) A/26 day EMA of closing prices.
3) Subtract the longer EMA in (2).
4) Ag day of the MACD line gotten as the following equation:
( )
( ) (
1)
EMA price t k EMA t= + ⋅ −K
where: y denoted to yesterday, n: is the number of day in EMA, l equal to = 2/(N
+ 1).
And t represents today. The trading rule of MACD to be used in the fuzzy in-ference system as results signal;
• If MACD above the line than buying. If MACD below the line, then sell,
2: RSI (Relative strength, index):
It is considered whether the set is overbought or oversold.
100 100
1 RSI
RSI
= −
+ (16)
where n = number of days, most analysis; Used a-15 days RSI, RSI is an average of N-days up closes/average of N days down closes. If RSI increases to above 70 then sell. .If RSI is between 30 and 70 then hold, If RSI decreased below 30 then buy.
3: Stochastic oscillator (SO): Indicates overbought/oversold conditions on a scale of 0% - 100%. Oscillator readings below 20% are considered oversold. Os-cillator readings above 80% are considered overbought. Based on observation that in a b up trend, closing prices for periods tend to concentrate in the higher part of the period’s range. As prices fall in a b down trend, closing prices tend to be near the extreme low of the period range. The calculations produce two lines, %K and %D which indicate overbought/oversold areas of a chart. Diver-gence between the stochastic lines and the price action of the underlying instru-ment gives a powerful trading signal. I had used this one before, but I was not familiar with it so it did not help me. I feel like this one along with the RSI could be a good combination. (9) %D is a 3-day simple moving average of %K If both lines have topped in the upper zone (above 80% mark) and then the indicator. The following diagram Figure 6 indicates to design of Fuzzy logic-Based stock
prediction summarized all measurement.
5. Empirical Results of the Study
5.1. Analyses of ASE Data Using Indicators
DOI: 10.4236/ojbm.2018.63048 644 Open Journal of Business and Management The results during the winter season and at the end of the year indicate that buying would have been profitable, while price movements in this period indi-cate to buy. The MACD was above the trigger line value of 10. And RSI was about 101, with the stochastic oscillator of 101, with OBV which up word trend, hence, these results of fuzzy inference system reveling to buy.
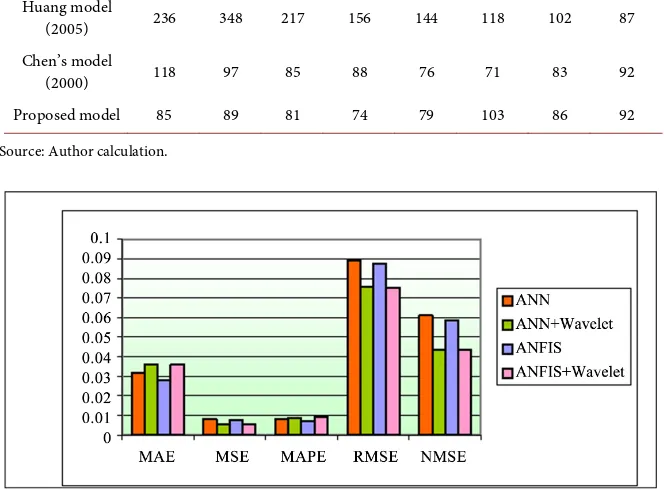
5.2. MPE, MSE, RMSE with Different Models Results of ASE during
(2010-2016)
MPE, MSE, RMSE are with different models results of ASE during (2010-2016). We have applied the mean absolute percentage error (MAPE), mean squared Error (MSE) and the root of the mean squared error as three measures to eva-luate the different models which performance in our paper and detailed above in the text. Table 3 shows the result of the financial sector of ASE during the study period.
[image:13.595.248.498.368.690.2]As results of Table 3, it shows the combination of combining the fuzzy logic, neural network, then wavelet for the ASE stock market prices of financial sector, and simulates the errors between proposed models. The result of comparison shows that the model of ANFIS and wavelet in MSE, RMSE measures out, per-form the other model.
Figure 6. The design of Fuzzy logic-based stock prediction
DOI: 10.4236/ojbm.2018.63048 645 Open Journal of Business and Management Folorunce, o Olusola, issac. Computer and information science, vol.7,
[image:14.595.209.539.113.255.2]No. 3, pp. 4, 2014.
Table 1. MACD results and other indicators In summer season and January month.
Measure 2010 2012 2015 2016
MACD Below the trigger line Below the trigger line Below the trigger line Below the trigger line
RSI 17 16 19 17
SO OBV
St/dev 0.10754 0.09347 0.921 0.08341
R2 0.9136
Recommendation sell sell sell sell
[image:14.595.209.539.301.463.2]Source: Author calculation.
Table 2. ASE input/output variables in the winter season and at the end of the year.
Measure 2010 2012 2015 2016
MACD 10 above trigger line 10 above trigger line 10 above trigger line 10 above trigger line
RSI 95 97 102 115
SO 98 101 106 123
OBV 9 upward 10 upward 8 upward 10 upward
St/dev 0.08741 0.09544 1.0327 1.2438
R2 0.8656
Observation No 265
Recommendation buy buy buy buy
Source: Author calculation.
Table 3. Results of different application models for financial sector ASE during study
(2010-2016).
Model MAPE MSE RMSE
ANN 0.0687 0.00575 0.0614
ANF1S 0.0086 0.0894 0.0098
ANF1S with wavelet 0.0096 0.0064 0.0721
Source: Calculation by author.
[image:14.595.210.540.519.586.2]DOI: 10.4236/ojbm.2018.63048 646 Open Journal of Business and Management RSI: this indicator compares the magnitude of recent gains to recent losses, as attempts have oversold conditions of assets.
Table 4. Prediction indexes in linear and fuzzy-neural models applied to ASE financial
sector.
Models One: a head 360 days: a head
Fuzzy logic MSE 2705.43 6328.16
MAD 18.56 216.23
R2 0.9134 0.6874
ANFIS MSE 1367 1784
MAD 15.42 86.73
R2 0.9475 0.8764
Source: Author calculation from ASE data.
MACD: this indicator gives us a sign of fast and moving average of closing prices, this measure reflects the buying and selling conditions volume which provides clues as intensity of given price movement in market timing strategy an over bough volume and over. The evaluation basis in this paper which applied as a measure is (MAPE) the absolute percentage error, which appears as the fol-lowing formula:
[
]
21 1
k
i
MAPE p C P mi
=
=
∑∑
= − (17)Also, we can use the actual predict value s and the mean value, we can use the following formula:
(
)
21
1 N
i
It yt MAPE
N = yt
−
=
∑
(18)where: yt and It represent the actual and predicted values the .smaller value of the
error is the closer of predicted values to the actual values, the other measure is MSE (mean Squared error which follows the below formula:
(
)
21
MSE It yt
N
= − (19)
where it and yt are the actual and predicted values. The third measure used in this paper is RMSE (root mean squared error) which can be formed as:
(
)
2RMSE= It yt− (20)
5.3. The Simulating Method Results
We have used the simulating method to analysis the stock indexes of the finan-cial sector by using three models Table 5 shows the results.
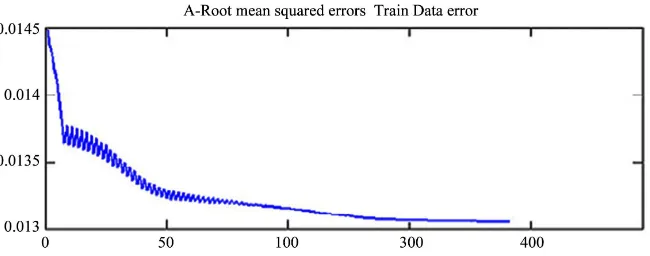
DOI: 10.4236/ojbm.2018.63048 647 Open Journal of Business and Management In Figures 7-9, the input functions of training error after trained 360 days with 265 data chosen in testing, with 4 input variables, and two fuzzification va-riables, give us sign that after a very iteration model training, that fuzzy neural models are superior at the end of 360 days training domain and error amount of the model is too small or sometimes medium.
Table 5. Fuzzy Models.
Fuzzy models RMSE
Huang and Yu’s (model, 2000 102
Chen’s model, (2005) 96
Proposed model 81
[image:16.595.209.538.294.389.2]Source: Author calculation by using Mat Lab.
Table 6. Comparison of the three models for the times series of financial sectors of ASE.
Testing 1/2010 7/2010 7/2010 1/2012 1/2012 6/2012 12/2012 7/2012 1/2013 6/2013 12/2013 7/2013 1/2016 6/2016 12/2016 7/2016
Huang model
(2005) 236 348 217 156 144 118 102 87
Chen’s model
(2000) 118 97 85 88 76 71 83 92
Proposed model 85 89 81 74 79 103 86 92
Source: Author calculation.
Figure 7. Comparison of different measures from ASE data 2015. Source: author calculation
[image:16.595.207.539.322.567.2]DOI: 10.4236/ojbm.2018.63048 648 Open Journal of Business and Management
Figure 8. RMSE for ASE (financial sector) 2015 by train data error. Source: author
analyses results using Mat LAB software.
Figure 9. RMSE for ASE (financial sector) 2015 by check data error. Source: author
results drown by check data error for ASE data.
Section six: Concluded remarks:
Much recent paper applying a linear combination of the significant technical index, as a consequent to predict the stock market index and prices. our paper is under the same consideration , is an attempt work to predict the ASE index and price movement , but after give an explanation about the fuzzy logic and neural network theory, and literature survey to predict the long-term goals of the trend index and price variation , without searching the details of influential factors, such as political disorder ,micro and macroeconomic variables.
The fuzzy system used as input information of our results are derived from technical indicators analysis results and sometimes from charts the inputs gen-erated by the experiments of indicators to have an efficient predicting future price movements in the stock market ,therefore we have chosen in our paper the moving average convergence/divergence (MACD) on Balance volume (OBV) stochastic oscillator (SO) and relative strength index (RSI), these indicators beyond other measures can mimics the behavior of technical trades, and the strategic decision in stock market trader decision. In our viewpoint combination of more measures such as MSE and MAPE beyond other in fuzzy logic, and the neural network is more reliable to predict the index and price movement stock market.
[image:17.595.212.537.69.197.2]DOI: 10.4236/ojbm.2018.63048 649 Open Journal of Business and Management analysis of ASE .recommendation over bough and over soled are combined with other information indicators to give good decision.
Where this paper demonstrate the immense capabilities of fuzzy logic and neural network architecture such as ANFIS in implementing time series predic-tion as task to predict the stock prices direcpredic-tion for ASE, in order to give high performance decision which optimizing profits for the investor in other hands not only linear combination have been used in this paper also the non-linear system modeling with a combination a conventional method used such as ANFIS.
These combinations of the quantitative method are utilized in this paper in order to give a suitable and successful method to predict the price movements in the stock Market and minimize the risk of investment. The future researcher can fly high in this filled by using other quantitative methods, and developed new index more reliable to predict the Prince moment in stock markets.
References
[1] Partha, R., Sanjay, S. and Kowar, M.K. (2012) Fuzzy Candlestick Approach to Trade S & P CNX, NIFTY 50 Index Using Engulfing Patterns. International Journal of Hybrid Information Technology, 5, 57-66.
[2] Hiemstra, Y. (1994) A Stock Market Forecasting Support System Based on Fuzzy Logic. Proceedings of the IEEE 27th Annual Hawaii International Conference on System, Sciences,Wailea, HI, 4-7 January 1994, 281-287.
https://doi.org/10.1109/HICSS.1994.323343
[3] Nicholis, S.C. and Sumpter, D.J.T. (2011) A Dynamical Approach to Stock Market Fluctuation. International Journal of Bifurcation and Chaos, 21, 3557-564.
https://doi.org/10.1142/S0218127411030726
[4] Preethi, G. and Santhi, B. (2012) Stock Market Forecasting Techniques: A Survey. Journal of Theoretical and Applied Information Technology, 46, 24-30.
[5] Chong, T. (2009) Financial Time Series Forecasting Using Improved Wavelet ANN. Master Thesis Report. (Not Published)
[6] Dhamija, A.K. (2010) Financial Time Series Forecasting: Comparison of ANN and ARCH Model. International Research Journal of Finance, No. 49, 194-212.
[7] Zadeh, L.A. (1965) Fuzzy Sets. Information and Control, 8, 338-353.
https://doi.org/10.1016/S0019-9958(65)90241-X
[8] Zadeh, L.A. (1975). The Concept of a Linguistic Variable and Its Application to Approximate Reasoning I. Information Science, 8, 199-249.
https://doi.org/10.1016/0020-0255(75)90036-5
[9] Abraham, A. and Nath, B. (2001) Hybrid Intelligent Systems Design—A Review of a Decade of Research. Technical Report (5/2000), Gippsland School of Computing and Information Technology, Monash University, Australia.
[10] Abraham, A. (2001) Neuro-Fuzzy Systems: State-Of-The-Art Modeling Techniques, In: Mira, J. and Prieto, A., Eds., Connectionist Models of Neurons, Learning Processes, and Artificial Intelligence, Springer-Verlag Germany, Granada, Spain, 269-276. https://doi.org/10.1007/3-540-45720-8_30
Engineer-DOI: 10.4236/ojbm.2018.63048 650 Open Journal of Business and Management ing System Design: Neural Networks, Fuzzy Logic, Evolutionary Programming, Data Mining, and Complex Systems, Proceedings of the Artificial Neural Networks in Engineering Conference (ANNIE ‘99). ASME Press, New York, 587-591.
[12] Kim, K.-J. and Han, I. (2000) Genetic Algorithms Approach to Feature Discretiza-tion in Artificial Neural Networks for the PredicDiscretiza-tion of Stock Price Index. Expert Systems with Applications, 19, 125-132.
https://doi.org/10.1016/S0957-4174(00)00027-0
[13] Egeli, B., Ozturan, M. and Badur, B. (2003) Stock Market Prediction Using Artificial Neural Networks. Proceedings of the 3rd International Conference on Business, Hawaii, 18-21 June 2003, 1-8.
[14] Singh, K.K., Dimri, P. and Singh, J.N. (2014) Green Data Base Management System for Intermediaries of the Indian Stock Market. IEEE Xplore Digital Library, 1-5. [15] White, H. (2010) Economic Prediction Using Neural Networks: The Case of IBM
Daily Stock Returns. Department of Economics University of California, San Diego. [16] Dashore, P. and Jain, S. (2010) Fuzzy Rule Based Expert System to Represent Un-certain Knowledge of E-Commerce. International Journal of Computer Theory and Engineering, 2, 882-886.
[17] Huang, K.Y. and Jane, C.-J. (2009) A Hybrid Model for Stock Market Forecasting and Portfolio Selection Based on ARX, Grey System and RS Theories. Expert Sys-tems with Applications, 36, 5387-5392.https://doi.org/10.1016/j.eswa.2008.06.103
[18] Feng, L., Baowen, L., Boris, P., Tobias, P. and Eugene, H. (2012) Linking Agent-Based Models and Stochastic Models of a Financial Market. Proceeding of the National Academy of Sciences of the United State of America, 109, 8388-8393.
https://doi.org/10.1073/pnas.1205013109
[19] Kim, M.J., Min, S.H. and Han, I.G. (2006) An Evolutionary Approach to the Com-bination of Multiple Classifiers to Predict a Stock Price Index. Expert Systems with Applications, 31, 241-247.https://doi.org/10.1016/j.eswa.2005.09.020
[20] Mate, A.A. (2014) Scheduling By Using Fuzzy Logic in Manufacturing. Internation-al JournInternation-al of Engineering Research and Applications, 4, 104-111.