EARLY GENERATION SELECTION FOR YIELD AND ITS COMPONENTS IN
1
Mansukhlal M. Talapada and
1
Department of Genetics and Plant Breeding, Junagadh Agricultural University,
2Agricultural Research Station, Junagadh Agricultural University, Keriya Road, Amreli
ARTICLE INFO ABSTRACT
Five F
were studied in consecutive years. Ten F
as for low expression of pods per plant, seeds per plant, harvest index and seed yield per plant. A total of 226 selected F
succeeding year. Selection for high leve
seeds per plant and seed yield. Effectiveness may be considered as moderately successful because of 40% of high yielding F
Response of selection through pods per plant found effective for improvement of seed yield in all the crosses. No definite selection pattern was found for identification of superior yielding lines. However, some superior yielding F
traits. Selecting for high pod number in early generation, a foremost consideration needs to be the influence of environment on the effectiveness of selection.
Copyright © 2014 Mansukhlal M. Talapada and Bachubhai A. Monpara
License, which permits unrestricted use, distribution, and reproduction in any medium, provided the original work is properly
INTRODUCTION
Among the pulses, chickpea (Cicer arietinum
important crop with high acceptability and wider use. It is cultivated mainly on marginal lands under rainfed condition in
Rabi season (Shiyani et al., 2001). Two distinct market types’
i. e. desi and kabuli, are recognized (Pundir
Restricted genetic variability available for agronomic characters is a major limitation of pulses improvement in general and chickpea in particular. In chickpea breeding programme, enhancement of genetic potential for seed yield is of paramount important objective. Grafius (1956) suggested that seed yield might be effectively increased by selecting for one or more yield components. Seed yield improvement by yield component selection should be superior to selection for yield per se, when the component traits have a high heritability than yield and when the genetic correlation between the two traits is high (Falconer, 1960). Rahman and Bahl (1986) reported that selection for seeds per pod and 100
fruitful in F3 generation of chickpea. Kumar and Bahl (1992) found indirect selection based on pod number and seed weight to be more effective than either direct selection for yield itself or indirect selection through seeds per pod or random selection. Dahiya et al. (1984) reported effectiveness of selection for high yielding over visual selection. While, Ravinder
found direct selection for seed yield as more effective method.
*Corresponding author: Bachubhai A. Monpara, Agricultural Research Station, Junagadh Agricultural Road, Amreli- 365601(Gujarat), India.
ISSN: 0975-833X
Article History:
Received 10th March, 2014
Received in revised form 15th April, 2014
Accepted 07th May, 2014
Published online 25th June,2014
Key words: Cicer arietinum,
Correlation, F2-F3 generation,
Intergeneration analyses, Indirect selection.
RESEARCH ARTICLE
EARLY GENERATION SELECTION FOR YIELD AND ITS COMPONENTS IN
Mansukhlal M. Talapada and
2*Bachubhai A. Monpara
Department of Genetics and Plant Breeding, Junagadh Agricultural University,
Junagadh-362001, (Gujarat), India
Agricultural Research Station, Junagadh Agricultural University, Keriya Road, Amreli
ABSTRACT
Five F2 populations and their selected F3 progenies of chickpea formed by crossing seven parents were studied in consecutive years. Ten F2 plants from each population were selected for h
as for low expression of pods per plant, seeds per plant, harvest index and seed yield per plant. A total of 226 selected F3 progenies were evaluated in randomized block design with three replications in succeeding year. Selection for high level had maintained their higher expression for pods per plant, seeds per plant and seed yield. Effectiveness may be considered as moderately successful because of 40% of high yielding F3 progenies were derived from F2 plants selected for high pod number. ponse of selection through pods per plant found effective for improvement of seed yield in all the crosses. No definite selection pattern was found for identification of superior yielding lines. However, some superior yielding F3 lines were found to derive by high order selection for all the traits. Selecting for high pod number in early generation, a foremost consideration needs to be the influence of environment on the effectiveness of selection.
Talapada and Bachubhai A. Monpara. This is an open access article distributed under the Creative Commons Attribution License, which permits unrestricted use, distribution, and reproduction in any medium, provided the original work is properly
Cicer arietinum L.) is the most
important crop with high acceptability and wider use. It is cultivated mainly on marginal lands under rainfed condition in wo distinct market types’ , are recognized (Pundir et al., 1985). Restricted genetic variability available for agronomic characters is a major limitation of pulses improvement in general and chickpea in particular. In chickpea breeding programme, enhancement of genetic potential for seed yield is ortant objective. Grafius (1956) suggested that seed yield might be effectively increased by selecting for one or more yield components. Seed yield improvement by yield component selection should be superior to selection for component traits have a high heritability than yield and when the genetic correlation between the two traits is high (Falconer, 1960). Rahman and Bahl (1986) reported that selection for seeds per pod and 100-seed weight is kpea. Kumar and Bahl (1992) found indirect selection based on pod number and seed weight to be more effective than either direct selection for yield itself or indirect selection through seeds per pod or random selection. tiveness of selection for high yielding over visual selection. While, Ravinder et al. (2006) found direct selection for seed yield as more effective method.
Agricultural Research Station, Junagadh Agricultural University, Keriya
The objectives for this study were (1) to study the effect of selection on estimates of mean, coefficient of variation and correlation (2) to assess relationship between the two successive generations and (3) to examine the effectiveness of selection based on yield components in terms of yield response.
MATERIALS AND METHODS
Plant material and experimental detail
The study was carried out for four years at the Instructional Farm, College of Agriculture, Junagadh Agricultural University, Junagadh. The experiments were comprised of a crossing block, F1, F2 and F3
chickpea. Eight parents were sown during replicated crossing block consisting of thre
parents of five metre length with between rows spacing of 60 cm and plant to plant distance of 20 cm to facilitate the hand emasculation and pollination. Five crosses
Vishal (Cross 1), GJG 9905 X CSJ 103 (Cross 2), GJG 0106 Phule G 96006 (Cross 3), JCP 27 X IPC 2000
JCP 27 X CSJ 103 (Cross 5) were attempted. Among the parents, GJG 9905 and Vishal are early maturing with short flowering duration, CSJ 103 and JCP 27 are of late maturity with higher pod bearing capacity and higher seed weight, GJG 0106 possesses low harvest index, while Phule G 96006 has short plant stature and low seed weight and harvest index. IPC 2000-52 is intermediate in maturity and harvest index. All the International Journal of Current Research
Vol. 6, Issue, 06, pp.7015-7021, June,2014
INTERNATIONAL
EARLY GENERATION SELECTION FOR YIELD AND ITS COMPONENTS IN
CHICKPEA
Bachubhai A. Monpara
Department of Genetics and Plant Breeding, Junagadh Agricultural University,
Agricultural Research Station, Junagadh Agricultural University, Keriya Road, Amreli- 365601(Gujarat), India
progenies of chickpea formed by crossing seven parents plants from each population were selected for high as well as for low expression of pods per plant, seeds per plant, harvest index and seed yield per plant. A total progenies were evaluated in randomized block design with three replications in l had maintained their higher expression for pods per plant, seeds per plant and seed yield. Effectiveness may be considered as moderately successful because of plants selected for high pod number. ponse of selection through pods per plant found effective for improvement of seed yield in all the crosses. No definite selection pattern was found for identification of superior yielding lines.
lines were found to derive by high order selection for all the traits. Selecting for high pod number in early generation, a foremost consideration needs to be the
is an open access article distributed under the Creative Commons Attribution License, which permits unrestricted use, distribution, and reproduction in any medium, provided the original work is properly cited.
The objectives for this study were (1) to study the effect of selection on estimates of mean, coefficient of variation and correlation (2) to assess relationship between the two ons and (3) to examine the effectiveness of selection based on yield components in terms of yield response.
MATERIALS AND METHODS
Plant material and experimental detail
The study was carried out for four years at the Instructional Agriculture, Junagadh Agricultural University, Junagadh. The experiments were comprised of a 3 populations of five crosses in chickpea. Eight parents were sown during Rabi-2007 in non replicated crossing block consisting of three rows for each parents of five metre length with between rows spacing of 60 cm and plant to plant distance of 20 cm to facilitate the hand emasculation and pollination. Five crosses viz., GJG 9905 X Vishal (Cross 1), GJG 9905 X CSJ 103 (Cross 2), GJG 0106 X Phule G 96006 (Cross 3), JCP 27 X IPC 2000-52 (Cross 4) and JCP 27 X CSJ 103 (Cross 5) were attempted. Among the parents, GJG 9905 and Vishal are early maturing with short flowering duration, CSJ 103 and JCP 27 are of late maturity ng capacity and higher seed weight, GJG 0106 possesses low harvest index, while Phule G 96006 has short plant stature and low seed weight and harvest index. IPC 52 is intermediate in maturity and harvest index. All the
five F1s were hand sown in Rabi-2008 and allowed to self for advancement of generation.
F2 studies
The parents and F2 seeds were sown during Rabi - 2009 in a randomized block design with three replications. Five rows of each F2 and single row of each parent were hand sown to each plot of four meters length, keeping row to row and plant to plant spacing of 45 cm and 10 cm, respectively. The measurements were taken at maturity on randomly selected five plants from each parent and 75 plants from each F2 per replication. The high and low groups were generated for each cross by selecting the ten highest and the ten lowest F2 plants per selection criterion. Four selection criteria were investigated which were based on seed yield per plant, pods per plant, seeds per plant and harvest index. Since several of the plants were selected for more than one character, only a total of 226 F2 plants were selected for either high or low trait in all the crosses.
F3 studies
The F3 progenies of 226 selected F2 plants were grown in single row plots of four meter length with spacing of 45 x 10 cm in randomized block design replicated thrice during Rabi-2010. The data in F3 were collected on four characters. Number of pods and seeds were recorded on plant basis, whereas seed yield (g) and harvest index (%) were measured on plot basis.
Statistical Analysis
The average values of the characters were subjected to statistical analysis according to design used in the study. These data were also used to calculate mean
X and coefficient of variability (CV) by using following formula.N X X
Where, ∑X is sum of measurement for a character and N is number of sample for a character. Variance (
2) was calculated as the sum of square of deviation from its mean and divided by the degree of freedom. Thus, it represent as follows.
1
2 2
2
N N
X X
Where, ∑ is summation, X is individual sample value of a character and N is number of sample. Standard error (SE) for each mean was worked out according to following formula.
N
SE
2
Coefficient of variation (CV) was calculated by using following formula.
(%) 100
2
X X
CV
Simple correlation coefficient between the characters was worked out according to the procedure of Al-Jibouri et al. (1958). The data recorded on F2 selected plants as well as on F3 progenies for high and low groups were used for this purpose. Covariance for a pair of characters was computed in similar fashion as variance for individual character in the F2 and F3 generations. Formula used for calculating simple correlation coefficient is as under.
y
x
xy
V
CO
rxy
2
2
.
ˆ
ˆ
)
(
ˆ
Where, Rx y is simple correlation coefficient between variables x and y,
CO ˆ
V
(xy) is covariance between two variables x andy in F3 population,
ˆ
2x
is variance of x variable and
ˆ
2y
is variance of y variable The test of significance for correlation value was done by calculating‘t’ value using following formula.2
1 2
X n
r r t
Where, t is calculated value of ‘t’, r is correlation coefficient and n is number of observation. The calculated ‘t’ value was compared with table ‘t’ value at n-2 degrees of freedom to test the significance of correlation coefficient.
Heritability (h2) and genetic advance (GA) based on relationship between two successive generations (Cahaner and Hillet, 1980) were computed as under.
Where, g2 is the initial generation and g3 in the following generation. Genetic advance (GA) as percentage of mean was computed as per following formula.
Where, K is equal to 2.06 (selection intensity at 5%) and X is mean of F3 progeny. Parent-offspring correlations were worked out according to Frey and Horner (1957).
y x
xy V CO rxy y
x bxy b
2 2
ˆ . ˆ
) ( ˆ
ˆ ˆ '
b’ = byx= rxy = σ b’ =ryx + S.E. of ryx
Where, cov (xy) is co-variance between parents and progenies,
by x is regression co-efficient of parents on progenies and ryx
is correlation co-efficient between parents and progenies. Response to selection was assumed to be the difference between high F3 progeny means and the low F3 progeny means. Student 't' test was employed to judge the real difference
) (g progeny of
Variance
) (g progeny and ) (g parent between covariance
3
3 2
2
) (h ty Heritabili
100 )
(g progeny of
variance (%)
2
3
X X
h K
Mean
between high and low F3 progeny. Also, selection effectiveness was assessed by taking the 10 highest yielding F3 lines of each cross and examining their corresponding F2 selection group patterns.
RESULTS
Mean values and coefficient of variations
[image:3.595.317.546.255.613.2]The data presented in Table 1shows that means of F3 selected lines for high and low expression were higher than their respective F2 means in all the crosses and characters. As F2 and F3 populations were studied in two succeeding years, higher mean expression of low selection group over F2 means of respective character indicated that environmental conditions for the crop of F3 populations would be more favourable. Coefficient of variation (CV) in F3 lines for high and low group were not always higher or lower than their respective CV in F2 generation, i.e., mixed trend was observed. In Cross 1, F3CV both of high and low group was lower than their respective F2CV for pods per plant, seeds per plant and harvest index. In Cross 2, this estimate of both groups was higher for seeds per plant and seed yield, and lower for harvest index. Similarly, as compared to F2CV, Cross 3 expressed F3CV values higher of both high and low group for pods per plant, seeds per plant and seed yield, and lower for harvest index. In case of Cross 4, F3CV values were lower for pods per plant and higher for seed yield. Higher F3CV values in the Cross 5 were observed for seeds per plant, seed yield and harvest index. On the other hand, Cross 1 and 3 for seeds per plant, Cross 2 and 5 for pods per plant and Cross 4 for harvest index expressed either higher or lower magnitude of F3CV over their respective F2 CV. Thus, trend of increase or decease in CV values of F3 over F2 was not consistent.
Table 1. Mean and coefficient of variation (CV) in F2 populations and F3 selected lines for high and low group of yield and its
components in five chickpea crosses
Character/
Crosses§
F2 population F3 selected lines
Mean CV% Mean CV%
High Low High Low
Pods/plant
Cross 1 22.83 ± 0.32 22.91 73.48 ± 1.90 70.29 ± 2.12 18.97 22.14
Cross 2 33.44 ± 0.41 20.23 88.67 ± 2.24 58.83 ± 2.38 18.62 29.72
Cross 3 37.18 ± 0.26 11.61 61.68 ± 3.10 58.29 ± 1.48 37.01 18.65
Cross 4 27.52 ± 0.36 21.90 75.98 ± 2.06 65.52 ± 1.24 19.90 13.87
Cross 5 29.69 ± 0.31 17.15 78.38 ± 1.57 50.16 ± 1.18 14.75 17.25
Seeds/plant
Cross 1 26.70 ± 0.33 20.20 93.64 ± 2.42 87.93 ± 2.20 19.02 18.36
Cross 2 41.35 ± 0.42 16.73 112.46 ± 3.21 78.16 ± 2.33 21.02 21.90
Cross 3 49.42 ± 0.38 12.86 79.91 ± 2.17 78.16 ± 3.51 20.00 34.08
Cross 4 40.93 ± 0.37 14.81 109.17 ± 3.09 82.00 ± 1.33 20.79 11.94
Cross 5 40.24 ± 0.40 16.67 97.65 ± 2.45 63.44 ± 2.40 18.44 26.56
Seed yield (g)
Cross 1 3.38 ± 0.05 26.51 120.10 ± 3.42 92.50 ± 3.35 20.92 26.60
Cross 2 5.69 ± 0.07 19.02 89.02 ± 2.66 88.41 ± 3.47 21.94 28.87
Cross 3 6.35 ± 0.05 13.31 121.35 ± 5.25 92.63 ± 2.21 31.82 17.58
Cross 4 4.95 ± 0.04 12.95 81.85 ± 1.95 79.91 ± 2.65 17.51 24.41
Cross 5 5.17 ± 0.07 21.70 104.20 ± 4.12 95.12 ± 3.30 29.05 25.48
Harvest index (%)
Cross 1 24.52 ± 0.28 19.06 52.21 ± 0.71 57.85 ± 0.96 10.03 12.09
Cross 2 26.94 ± 0.40 24.81 46.37 ± 1.30 53.97 ± 1.02 20.64 13.92
Cross 3 30.64 ± 0.32 17.44 55.57 ± 1.14 64.74 ± 0.69 15.09 7.79
Cross 4 30.70 ± 0.27 14.70 48.69 ± 1.87 58.11 ± 0.99 28.23 12.58
Cross 5 35.29 ± 0.27 12.76 41.99 ± 0.95 40.94 ± 0.75 16.62 13.42
§ Cross 1 = GJG 9905 X Vishal,Cross 2 = GJG 9905 X CSJ 103,Cross 3 = GJG
0106 X Phule G 96006,Cross 4 = JCP 27 X IPC 2000-52 and Cross 5 = JCP 27 X CSJ 103
Correlation coefficients
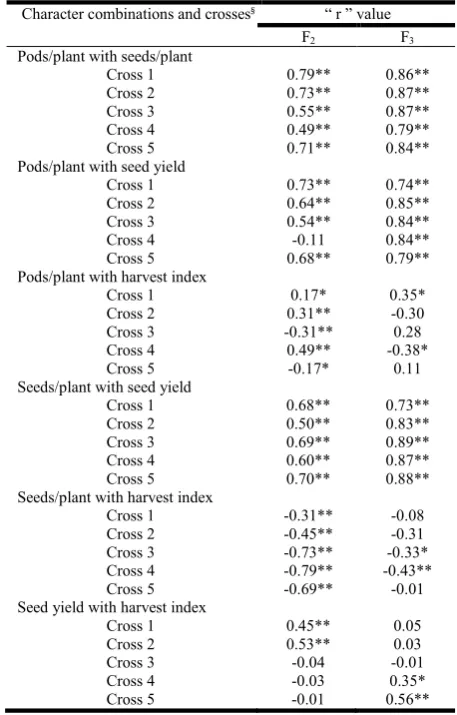
Simple correlation coefficient estimated for possible pairs of four characters in F2 and F3 generations (ignoring high and low groups) of five crosses (Table 2) reveals that correlations of pods per plant with seeds per plant and seed yield were highly significant in F2 and F3 populations of all the crosses, except F2 of Cross 4, the relationships found more stronger in F3 over F2. Such definite patterns of relationships were also observed between seeds per plant and seed yield. On the contrary, change in strength and direction of correlation in F3 over F2 generation was inconsistent for harvest index with other studied traits.
Table 2. Simple correlation coefficient(r) among four characters in F2 and F3 generation (ignoring high and low groups) in five
chickpea crosses
Character combinations and crosses§ “ r ” value
F2 F3
Pods/plant with seeds/plant
Cross 1 0.79** 0.86**
Cross 2 0.73** 0.87**
Cross 3 0.55** 0.87**
Cross 4 0.49** 0.79**
Cross 5 0.71** 0.84**
Pods/plant with seed yield
Cross 1 0.73** 0.74**
Cross 2 0.64** 0.85**
Cross 3 0.54** 0.84**
Cross 4 -0.11 0.84**
Cross 5 0.68** 0.79**
Pods/plant with harvest index
Cross 1 0.17* 0.35*
Cross 2 0.31** -0.30
Cross 3 -0.31** 0.28
Cross 4 0.49** -0.38*
Cross 5 -0.17* 0.11
Seeds/plant with seed yield
Cross 1 0.68** 0.73**
Cross 2 0.50** 0.83**
Cross 3 0.69** 0.89**
Cross 4 0.60** 0.87**
Cross 5 0.70** 0.88**
Seeds/plant with harvest index
Cross 1 -0.31** -0.08
Cross 2 -0.45** -0.31
Cross 3 -0.73** -0.33*
Cross 4 -0.79** -0.43**
Cross 5 -0.69** -0.01
Seed yield with harvest index
Cross 1 0.45** 0.05
Cross 2 0.53** 0.03
Cross 3 -0.04 -0.01
Cross 4 -0.03 0.35*
Cross 5 -0.01 0.56**
§ cross codes as per Table 1; *and**represent significant values at p=0.05 and
p=0.01 probability levels, respectively
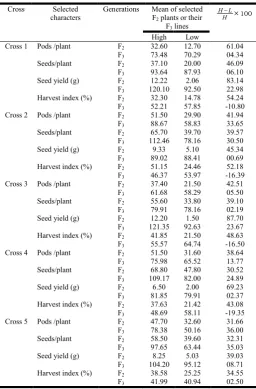
Response to selection for selected traits
[image:3.595.31.293.494.720.2]compared to F2 for the characters studied in all the crosses, except pods per plant and seeds per plant in Cross 5, though such estimates were found even negative for harvest index in F3 of some crosses.
Table 3. Per cent mean differences between high and low groups of selected F2 plants and their F3 lines for four characters in five
chickpea crosses
Cross§ Selected
characters
Generations Mean of selected
F2 plants or their
F3 lines
100
H L H
High Low
Cross 1 Pods /plant F2 32.60 12.70 61.04
F3 73.48 70.29 04.34
Seeds/plant F2 37.10 20.00 46.09
F3 93.64 87.93 06.10
Seed yield (g) F2 12.22 2.06 83.14
F3 120.10 92.50 22.98
Harvest index (%) F2 32.30 14.78 54.24
F3 52.21 57.85 -10.80
Cross 2 Pods /plant F2 51.50 29.90 41.94
F3 88.67 58.83 33.65
Seeds/plant F2 65.70 39.70 39.57
F3 112.46 78.16 30.50
Seed yield (g) F2 9.33 5.10 45.34
F3 89.02 88.41 00.69
Harvest index (%) F2 51.15 24.46 52.18
F3 46.37 53.97 -16.39
Cross 3 Pods /plant F2 37.40 21.50 42.51
F3 61.68 58.29 05.50
Seeds/plant F2 55.60 33.80 39.10
F3 79.91 78.16 02.19
Seed yield (g) F2 12.20 1.50 87.70
F3 121.35 92.63 23.67
Harvest index (%) F2 41.85 21.50 48.63
F3 55.57 64.74 -16.50
Cross 4 Pods /plant F2 51.50 31.60 38.64
F3 75.98 65.52 13.77
Seeds/plant F2 68.80 47.80 30.52
F3 109.17 82.00 24.89
Seed yield (g) F2 6.50 2.00 69.23
F3 81.85 79.91 02.37
Harvest index (%) F2 37.63 21.42 43.08
F3 48.69 58.11 -19.35
Cross 5 Pods /plant F2 47.70 32.60 31.66
F3 78.38 50.16 36.00
Seeds/plant F2 58.50 39.60 32.31
F3 97.65 63.44 35.03
Seed yield (g) F2 8.25 5.03 39.03
F3 104.20 95.12 08.71
Harvest index (%) F2 38.58 25.25 34.55
F3 41.99 40.94 02.50
§ cross codes as per Table 1
Inter-generation analyses
[image:4.595.33.290.156.546.2]The values of heritability between F2 and F3 generation were lower in all the crosses for studied characters (Table 4). However, pods per plant exhibited as high as 38 per cent heritability in the Cross 5. This character in the same cross showed high magnitude of genetic advance as percentage of mean (>20 %). Other characters and crosses expressed low heritability and genetic advance. Correlation between F2 and F3 generation (Table 4) was highly significant and positive for pods per plant in two crosses (0.66- 0.78) and seeds per plant in three crosses (0.62 - 0.71). However, highly significant negative correlation was occurred for harvest index in the Cross 3 (-0.64).
Table 4. Estimation of intergeneration (F2/F3) heritability, genetic advance (GA) and correlation coefficient for four characters in
five chickpea crosses
Crosses/Characters Cross 1§ Cross 2 Cross 3 Cross 4 Cross 5
Pods/plant
Heritability 0.07 0.31 0.04 0.34 0.38
GA as % Mean 2.85 19.37 2.44 12.80 21.07
Correlation 0.10 0.66** 0.09 0.45* 0.78**
Seeds/plant
Heritability 0.11 0.31 0.04 0.30 0.28
GA as % Mean 3.98 17.59 2.07 14.15 16.56
Correlation 0.21 0.64** 0.07 0.62** 0.71**
Seed yield (g)
Heritability 0.10 0.01 0.08 0.01 0.01
GA as % Mean 5.32 0.14 4.52 0.20 0.41
Correlation 0.55** 0.03 0.45* 0.04 0.11
Harvest index (%)
Heritability -0.65 -0.60 -0.84 -0.26 -0.01
GA as % Mean -14.59 -22.55 -22.26 -11.75 -0.29
Correlation -0.45** -0.45* -0.64** -0.38 -0.01
§ cross codes as per Table 1
*and**represent significant values at p=0.05 and p=0.01 probability levels, respectively
Direct and indirect selection for seed yield improvement
Mean seed yield of F3 lines derived from direct selection for seed yield itself and indirect selection via yield components (Table 5) shows that differences in high and low group mean were significant in all the crosses when indirect selection via pods per plant was practiced (difference varied from 17.4 g to 39.3 g). Similarly, difference was found significant when selection was exercised for seeds per plant in the Cross 2 (24.7g), Cross 4 (18.9 g) and Cross 5(36.3 g), and for harvest index in the Cross 1(22.2g), Cross 3(20.9 g) and Cross 5(12.5 g). In case of direct selection for seed yield itself, the seed yield difference between high and low F3 lines found significant in the Cross 1(27.6 g) and Cross 3(28.8 g).
Table 5. Mean seed yield of F3 lines from high and low selection group and seed yield response from direct and indirect selection
for yield and its components in five chickpea crosses
Character selected
Group Cross
1§ Cross 2 Cross 3 Cross 4 Cross 5
Pods/ plant High 117.7 106.6 119.2 91.0 119.8
Low 98.9 72.1 101.8 70.8 80.5
Diff. 18.8* 34.5* 17.4* 20.2* 39.3*
Seeds/plant High 114.4 106.5 104.9 90.7 117.8
Low 111.8 81.8 103.9 71.8 81.5
Diff. 2.6 24.7* 1.0 18.9* 36.3*
Seed yield (g) High 120.1 89.0 121.4 81.9 104.2
Low 92.5 88.4 92.6 79.9 95.1
Diff. 27.6** 0.60 28.8* 2.0 9.1
Harvest index (%)
High 124.9 88.0 122.8 82.3 103.8
Low 102.7 86.4 101.9 80.5 91.3
Diff. 22.2** 1.6 20.9* 1.8 12.5*
§ cross codes as per Table 1, Diff. = Difference between high and low group
*and**represent significant values at p=0.05 and p=0.01 probability levels, respectively
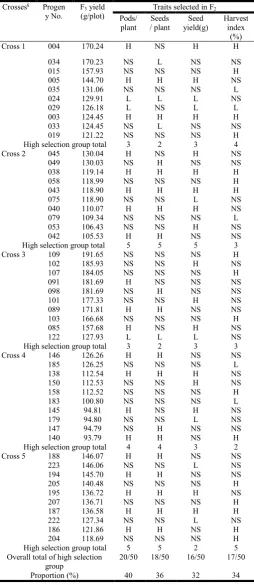
Identification of superior lines
[image:4.595.307.558.522.657.2]isolated and traced to F2 plant selected for high or low expression (Table 6). Out of 10 highest yielding lines in the Cross 1, a maximum of four superior lines were derived from F2 plants selected for high harvest index.
Table 6. Ten highest yielding F2 selected F3 lines and the pattern of selection group of their parental F2 plants in five chickpea
crosses
Crosses§ Progen y No.
F3 yield
(g/plot)
Traits selected in F2
Pods/ plant
Seeds / plant
Seed yield(g)
Harvest index
(%)
Cross 1 004 170.24 H NS H H
034 170.23 NS L NS NS
015 157.93 NS NS NS H
005 144.70 H H H NS
035 131.06 NS NS NS L
024 129.91 L L L NS
029 126.18 L NS L L
003 124.45 H H H H
033 124.45 NS L NS NS
019 121.22 NS NS NS H
High selection group total 3 2 3 4
Cross 2 045 130.04 H NS H NS
049 130.03 NS H NS NS
038 119.14 H H H H
058 118.99 NS NS NS H
043 118.90 H H H H
075 118.90 NS NS L NS
040 110.07 H H H NS
079 109.34 NS NS NS L
053 106.43 NS NS H NS
042 105.53 H H NS NS
High selection group total 5 5 5 3
Cross 3 109 191.65 NS NS NS H
102 185.93 NS NS H NS
107 184.05 NS NS NS H
091 181.69 H NS NS NS
098 181.69 NS H NS NS
101 177.33 NS NS H NS
089 171.81 H H NS NS
103 166.68 NS NS NS H
085 157.68 H NS H NS
122 127.93 L L L NS
High selection group total 3 2 3 3
Cross 4 146 126.26 H H NS NS
185 126.25 NS NS NS L
138 112.54 H H H NS
150 112.53 NS NS H NS
158 112.52 NS NS NS H
183 100.80 NS NS NS L
145 94.81 H NS H NS
179 94.80 NS NS L NS
147 94.79 NS H NS NS
140 93.79 H H NS H
High selection group total 4 4 3 2
Cross 5 188 146.07 H H NS NS
223 146.06 NS NS L NS
194 145.70 H H NS NS
205 140.48 NS NS NS H
195 136.72 H H H NS
207 136.71 NS NS NS H
187 136.58 H H H H
222 127.34 NS NS L NS
186 121.86 H H NS H
204 118.69 NS NS NS H
High selection group total 5 5 2 5
Overall total of high selection group
20/50 18/50 16/50 17/50
Proportion (%) 40 36 32 34
§ cross codes as per Tale 1
High, low and non selected are designated by H, L and NS, respectively
Similarly, maximum of five superior lines each traced to high pod number, high seed number and high seed yield in the Cross 2, four lines each traced to high pod number and high seed number in the Cross 4, and five lines each traced to high pod number , high seed number and high harvest index in the Cross 5. Out of 50 highest yielding lines across the crosses, 20 lines (40%) and 18 lines (36%) were derived from F2 plants selected for high pod number and high seed number, respectively. However, the best top yielding five lines across the crosses were identified from the Cross 3 only.
DISCUSSION
Mean and CV for yield and its components of F2 populations and their F3 selected progenies of high and low selection groups (Table 1) were estimated either on plant basis or on plot basis. An effect of selection was measured in terms of difference between the values of F2 and F3 generations. A perusals of the table indicated that mean values of F3 progenies were greater than those of F2 plants. This is possible because of seasonal variations, as both the generations were grown in two consecutive years. Favourable season may be provided to F3 generation as mean value of both high and low groups were higher than F2 mean for pods per plant, seeds per plant and harvest index. Examination of F3 selected progeny means revealed that selection for high pod number maintained their performance higher than low pod number. Similar trend was also observed for seeds per plant and seed yield. Harvest index showed the contrast results as the mean value of high selection group was lower than that of low selection group in all the crosses, except Cross 5. This suggests that harvest index may be under the pronounced environmental effect and probably means that the superior of individual selection made in F2 for high expression was more due to environment than due to genotype.
A value of coefficient of variation (CV) provides the information about presence of variability in a test population. The CV values found to be increased in F3 lines either for high or low or for both in most cases compared to those estimated in F2 generation (Table 1). For example, seed yield showed higher CV in four crosses for both high and low F3 progenies and in one cross for low F3 progenies. Similarly, higher CV for seeds per plant was estimated in three crosses for both selection group and in one cross each for high and low F3 progenies. Boerma and Cooper (1974) have observed decreasing coefficient of genetic variability with each generation of selection in four soybean crosses. Unexpectedly increasing variability with successive generation of selection in the present study may be due to predominant repulsion phase linkage (Hanson, 1959). However, the possibility of genetic differentiation for increasing variance due to inbreeding in successive generation can not be ruled out (Khalifa and Qualset, 1975).
considered to be indicative of effects of high and low selection of each selection criterion. This was realized to some extent. The significant correlation of pods per plant with seeds per plant and seed yield, and between seeds per plant and seed yield in F2 became stronger in F3 generation of all the crosses, except pods per plant with seed yield in the Cross 4. These changes may most probably be due to directional selection operated with high and low groups, though the influence of season difference on the results should be taken into consideration. Selection for pods per plant, seeds per plant and seed yield might have of good impact on seed yield improvement and effectiveness of indirect selection. Increasing magnitude of correlation among different traits with advancement of generation has been reported by Salimath and Patil (1990) in chickpea and Whan et al. (1981) in wheat. Effect of F2 selection on correlation of harvest index with other traits in F3 was observed to be cross dependent. For example, harvest index and pods per plant in F2 generation showed significant positive correlation in three crosses and significant negative in two crosses. Out of these five F2 correlations, three became non-significant with opposite sign in F3 generation, while Cross 4 showed shifting of significant positive F2 correlation to significant negative F3 correlation. Kishore and Gupta (2002) reported that if one association is positive for a particular cross in one generation, then the same association may be negative for the same cross in the succeeding generation. Such difference in correlation between characters from generation to generation may be possible because of the high degree of segregation and genetic heterozygosity in the F3 generation leading to the breakdown and formation of new linkages (Kishore and Gupta, 2002).
The difference between high and low selected traits in F2 and F3 is considered as expected and actual response to selection, respectively, for that particular trait. With few exceptions, reduction in per cent mean difference in F3 compare to that of F2 was observed for all the characters (Table 3). This difference was even negative when selection was conducted for harvest index. Early generation selection for harvest index could mislead due to genotype x environment interaction. Similar observations have been reported by Whan et al. (1982) in wheat. The per cent difference in F3 than F2 was relatively larger for pod number, seed number and seed yield. This indicates that selection for these characters would be effective. However, one has to consider presence of genotype x environment interaction at the great extent, low heritability and inter genotypic competition among individuals within a selected heterogeneous line which affects the effectiveness of early generation selection (Gedge et al., 1978). Parent-progeny correlation as well as intergeneration heritability and genetic advance as percentage of mean in five chickpea crosses worked out based on two successive generations viz., F2 and F3 (Table 4), revealed that the heritability estimates were low (> 0.40) for all the characters under consideration. The magnitude of genetic advance as percentage of mean for pods per plant was high (>20) in the Cross 5 and moderate (in between 10 to 20) in the Cross 2 and Cross 4. Generally speaking, heritability and genetic advances between F2 and F3 generations for the characters under study were low enough to conclude that their selection would be least effective in early generation.
Correlation between F2 and F3 generation (Table 5) varied depending upon the cross combination tested but often non-significant. However, significant positive values for pods per plant and seeds per plant were observed in three crosses and for seed yield in two crosses, which indicate the effectiveness of selecting F2 plants in a particular genetic background. Harvest index showed significant negative correlations in three crosses. Often non-significant inter-generation correlation for seed yield has been reported by Rahman and Bahl (1986) in chickpea. Since weak or negative intergeneration relationships was observed for the measured traits and strong positive associations found to be established among seed yield, pods per plant and seeds per plant within F2 and F3 generation (Table 2), one can expect the involvement of genotype x environment interaction. Genotype x environment interaction tends to reduce the correlation between generations, especially when one is evaluating early generation material for seed yield (O’Brien et al., 1978). Whan et al. (1981) concluded that while gains in wheat yield can be achieved by selecting for yield in early generations, a foremost consideration needs to be the influence of different sites and years on the effectiveness of selection.
also assumes importance since effects of differing years and selfing (Kishore and Gupta, 2002).
One progeny (003) in the Cross 1, two progenies (038 and 043) in the Cross 2 and one progeny (187) in the Cross 5 belonged to common F2 plant selection for high expression of all the four selection criteria (Table 7). In contrast, F3 progenies 034, 035 and 033 of the Cross 1, 075 and 079 of the Cross 2, 185,183 and 179 of the Cross 4 and 223 and 222 of the Cross 5 were derived from F2 selected low plants for any one of the measured traits and not selected for any other characters. This shows that an optimum balance of those characters possessing neither high nor low expression may be resulted in high yielding lines (Alexander et al., 1984; Singh and Balyan, 2003). The best five F3 progenies (109, 102, 107, 091 and 098) across the crosses are all from the Cross 3. These individual progenies derived from F2 plants those were selected for one high expression of different characters and not selected for other selection criterion. This suggests that there was no definite pattern of identification of superior yielding lines by selecting for one or more trait(s) even within a population. Such variation in the results may be attributed to the genotype x year interaction or may be due to failure of heterozygous high yielding genotypes to breed true because of segregation in the succeeding generations (Singh and Balyan 2003).
Conclusion
The results of this study suggested that the effectiveness of selection involving the measured traits varied from cross to cross. However, selection for pod number usually found more effective than the other selection criteria. Some superior yielding lines were identified by selection for all the traits; whereas, yield increment in some of the progenies was observed even in the absence of traits selected for high expression.
REFERENCES
Alexander, W.L., Smith, E.I. and Dhanasobhan, C. 1984. A comparison of yield and yield component selection in winter wheat. Euphytica 33:953-61.
Boerma, H.R. and Cooper, R.L. 1974. Effectiveness of early generation yield selection of heterogeneous lines in soybeans. Crop Sci. 15:313-15.
Cahaner, A. and Hillet, J. 1980. Estimating heritability and genetic correlation between traits from generations F2 and F3 of self fertilizing species: a comparison of three methods. Theor. Appl. Genet. 58:33-38.
Dahiya, B.S., Waldia, R.S., Kaushik, L.S. and Solanki, I.S. 1984. Early generation yield testing versus visual selection in chickpea (Cicer arietinum L.). Theor. Appl. Genet. 68:525-29.
Falconer, D.S. 1960. Introduction to Quantitative Genetics. Edinburgh: Oliver and Boyd.
Frey, K.J. and Horner, T. 1957. Heritability in standard unit. Agron. J. 49:59-62.
Gedge, D.L., Fehr, W.R. and Cox, D.F. 1978. Influence of inter-genotypic competition on seed yield of heterogeneous soybean lines. Crop Sci. 18:233–36. Grafius, J.E. 1956. Components of yield in oats: A geometrical
interpretation. Agron. J. 58: 438-41.
Hanson, W.D. 1959. The breakup of initial linkage blocks under selected mating systems. Genetics 44:857–68. Khalifa, M.A. and Qualset, C.O. 1975. Inter genotypic
competition between tall and dwarf wheat in hybrid bulks. Crop Sci. 15:640–44.
Kishore, N. and Gupta, V.P. 2002. Early generation selection in microsperma-macrosperma derived gene pool of lentil. Indian J. Genet. 62: 34-37.
Kumar, J. and Bahl, P.N. 1992. Direct and indirect selection for yield in chickpea. Euphytica 60: 197-99.
O’Brien, L., Baker, R.J. and Evans, L.E. 1978. Response to selection for yield in F3 of four wheat crosses. Crop Sci. 18:1029-33.
Pundir, R.P.S., Rao, N.K. and Van der Maesen, L.J.G. 1985. Distribution of qualitative traits in the world germplasm of chickpea (Cicer arietinum L.). Euphytica 34:364-67. Rahman, M.A. and Bahl, P.N. 1986. Evaluation of early
generation testing in chickpea. Plant Breed. 97:82-85. Ravinder, K., Waldia, R.S., Malik, B.P.S. and Behl, R.K. 2006.
Genetic variability in early generation selection in two crosses of chickpea. Natnal. J. Pl. Improve. 8: 67-69. Salimath, P.M. and Patil, S.S. 1990. Genetic study in F3 and F4
generations of chickpea. Indian J. Genet. 50 : 378-81. Shiyani, R.L., Joshi, P.K. and Bantilan, M.C.S. 2001. Impact
of chickpea research in Gujarat. ICRISAT Patncheru 50:23-24.
Singh, T. and Balyan, H.S. 2003. Relative efficiency of various single plant selection criteria and F3 generation yield testing in wheat (T. aestivum L.). Indian J. Genet. 63: 24-29.
Whan, B.R., Knight, R. and Rathjen, A. J. 1982. Response to selection for grain yield and harvest index in F2, F3 and F4 derived lines of two wheat crosses. Euphytica 31:139-50. Whan, B.R., Rathjen, A. J. and Knight, R. 1981. The relation
between wheat lines derived from the F2, F3, F4 and F5 generation for grain yield and harvest index. Euphytica 30:419-30.