ISSN Print: 2161-718X
DOI: 10.4236/ojs.2018.83026 May 21, 2018 401 Open Journal of Statistics
Analysis of Consumer Appraisal of China’s
Rural Specialty E-Commerce under Data Mining
Method
Xiaoyu Liu, Youdong Wen
*School of Statistics, Jiangxi University of Finance and Economics, Nanchang, China
Abstract
In the research, the crawler technology was used to evaluate the Taobao silkie, and product evaluation data is the case object. After word segmentation, naive Bayesian, K-means, and TF-IDF related algorithms were used to complete word frequency statistics, sentiment analysis, and cluster analysis. It was found that the quality of rural specialty products was more recognized by e-commerce customers, but its overall emotional score was slightly lower than that of non-origin products. After summing up the drawbacks of the former, targeted countermeasures and suggestions were proposed.
Keywords
“Double-Invasion” Policy, Upsell, Rural Specialty, Data Mining, Emotional Score
1. Introduction
The vigorous implementation of China’s Internet “double creation” policy has made the e-commerce industry usher in a new development opportunity; help-ing farmers to sell agricultural products to urban residents through e-commerce platforms to increase income, and supporting the development of rural e-commerce has become an important part of the government’s poverty reduc-tion efforts. The local products sold by farmers are usually origin products, but their e-commerce platform operation experience is insufficient. In order to im-prove e-commerce service levels and competitiveness, it is important to extract valuable information from customer evaluation data.
In recent years, the e-commerce industry has been developing rapidly under the encouragement of various favorable policies. The “created space”, “e-commerce How to cite this paper: Liu, X.Y. and Wen,
Y.D. (2018) Analysis of Consumer Appraisal of China’s Rural Specialty E-Commerce under Data Mining Method. Open Journal of Statistics, 8, 401-415.
https://doi.org/10.4236/ojs.2018.83026
Received: April 16, 2018 Accepted: May 18, 2018 Published: May 21, 2018
Copyright © 2018 by authors and Scientific Research Publishing Inc. This work is licensed under the Creative Commons Attribution International License (CC BY 4.0).
http://creativecommons.org/licenses/by/4.0/
DOI: 10.4236/ojs.2018.83026 402 Open Journal of Statistics
center” and “rural village pantry” actively created in various regions in China have mushroomed. The most important part of China’s advocacy policy is to di-vert agricultural products from farmers’ households to online sales, and it is said to be an “upselling strategy”. Although the quality of rural native products is rel-atively high, it is popular among urban consumers. Due to the lack of operation level of farmers’ e-commerce and high logistics costs, many specialty agricultural products have not achieved good sales. The technical threshold for e-commerce sales by farmers is often high. Therefore, government departments in various re-gions usually actively introduce powerful e-commerce training institutions to educate farmers about e-commerce knowledge, including online store openings, product packaging, logistics, distribution and complete e-commerce marketing system course.
Agricultural products can be divided into origin products and non-origin products according to geographical attributes. Products of origin refer to prod-ucts that naturally grow in a certain area but do not produce in other areas or produce less, or grow worse in other areas; products that are not origin refers to that the area does not grow naturally but is good at processing and selling such products. Silkie, for example, is originally located in Wangbi Village, Wushan-xiyan, Taihe County, Jiangxi Province. With a history of more than 400 years, its edible and medicinal value is very high. It is a typical agricultural product and can be considered as a special product in the region. In the e-commerce plat-form, the product named after silkie is not limited to the products sold in the country of origin. The top selling places on the Taobao platform are the prov-inces of Zhejiang, Jiangsu, Anhui, Hunan and Shandong. Taihe County, Jiangxi Province, the network shop sales are relatively low. Therefore, using this as a case, excavating valuable information from customer evaluation data can infer the causes of such phenomena, and provide valuable advice to farmers in the country of origin to help them improve their product competitiveness.
2. Literature Review
re-DOI: 10.4236/ojs.2018.83026 403 Open Journal of Statistics
search on rural e-commerce. These studies fully affirmed the positive role of ru-ral e-commerce in promoting ruru-ral economic development [1]. Poole [2] thinks that the development of e-commerce can promote information flow, facilitate industry coordination, increase market transparency and price discovery. Ani-taKelles-Viitanen [3] believes that information technology has a positive role in promoting anti-poverty, can promote economic development, promote fair supply of education and health, and improve government transparency and people’s participation rights. To this end, many international agencies, including the World Bank, have proposed plans for the use of technologies such as infor-mation and communications for poverty alleviation, which include IN4D (In-formation Technologies for Development), ICT4D (In(In-formation & Communi-cation Technologies for Development), ICT4P (Information & CommuniCommuni-cation Technologies for Poverty Reduction).
DOI: 10.4236/ojs.2018.83026 404 Open Journal of Statistics
service stations. Logistic institutions have swarmed into the market, and sup-porting services have been provided by multiple agencies. Repeated construction not only causes serious waste of resources, but also causes serious interference with rural economic development and industrial restructuring and upgrading. Deviations in government systems and policies, vicious competition in e-commerce companies, various types of rural economy, and decentralized re-sources are the key reasons for problems in the construction of county e-commerce service systems. In order to guide the healthy development of rural e-commerce, it is necessary to clarify the idea of rural e-commerce development to serve the direction of fostering, agglomeration, and upgrading of rural indus-tries. We must promote the three-tier e-commerce service system in rural areas with the idea of supplying public goods or quasi-public goods, and support the construction of logistics service system, change the mode of construction of ru-ral infrastructure and service projects that spread the net and generu-ral support, and reduce the construction and operate costs of rural e-commerce service sys-tem based on guiding the proper concentration of rural supply and consumption [8].
The current research mainly focuses on the macro level, focusing on the cur-rent status of the development of e-commerce in rural areas, existing problems, and suggestions for countermeasures. There is relatively little analysis at the mi-cro level. The research on rural e-commerce products in rural areas is not much focused, especially the study of text data mining for consumer evaluations. Therefore, the use of computers to apply the latest statistical learning methods for deeper differentiation of the traditional numerical data analysis has certain research value and practical significance.
3. Evaluate Data Mining Process Design
3.1. Evaluate Data Mining Process Design
Since the 21st century, e-commerce platforms have continued to be sought after by users. They are known for convenience, real-time, and high-quality, low-cost. China’s most famous and earliest e-commerce platform is Taobao. When users purchase products on Taobao platform, they usually leave the most important text data evaluation. If we can excavate and analyze the evaluation data left by the users and sensitively capture the signals, we can provide consumers with better services, seize the hearts of consumers, and cultivate consumer loyalty.
DOI: 10.4236/ojs.2018.83026 405 Open Journal of Statistics
years and the dynamic score is relatively low. Therefore, intuitively, it can be preliminarily judged that the former is relatively late to start, the accumulated experience is not much, and the number of customers is relatively small; while the latter is relatively early to start, there are more customer groups, and the drainage capacity of these customer groups is stronger. It can be preliminarily judged that the latter has a higher level of e-commerce.
Based on the evaluation of text data mining, you can better understand the status of a product in the user’s mind. The overall mining objectives are: firstly, to use crawler technology to obtain user evaluation data; secondly, to use Chi-nese customers with effective sentiment orientation to comment on emotional texts to balance corpus, and to use a TF-IDF-based Chinese emotional text clas-sification model; thirdly, the K-means algorithm is applied in Chinese emotional text clustering analysis to obtain consumers’ effective information for different product reviews and to distinguish between positive and negative customer evaluations; fourthly, the above analysis results are combined; and finally the advantages and disadvantages of the two online shops by comparison.
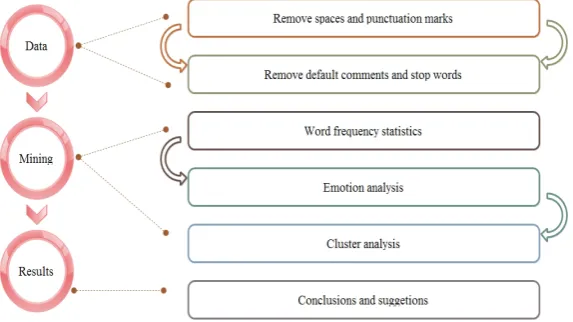
3.2. The Overall Process
Abbreviations and acronyms are the first time used in the text, even after they have been defined in the abstract. Abbreviations such as IEEE, SI, MKS, CGS, sc, dc, and rms do not have to be defined. Do not use abbreviations in the title or heads unless they are unavoidable. Due to the unstructured nature of text data and the large amount of data, general data analysis tools do not handle such data efficiently. The research software used is Python, which has a history of 20 years. The main steps are as follows: 1) Model preparation: using python’s crawler technology to obtain evaluation text data from two shops’ review details website, and storing it as an Excel recognizable csv format file; 2) Model establishment: after processing, the model performs feature extraction, feature classification and other operations, and establishes word frequency statistical models, senti-ment analysis models, and cluster analysis models for review data; 3) Model ap-plication: write Python code based on theoretical basis; 4) Conclusions and sug-gestions: comprehensive program operation results, give conclusions and make relevant recommendations.
3.3. Evaluation Data Acquisition
DOI: 10.4236/ojs.2018.83026 406 Open Journal of Statistics
3.4. Data Preprocessing
Data preprocessing mainly includes the following three aspects. First, remove spaces and punctuation marks. Considering the particularity of the symbols in Chinese texts, the following factors should be taken into account when removing spaces and punctuation marks: 1) Enter the numbers 0 - 9 in the half-width for-mat, with the English characters (case-sensitive); 2) In the full-width forfor-mat, en-ter numbers 0 - 9, English characen-ters (case-sensitive); 3) Complete sets of com-monly used mathematical symbols and possible language symbols in other lan-guages. Second, remove the default praise and “military commentary.” The de-fault praise, that is to say, the user did not evaluate in time after receiving the product, and the Taobao platform automatically gives praise. The “military force” is usually understood as a shop where people want to intervene in order to get good reviews on their own shops, hire their own friends, colleagues or other people to swipe their orders, and give evaluations based on non-real transactional traffic to attract other people, for the purpose of attracting other customers. This behavior is often forbidden by Taobao, and it also makes users feel shameless. Therefore, when users purchase products on Taobao platform, they must be vigilant to prevent the purchase of products that are full of false positives and cause problems in their purchased products. Third, remove the stop words. In information retrieval, some words or words are usually filtered to improve search efficiency and storage space. These filtered words or words are called stop words.
In the end, through the above data preprocessing process, 939 valid tie data were screened out for THWJSP flagship stores, and 1125 effective evaluation da-ta were recorded for HFX flagship stores; the effective rate of the former evalua-tion data was 63.83%, and the evaluaevalua-tion data of the latter which was effective was 62.28%.
3.5. Chinese Word Segmentation
The Chinese word segmentation is a process of re-encoding the Chinese charac-ters in a sentence according to certain rules to form a new sequence. It is a ne-cessary process for other text analysis. In natural language processing, words are often the smallest unit of natural language, with independent grammar and se-mantics; in order to deal with natural language, it is necessary to choose a unit to divide and process language. In Western languages, words and words are often marked with distinctions, usually spaces, so no other processing is required. In Chinese languages, there is no clear separation mark, so after splitting, the study can be conducted. In addition, words need to be word-marked.
DOI: 10.4236/ojs.2018.83026 407 Open Journal of Statistics
segmentation system. Compared with Western text classification, Chinese text classification is an important part of text data preprocessing. Segmentation of Chinese text processing is the most important part of text preprocessing. At present, the word segmentation technology can mainly be carried out from three perspectives. The first—the dictionary rule, the second—artificial intelligence, and the third—corpus, and the three angles form three methods respectively, and in turn form the primary stage to the advanced stage.
4. Methodological Basis
4.1. Word Frequency Statistics
In order to be able to achieve an accurate representation of the evaluation text, we segmented the text based on a statistical method and counted the frequency of occurrence of each word. From the point of view of the form and content of the document, the word is a relatively stable combination. Therefore, in a full-text environment, the greater the number of adjacent words appears at the same time, the more likely that the adjacent word combination constitutes a word. This is the basic principle of word frequency statistics. This technology has developed several different statistical principles so far.
1) Principle of mutual information
The mutual trust information for the Chinese character combination is de-fined as the following formula.
(
)
( ) ( )
2,
log P A B
P A P B
= (1)
Mutual information reflects the closeness of the connection between Chinese characters. When this level is higher than a certain value, there is reason to be-lieve that the word combination may constitute a word. Among them, the prob-ability that the Chinese character string appears, the probprob-ability that the Chinese character string appears, and the probability that the Chinese character string will appear in combination.
2) Matching-based word frequency statistics method
Statistical methods based on word frequency mainly have the following ma-ture algorithms: BF algorithm, KMP algorithm, and BM algorithm. The first al-gorithm is relatively simple and intuitive, but it involves multiple backtracking, so the efficiency is not high; the time complexity is O(m n∗ ); the second
algo-rithm overcomes the disadvantage of multiple backtracking, each character in the text string matches only one time, thus greatly improving the efficiency of pattern matching; the time complexity is O(m n+ ); the third algorithm is to achieve a jump-style matching; the time complexity is O(m n∗ ), but its optimal situation; the time complexity is O(n m).
3) N-Gram statistical model
DOI: 10.4236/ojs.2018.83026 408 Open Journal of Statistics
is set to W W1, , ,2 ⋅⋅⋅Wn. The likelihood of this substring can be expressed by the following equation.
(
1 2 1)
1
( ) n i i n i n i
i
P W P W W− +W− + W− =
= ∏ ⋅⋅⋅ (2)
It is not difficult to see that in order to predict the frequency of occurrence of n
W , it is necessary to know the probability of occurrence of all words in front of it. From a computational point of view, this method is too complicated. There is also a relatively simple language model called a tri-gram. The formula is as fol-lows.
( )
1(
2 1)
3,(
2 1)
( ) i i i
i n
P W =P W P W W =∏ P W W W− −
(3)
Symbol i= ⋅⋅⋅∏3, nP W W W
(
i i−2 i−1)
indicates probabilistic concatenation. These probabilistic parameters can often be calculated from large-scale corpus, such as the ternary probability formula as follows.(
)
(
(
2 1)
)
2 1
2 1
i i i
i i i
i i
count W W W P W W W
count W W
− −
− −
− −
≈ (4)
In the above formula, count
( )
⋅⋅⋅ represents the cumulative number of oc-currences of a particular word sequence in the entire corpus.In this paper, when the word frequency statistics work, the main model used is the N-Gram statistical model.
4.2. Text Sentiment Analysis
Sentiment analysis, also known as opinion mining and propensity analysis, can be further subdivided into: emotional tendency analysis, degree analysis, subjec-tive and objecsubjec-tive analysis, and so on. The purpose of the emotional tendency analysis is to guess whether the part of speech of the text is derogatory, neutral or ambiguous. However, in most cases, we only classify it into two categories: “disgust” and “favorite”. The degree analysis is mainly to further subdivide the analysis of sentiment tendency so as to achieve the description of the degree. For example, “interest” and “love” are all ambiguous words, but the degree of the latter will be stronger. The subjective and objective analysis is mainly to distin-guish which statements in the text are objective and which are descriptions with subjective colors.
DOI: 10.4236/ojs.2018.83026 409 Open Journal of Statistics
process. The main method we use here is based on the second method. Com-pared to the first method, statistical learning does not pay much attention to the emotional words contained in the articles that need to be analyzed, and it is more dependent on the “Label” artificially given during training, which is the so-called label, and the result of this processing method is good. The result often depends on the size of the corpus and the accuracy of corpus tagging.
First of all, the text vectorization process needs to be understood. It is the most important step of text structuring because it tells the computer what struc-ture to use to understand the text. The two main models that are more main-stream are: word bags and vector spaces. The two models have in common that they all cut vocabulary as a minimum granularity, such as splitting the word “I”, “Yes” and “Chinese”. The number of occurrences of each word sets the weight of the word, which can be converted into a vector of [1, 1, 1] form. But on the basis of the first model, the second model also integrates the multiple word bag models to form a two-dimensional matrix called a word-document, in which words are also called features. In summary, the former is the basis of dic-tionary sentiment analysis; the latter is mainly applied to large-scale corpus.
TF-IDF is a statistical method for assessing the importance of a word for one document set or one of the documents in a corpus. The importance of a word increases in proportion to the number of times which appears in the document, but at the same time it decreases inversely with the frequency of its appearance in the corpus. The various forms of TF-IDF weighting are often applied by search engines as a measure or rating of the degree of correlation between doc-uments and user queries. In addition to TF-IDF, search engines on the Internet also use a link-based rating method to determine the order in which files appear in search results.
TF-IDF is composed of two parts: TF and IDF. TF is the word frequency we usually refer to. The main function of textual vectorization mentioned above is to count the frequency of each word in the text. It is better understood. Behind the IDF, the inverse text frequency is more difficult to understand. It indicates the frequency of occurrence of a word in all texts. If the frequency of occurrence is high, then its IDF value is relatively low; and vice versa, if this frequency is compared Low, then its IDF value is relatively high. The more extreme example is that if a word appears in all texts, its IDF value should be zero. Following the quantitative analysis, here is a basic calculation formula for the IDF of a word.
( )
( )
IDF x log N
N x
= (5)
DOI: 10.4236/ojs.2018.83026 410 Open Journal of Statistics
common IDF smoothing formula.
( )
( )
1IDF log 1
1 N x N x + = +
+ (6)
with the definition of IDF, we can calculate the value of a word.
( )
( )
( )
TF IDF− x =TF x ∗IDF x (7)
Among them, TF(x) means the word frequency of the word in the current text.
In addition, the naive Bayes algorithm is also used. The entire naive Bayes classification is divided into three phases. The first phase is the preparation phase. The main task of this stage is to make the necessary preparations, deter-mine the attributes of the features according to the specific conditions, and make appropriate divisions of the attributes, and then need to manually intervene in the classification, and finally form a sample training set. The second stage is the classifier training phase. Its input is a feature attribute and a training sample, and the output is a classifier. This process is automatically run by the computer program, so the rationality of the code is more important. The third phase is the application phase. Use our built classifier to classify and test how well it works.
4.3. K-Means Cluster Analysis
Since the text does not have a label at the beginning, and the workload is too large to be manually added, a large number of training samples cannot be estab-lished within a limited time, so the text is considered to be clustered.
The K-means clustering algorithm mainly wants to solve the problem of di-viding a set of data points into clusters. The algorithm has the following four major steps.
1) Select the initial cluster center. 1 1 1 1, , ,2 k
Z Z ⋅⋅⋅Z , where, the parenthesis
num-ber is the sequence numnum-ber of the iterative operation for finding the cluster cen-ter. The vector value of the cluster center can be arbitrarily set. For example, the vector value of the optional start pattern sample is used as the initial cluster cen-ter.
2) One by one, sample classified patterns
{ }
x are assigned to one of the cluster centers according to the minimum distance criterion 1j
Z . For all
, 1,2, ,
i j j≠ = ⋅⋅⋅k, if 1 1 1 1, , ,2 k
Z Z ⋅⋅⋅Z , then k j
x S∈ , where k is the sequence number of the iterative operation, the first iteration k = 1, Sj represents the cluster j, and
its clustering center is Zj.
3) Calculate new vector values for each cluster center.
( ) ( ) 1 1 k j k j
j X S
Z X
N +
∈
=
∑
(8)where Nj is the number of samples included in the cluster Sj. Taking the mean
vector as the new clustering center, the following clustering criteria function J
DOI: 10.4236/ojs.2018.83026 411 Open Journal of Statistics
( )
( )
2 1
1 K
j
K
k j
j X S
J X Z +
= ∈
=
∑ ∑
− (9)4) If ( )k (k 1)
j j
Z ≠Z + , j=1,2, ,⋅⋅⋅k, then return to the second step, re-classify
the pattern samples one by one and repeat the iterative operation; if
( )k (k 1)
j j
Z ≠Z + , j=1,2, ,⋅⋅⋅k, the algorithm converges and the calculation ends.
The determination of K-means clustering method parameters is mainly based on: mean variance as a standard measure function. When the optimal clustering effect is achieved, the mean squared error is the smallest. The k clusters have the following characteristics: Each cluster itself is as compact as possible, and clus-ters are separated as much as possible.
5. Evaluation Data Mining Results
5.1. Word Frequency Statistics
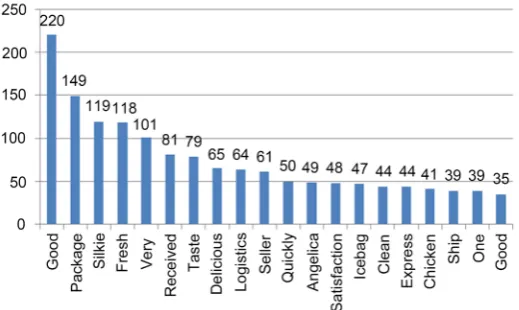
The word frequency statistics are separately performed on the review informa-tion, and the number of repeated keyword occurrences is calculated, and then the word frequency statistics are sorted in order from largest to smallest. The results of the top 20 entries are shown in the following figure.
In order to more easily extract the information features in Figure 1, you can consider converting the word frequency into a word cloud map. The size of the word cloud in the word cloud map indicates the frequency or frequency of the word in the evaluation. The larger the word, the more frequently the word ap-pears, the higher the frequency.
[image:11.595.231.518.545.706.2]A careful comparison between Figure 2 and Figure 3 shows that the top five words in the evaluation data of the two e-shops are: “Nice”, “Silkie”, “Received”, “Packaging” and “Fresh”; “packaging”, “silkie”, “fresh”, “very”, repeated four words, regarding to “very” and “accepted” there are differences. The word with excavation meaning lies in the words “really” and “authentic” which appeared in the THWJSP flagship store, indicating that consumers have higher recognition of the quality of the former and believe that their taste is pure. In the evaluation of HFX flagship store, the words “ice pack”, “clean”, “express” and “logistics”
DOI: 10.4236/ojs.2018.83026 412 Open Journal of Statistics
Figure 2. THWJSP flagship store statistics frequency analysis.
Figure 3. HFY flagship store statistics frequency analysis.
appeared, and the packaging was in the second position, so the intuitive reflec-tion of its advantages lies in its exquisite packaging and attractive products. Faster logistics benefits from the support of developed e-commerce infrastruc-ture in Zhejiang. It is more intuitive to draw out the word cloud diagrams of the two. The word cloud diagram includes words that are not involved in the fre-quency statistics table, so it is relatively more comprehensive. After comparison, it was found that the “packaging” of the HFX flagship store word cloud map is even larger than that of the THWJSP flagship store “packaging”.
5.2. Text Sentiment Analysis
Through the analysis, a score table for sentiment analysis of the evaluation data of the two stores was discovered, as follows. As can be seen from Table 1, the score of the THWJSP flagship store is slightly lower than that of the HFX flag-ship store. The reason is that there are more positive sentiment evaluations in HFX flagship stores.
5.3. K-Means Cluster Analysis
[image:12.595.245.505.267.422.2]DOI: 10.4236/ojs.2018.83026 413 Open Journal of Statistics
Table1. Text sentiment analysis score sheet.
Emotional tendency THWJSP HFY
Negative affective tendency 265 378
Positive affective tendency 673 742
Emotional evaluation score 515.05 520.46
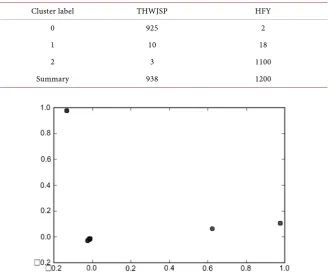
being 0, 1, and 2 in order. The following table shows the classification results of the sub-stores (the two stores are separated in sequence). From Table 2, we can see that whether the THWJSP flagship store or the HFX flagship store, the re-sults after clustering show a common law: very concentrated, such as the THWJSP flagship store’s “2” class label accounted for 938 very few, so most of the evaluations are homogenous.
After using PCA to reduce the multidimensional to 2 dimensions, x axis represents the first principal component score and the y axis represents the second principal component score. Most of the samples in Figure 4 are concen-trated at certain points and the effect is not particularly satisfactory. However, the contents reflected in Table 2 are the same.
6. Conclusions and Recommendations
6.1. Conclusion
From the previous evaluation data mining process analysis, the following con-clusions can be drawn: 1) The evaluation of THWJSP flagship store and HFX flagship store reflects different advantages and disadvantages, and the evaluation of customers is different; the main advantage of the former is that the taste is authentic and the product is genuine; the latter’s main advantage lies in its good packaging and fast logistics. 2) The comprehensive text sentiment score of the THWJSP flagship store is slightly lower than that of the Everest Source flagship store. 3) Through K-means cluster analysis, the most of the three types of clus-tering tags of evaluation data were concentrated in one of the three tags.
6.2. Suggestions
The research proposal is mainly based on the THWJSP flagship store. Its main advantage is its authentic taste and its origin is in the country of origin. Howev-er, its geographic information is relatively obstructed, e-commerce is lagging be-hind, and the art and logistics system is relatively weak. Therefore, it is aimed at rural origin e-commerce. The product makes the following suggestions.
1) On the basis of existing brands, to strengthen the art design, you may consid-er recruiting a professional UI design team from the outside, or ask the designconsid-er to optimize the overall artwork of the store on a regular basis, so that the prod-uct is not packaged and advertised. It will look backward.
DOI: 10.4236/ojs.2018.83026 414 Open Journal of Statistics
Table2. K-means clustering statistics.
Cluster label THWJSP HFY
0 925 2
1 10 18
2 3 1100
Summary 938 1200
Figure 4. Cluster analysis scatter plot (x axis represents the first principal component score and the y axis represents the second principal component score).
and activities, and find resources for multiple platforms to integrate. In particu-lar, it is necessary to pay attention to the data analysis of the store flow. If neces-sary, a data miner can be hired to conduct routine excavation, sorting, and anal-ysis of the data, and pay close attention to data analanal-ysis under abnormal fluctua-tions.
3) The current e-commerce competition is very fierce, especially after the emergence of the micro-business team. The products on the Internet are uneven, so the store in the SEO optimization at the same time pays more attention to their own brand protection and quality checks. Make full use of social platforms, such as WeChat’s public number function (a small program), as an important channel for event promotion and channeling potential customers, and maintain active interaction with customers and transform traffic.
Acknowledgements
DOI: 10.4236/ojs.2018.83026 415 Open Journal of Statistics
and the Middle-Income Trap from the Perspective of Double-Creating” (Project No. TJ161002).
References
[1] Wu, M.C. (2002) Information Poverty Alleviation—Development of E-Commerce Countermeasures in Poor Areas. Social Welfare, 7, 45-47.
[2] Nicolaisen and Royce (2001) How Will Agricultural E-Markets Evolve. Agricultural Outlook Forum, United States Department of Agriculture, Washington DC, 22-23. [3] Kelles-Viitanen, A. (2005) The Role of ICT in Governing Rural Development. IFAD
Workshop on the What Are the Innovation Challenges for Rural Development, Rome, November 2005, 11-14.
[4] Xie, T.C. and Shi, Z.L. (2016) Rural Electronic Commerce Development Status, Ex-isting Problems and Countermeasures. Modern Economy, 11, 40-44.
[5] Hong, Y. (2016) The Restrictive Factors and Promotion Policies of China’s Rural E-Commerce Development. Business Economics Research, 4, 169-171.
[6] Li, D. and Fu, Q. (2017) Analysis on the Development of Agricultural Products E-Commerce in Gansu Province. Financial Theory and Teaching, 3, 78-80.
[7] Wu, W.Q. and Li, Z.X. (2017) Research on Problems and Model Innovation of China’s Fresh Agricultural Products E-Commerce Development. World Agricul-ture, 6, 213-217.