Multilevel Thresholding Segmentation based on Otsu’s
Method and Autonomous Groups Particle Swarm
Optimization for Multispectral Image
Murinto
Departement of Informatics Engineering Universitas Ahmad Dahlan Yogyakarta
Adhi Prahara
Departement of Informatics Engineering Universitas Ahmad Dahlan Yogyakarta
ABSTRACT
Segmentation is a process of division of images into certain regions based on certain similarities. Multispectral image consists of several bands with high dimensions, requiring a different method with the problem of low-dimensional images. Multilevel thresholding problems based on Otsu criteria are discussed in this paper. One disadvantage of the Otsu method is that computing time increases exponentially according to the number of thresholding dimensions. In this paper, the Particle Swarm Optimization (PSO) algorithm combined with the Otsu Method called multilevel thresholding Autonomous Groups Particles Swarm Optimization (MAGPSO) is proposed to reduce the two problems of PSO entrapment in the local minima and the slow rate of convergence in solving high dimensional problems. MAGPSO is used for multilevel thresholding image segmentation. The performance of MAGPSO is compared with standard PSO on three natural images. The parameters used to compare the performance of MAGPSO and PSO are the best fitness value, optimal threshold obtained from each algorithm and the measurement of the quality of segmentation results, namely: SSIM, PSNR, and MSE. From the experimental results show that MAGPSO is better when compared to PSO in image segmentation, in terms of the resulting fitness value and higher SSIM and PNSR values.
General Terms
Particle Swarm Optimization, Multispectral Image Segmentation
Keywords
Darwinian Particle Swarm Optimization, Hyperspectral Image, Support Vector Machine
1.
INTRODUCTION
Image segmentation is a process of division of images into certain requirements in certain regions. In practical applications, image segmentation not only divides the image into several regions of different characteristics, but extracts the target region accordingly. The segmentation method can be divided into two categories namely supervised and unsuprvised. If the image is divided into two parts, such as background and foreground, this is called thresholding. Bi-level thresholding can be expanded into multi-Bi-level thresholding.
In the traditional thresholding method there are two types of approaches. First is the Otsu Method [1] which maximizes variance between classes. Whereas the second is the Kapur’s [2] method which uses entropy maximization to measure homogeneity among classes. Their efficiency and
effectiveness have been proven in segmentation using bi-level thresholding [3]. Although bi-level can be extended to multi-level thresholding, one of the disadvantages is that the complexity of high processing time increases exponentially when a new threshold is added [4]. This makes the thresholding method inefficient when applied to multi-level thresholding.On the other hand, there are various evolutionary optimization methods that are widely used in overcoming optimization problems that have proven effective. There are several known evolutionary methods including genetic algorithm (GA) and particle swarm optimization (PSO). Both of these algorithms are widely used in optimization problems [5]. From previous research in [6] [7] [8], PSO is more efficient and appropriate if used to find the optimal threshold in multi-level thresholding. However, as in general the PSO algorithm one of the disadvantages is trapped in optimal local and premature convergence in handling complex optimization problems [9].
On the other hand, a modified variant of the Particle Swarm Optimization (PSO) algorithm called Autonomous Groups Particles Swarm Optimization (AGPSO) [10] has been proposed to reduce the problem of being trapped in local minima and the slow rate of convergence in high dimensional problems. The main idea of the AGPSO algorithm is inspired by the diversity of individuals in groups of birds or insects. Different functions with various slopes, arcs, and points of interception are used to adjust the social and cognitive parameters of the PSO to provide different behavioral particles as in natural colonies
2.
MATERIAL AND METHODOLOGY
2.1 Multilevel Thresholding Autonomous
Group Particle Swarm Optimization
The basic idea of PSO is to involve a scenario where a flock of birds in the search for food in an area. All birds do not know exactly where the food is, but with each iteration they will know how far the food will be found. The best strategy will be followed by birds close to food and also from the previous best position achieved. PSO was built with the concept of optimization through a swarm particle. The PSO algorithm is a multi-agent parallel search technique that maintains a particle swarm and each particle represents a potential solution in the swarm. All particles fly through the multidimensional search space by adjusting their position based on their own experience and from their neighbors. The original PSO algorithm is written in the form of velocity updated and position updated (Kennedy and Eberhart, 1995) [11] as shown in equation (1) and equation (2) respectively.
(1)
(2)
Where dan are positive constants, called the acceleration coefficient. and are two ranmdom numbers with values within ranges [0,1]. W is inertia weight.
The concept of autonomous groups is inspired by the diversity of individuals within a group of animals or a group of insects. In some cases, individuals are not quite similar in terms of intelligence and ability, but they all carry out their respective duties as members of the group. Each individual is able to work in any situation. In standard PSO, all particles have the same behavior in terms of local and global search (local and global search), so the particles are considered as a group with the same strategy.
However, using autonomous groups with a common goal in any population-based optimization algorithm, theoretically can produce more randomized and directed searches simultaneously. In the autonomous mathematical model groups consist of different strategies for renewal and . The renewal strategy of autonomous groups can be applied with various continuous functions at intervals [0, 1]. Some functions can be used to update cognitive factors ( and social factors ( . These functions consist of ascending or descending linear and polynomial, as well as exponential and logarithmic functions. In Figure 1 an update is shown and , where the curve is blue for renewal while the curve is red for update . From the figure it appears that decreases according to the iteration, while increases. From this it is clear that the particles tend to have higher local search capabilities when mpre higher than
2.3 Multispectral Image Segmentation
Otsu thesholding is a non-parametric method for segmentation that divides the whole image into classes so that the variance of the different classes is maximum. In his research, Otsu (1979) [1]. defines variance between classes as a sum of the Sigma functions of each class, which are written as equations (3).
(3)
Where is the average intensity of the original image.
In the bi-level thresholding, mean level for each of classes ( can be written as equations (4).
(4)
The optimal threshold is obtained from the maximization function between class variances, which is written as an equation (5).
(5)
As for the multitresholding problem, the Otsu method can be written as
(6)
n multilevel thresholding, the mean level of each class ( can be written as equations (7).
(7)
The optimal multilevel threshold is obtained by maximizing the variance between classes of functions, which is written as an equation
(8)
Threshold method is a method that is generally used in image segmentation to separate important targets from the background image. This is the basic principle for dividing image pixels into different regions through determining threshold features. A common threshold segmentation can be explained as follows: Assume there is a certain threshold and the image is divided into two groups of pixels with, one (target) with a threshold greater than the other (background) with a lower threshold value (T). There are two types of threshold segmentation methods: single and multi-threshold. At the bi-level thresholding the image pixels with gray levels below the T value will be assigned to one group , s while m pixels t with gray levels above T will then be included in another group, . At the end of the thresholding process, an image I will be grouped into two groups. If an image I is assumed to be represented through gray level L scale, then bilevel thresholding can be defined as an equation (9).
(9)
Multilevel thresholding uses more than one threshold value and produces an image with several groups.
(10)
Where is the- i threshold value and n is the threshold number.
3.
EXPERIMENT RESULT AND
ANALYSIS
In this study, the proposed strategy is applied to multilevel thresholding image segmentation which was tested on 3 multispectral images (3 bands), namely Lena image, mandrill image and airplane image. Each image has the same size (512 x 512 pixels), and the format used is JPEG. The simulation is done using MATLAB R.2017b programming on an Intel Core i5-4210U 2.40 GHz processor with 4 GB RAM, as shown in Table 5.1.
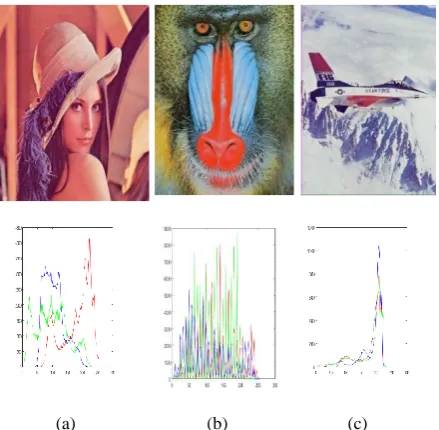
The effectiveness and feasibility of the proposed approach for multilevel thresholding is carried out by maximizing between class variances (Otsu method), with the aim of selecting the best thresholding value and higher objective function values with rapid convergence. In Figure 5.3, 3 multispectral images and image histograms corresponding to the 3 band components (R, G, B) are shown.
[image:3.595.356.501.71.140.2](a) (b) (c)
Figure 2: Multispectral image and its histogram (RGB component) (a) Lena image, (b) Mandrill image, (c)
Airplane image
MAGPSO algorithm used in this study is compared with the standard PSO algorithm. The threshold number used in this test is m = 2,3,4,5. In this study, stop criterion is the number of iterations where the best fitness value is achieved. The initial values of the parameters of the MAGPSO and PSO algorithms used in this study are shown in Table 1.
Table 1: PSO and MAGPSO Initial Parameter Values
Parameter PSO MAGPSO 0.8 C1G1
0.8 C1G2
Population 150 150 IterasiMax 500 500
w 1.2 -
wmax - 0.9
wmin - 0.4
vmin -5.0 -5.0
vmax 5.0 5.0
Where C1G1 and C1G2 can be written as equations (11) and (12), respectively.
C1G1= (-2.05/IterasiMax)*1+2.55 (11) C2G2= (1/-2.05/IterasiMax)*1+1.25 (12) Performance evaluation of the optimization algorithm used in image segmentation in this research proposal is measured through several quality measurement values. First, the peak signal to noise ratio (PSNR) quality index is used to measure the similarity of the image segmentation results to the reference image (image before segmentation) which based on the results of the mean square error (MSE), where MSE is calculated from the average intensity of the square of the original image (input) and the resulting image pixel (output). MSE and PSNR values are defined in equations (13) and equations (14).
(13)
Where x (i, j) represent the original image (reference) and y (i, j)) represent the segmented image. Whereas i and j represent the pixel position of the image size M x N. Signal-to-noise ratio (SNR) is a mathematical measure of image quality based on the pixel difference between the two images. The size of the SNR is an estimate of the quality of the segmented image compared to the original image. PSNR is defined as equation (14).
(14)
Where s = 255 for an 8 bit image (Gray scale). PSNR is basically SNR when all pixel values are equal to the maximum likelihood value [12]. Second, Structural index similarity index metric (SSIM) introduced by Wang (2002) [13]. Introduce where the average of the structural similarity index is calculated as follows:
(i). the original image and segmentation image are divided into blocks with a size of 8 x 8 and then the block is converted into vector-vetor.
(ii). Two mean values and two standard deviations and one covariance are calculated using equations (15), (16) and (17).
, (15)
, (16)
(17)
(iii). Structural similarity index metric (SSIM) between image x and image y can compute by equation (18).
(18)
Where and are constant.
[image:3.595.55.275.308.523.2]Table 2, Table 3, and Table 4. m is level threshold. Optimal threshold values obtained using PSO and MAGPSO for 500
[image:4.595.129.470.109.465.2]iterations, fitness values, and PSNR, SSE, SSIM values are shown sequentially in Table 5, Table 6.
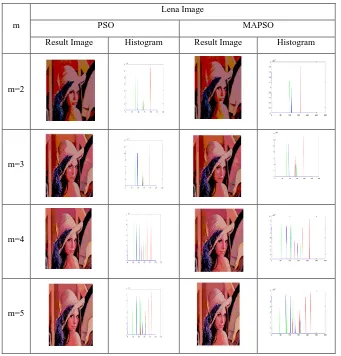
Table 2: Image Results and Histograms Using PSO and MAGPSO on Lena Multispectral Image
m
Lena Image
PSO MAPSO
Result Image Histogram Result Image Histogram
m=2
m=3
m=4
[image:4.595.112.486.502.716.2]m=5
Table 3. Image results and histograms at level m = 2,3,4,5 Multilevel Thresholding Using PSO and MAGPSO on Mandrill Multispectral Images
m
Mandrill Image
PSO MAGPSO
Result Image Histogram Result Image Histogram
m=2
m=4
[image:5.595.113.490.70.222.2]m=5
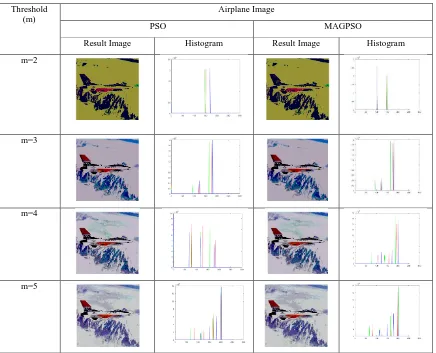
Table 4: Image results and histograms at level m = 2,3,4,5 Multilevel Thresholding Using PSO and MAGPSO on roplane Image
Threshold (m)
Airplane Image
PSO MAGPSO
Result Image Histogram Result Image Histogram
m=2
m=3
m=4
[image:5.595.82.518.260.613.2]m=5
Table 5: Comparison of optimal threshold values of the Otsu method using the PSO and MAGPSO optimization algorithms on Multispectral Images
Image m Band OptiMal Threshold Values Fitness Value
PSO MAGPSO PSO MAGPSO
airplane 2 R G B
150 147 9
150 147 170
1.6267e+03 2.2136e+03 768.2909
1.6267e+03 2.2136e+03 768.2909
G B
93 165 124 181
93 165 124 181
2.4363e+03 930.7811
2.4363e+03 930.7811
4 R G B
106 157 195 77 137 188 121 172 200
106 157 195 76 137 188
9 19 161
1.8564e+03 2.5341e+03 971.1291 1.8564e+03 2.5341e+03 966.3493 5 R
G B
83 126 169 199 66 116 164 201 112 150 180 203
83 125 168 198 66 115 163 201 112 150 180 203
1.9019e+03 2.5877e+03 994.9229 1.9019e+03 2.5876e+03 994.9229
Lena 2 R
G B 161 102 112 161 102 30 1.8857e+03 1.9200e+03 781.5073 1.8857e+03 1.9200e+03 781.5073
3 R G B
136 195 77 145 95 140
136 195 77 145 95 140
2.1837e+03 2.3936e+03 1.0049e+03 2.1837e+03 2.3936e+03 1.0049e+03 4 R
G B
126 175 211 56 106 159
4 129 173
126 175 211 56 106 159 82 109 146
2.2726e+03 2.5980e+03 1.0560e+03 2.2726e+03 2.5980e+03 1.0700e+03 5 R
G B
116 156 189 217 46 83 119 164 80 105 133 163
116 156 190 217 46 83 119 163 80 105 133 163
2.3224e+03 2.6757e+03 1.0971e+03 2.32245+03 2.6757e+03 1.0971e+03
Mandrill 2 R G B 133 120 119 132 120 119 2.2077e+03 1.7479e+03 2.8816e+03 2.2077e+03 1.7479e+03 2.8816e+03 3 R
G B
105 173 87 144 80 156
105 173 87 143 80 156
2.7261e+03 2.0715e+03 3.4548e+03 2.7261e+03 2.0715e+03 3.4548e+03 4 R
G B
80 128 184 77 118 159 68 118 180
80 128 184 77 118 160 68 118 179
2.9111e+03 2.1785e+03 3.6489e+03 2.9111e+03 2.1785e+03 3.6489e+03
5 R G B
69 109 152 200 69 103 136 167 45 81 127 183
69 109 152 200 69 103 136 168 45 81 127 183
[image:6.595.99.498.638.757.2]3.0061e+03 2.2344e+03 3.7227e+03 3.0061e+03 2.2344e+03 3.7227e+03
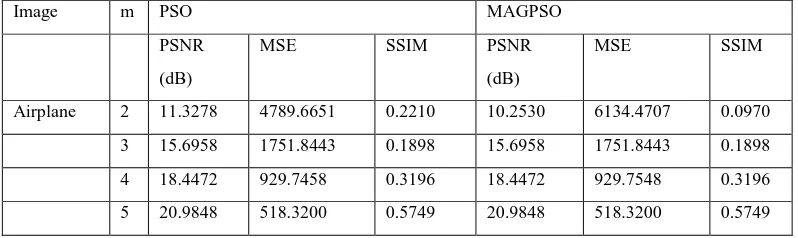
Table 6: Comparison of the Otsu method PSNR, SSE, SSIM using PSO and MAGPSO optimization algorithms on Multispectral Images
Image m PSO MAGPSO
PSNR (dB)
MSE SSIM PSNR
(dB)
MSE SSIM
Airplane 2 11.3278 4789.6651 0.2210 10.2530 6134.4707 0.0970
Lena 2 10.4509 5861.3112 0.4944 11.3296 4787.6585 0.5243 3 13.9959 2591.1639 0.6679 13.9959 2591.1639 0.6679 4 14.2179 2462.1741 0.6741 16.0327 1621.1074 0.7442
5 17.0782 1274.2655 0.7771 17.0763 1274.8157 0.7774 Mandrill 2 11.1402 5001.0972 0.4144 11.1627 4975.1658 0.4346 3 14.3382 2394.7740 0.6582 14.3104 2410.1048 0.6580
4 16.6803 1394.5376 0.7750 16.6925 1392.6055 0.7749 5 18.9141 834.0703 0.8489 18.9294 832.0392 0.8489
From Table 6 it can be seen that the objective functions obtained using the MAGPSO method are better when compared to PSO. While from Table 7 it can be seen that for the three test images, the PSNR, SSIM and MSE values obtained indicate the AGPSO method is better when compared to the PSO. From this research it can be said that the MAGPSO method is more compared to the PSO for the multispectral image segmentation process.
4.
CONCLUSIONS
In this paper a modified particle swarm optimization algorithm called MAGPSO is proposed to overcome two problems that arise in solving high dimensions. Both problems are trapped in the local minimum and the slow rate of convergence. The results show that PSO with autonomous particle groups outperform conventional and some recent modifications of PSO in terms of escaping from the local minimum and convergence speed. The results also show that dividing the particles into groups and allowing them to have different individual and social thoughts can significantly improve PSO performance.
5.
ACKNOWLEDGMENTS
The researchers expressed thanks to LPPM UAD who has funded this research with PHB scheme 2019.
6.
REFERENCES
[1] Otsu,N. (1979). A threshold selection method form gray-level histogram. IEEE Trans.Syst.Man.Cybern, Vol.SMC-9 no.1 pp62-66, Jan 1979.
[2] Kapur, J. N., Sahoo, P. K., & Wong, A. “A new method for gray-level picture thresholding using the entropy of [3] The histogram”, 1985, Computer vision, graphics, and
image processing, 29(3), 273-285.
[4] Yin, P. Y., & Chen, L. H, “A fast iterative scheme for multilevel thresholding methods”, 1997, Signal processing, 60(3), 305-313.
[5] Sezgin, M and Sankur, B., “Survey over image thresholdingtechniques and quantitative performance evaluation”, 2004, Journal of Electronic Imaging, vol. 13, no. 1, pp. 146–168.
[6] Sahoo, L., Banerjee, A., Bhunia, A. K., & Chattopadhyay, S, “An efficient GA–PSO approach for solving mixed-integer nonlinear programming problem in reliability optimization”, 2014, Swarm and Evolutionary Computation, 19, 43-51.
[7] Priya, M. S., & Nawaz, D. G. K, “Multilevel Image Thresholding using Otsu Algorithm in Image Segmentation”, 2017, International Journal of Scientific & Engineering Research, 8(5).
[8] Suresh, S., & Lal, S, “Multilevel thresholding based on Chaotic Darwinian Particle Swarm Optimization for segmentation of satellite images”, 2017, Applied Soft Computing, 55, 503-522.
[9] Talukder, S, “Mathematicle modelling and applications of particle swarm optimization”, 2010 Thesis, Blekinge Institute of Technology.
[10] Maitra, M., & Chatterjee, A, “A hybrid cooperative– comprehensive learning based PSO algorithm for image segmentation using multilevel thresholding”, 2008, Expert Systems with Applications, 34(2), 1341-1350. [11] Mirjalili, S., Lewis, A. & Sadiq, A.S. Arab J Sci Eng,
“Autonomous Partilce Groups for Particle Swarm Optimization”, 2014, 39: 4683.
[12] Eberhart, R., & Kennedy, J.”A new optimizer using particle swarm theory. In Micro Machine and Human Science, 1995. MHS'95.Proceedings of the Sixth International Symposium on (pp. 39-43). IEEE.
[13] Akay, B, “A study on particle swarm optimization and artificial bee colony algorithms for multilevel thresholding”, 2013, Applied Soft Computing Journal, vol. 3, no. 6, pp. 3066–3091.