Munich Personal RePEc Archive
Globalization and Financial Market
Contagion: Evidence from Financial
Crisis and Natural Disasters
Asongu, Simplice
15 January 2013
AFRICAN GOVERNANCE AND DEVELOPMENT
INSTITUTE
A G D I Working Paper
WP/13/035
Globalization and Financial Market Contagion: Evidence from Financial
Crisis and Natural Disasters
Simplice A. Asongu
African Governance and Development Institute, P.O. Box 18 SOA/ 1365 Yaoundé, Cameroon.
© 2013 African Governance and Development Institute WP/13/035
AGDI Working Paper
Research Department
Globalization and Financial Market Contagion: Evidence from Financial
Crisis and Natural Disasters
Simplice A. Asongu1
September 2013
Overview
With financial globalization, investors can gain from diversification if returns from financial
markets are stable and not correlated. However with volatility spillovers, increase in
cross-market correlations exist as a real-effect and are not taken into account for asset allocation and
portfolio composition. This chapter assesses financial contagion from two recent trends in the
world economy: the global financial crisis and the 2011 Japanese natural disasters (tsunami,
earthquake and nuclear crises).
1. Introduction
Globalization has been recognized as the principal force dominating the economic
universe. It upholds to illuminate the world with economic prosperity and seeks a victory of
market over government and self-interest over altruism. No less imperative is the global
commitment to continuing and accelerating the pace of human development, which indicate
the culmination of the historical processes of cultural advances. The dilemma however is that,
while the phenomenon is a lusty, ineluctable process whose march can be stopped only by
endangering the prosperity of peoples and nations, it also threatens to disfigure development
in the manner it is evolving. As a dynamic force for change throughout the world, it is
1
expected to stimulate unprecedented surges in the wealth of nations by extending outwards
the world production possibility frontier and redefining world markets as a “Global Village”. With growing efforts toward financial liberalization, financial integration among economies
has the benefit of improving allocation efficiency and diversifying risks. Despite these
potential benefits, recent trends in the global economy suggest that crises in one country can
easily spread to other countries through different channels as a result of financial
globalization. In this chapter, we assess whether global financial markets have been
vulnerable to contagion during some crises that have marked the global landscape in recent
memory, notably: the 2007 global financial crisis and the 2011 Japanese tsunami, earthquake
and nuclear crises. Hence, we aim to assess global evidence of financial market contagion
from financial crisis and natural disasters.
Over the past decade, the concern about regional and global integration of emerging
equity markets has been largely debated. The recent global financial meltdown and economic
downturn has left many analysts concerned about whether emerging markets suffered from
contagion (Asongu, 2012a). Most of these markets were still in their infancy before the start
of the millennium, which rendered an examination of the transmission of financial variable
movements from global crisis somewhat impractical. Hence, the effects of the US stock
market crash of 1987, the Mexican peso crisis of 1994, Asian currency crisis of 1997, Russian
and LTCM2 crises of 1998, Brazilian crisis of 1999 and Turkish 2000/2001 crisis have
unfortunately not been fully examined in all emerging equity markets. The recent financial
crisis has provided a golden opportunity for such an investigation.
Natural disasters have inflicted serious damages on human life, property and economy
(Asongu, 2012b). Though many earthquakes occur worldwide on a yearly basis and impact all
walks of life in one way or the other, collateral effects resulting from such natural disasters
could be quite detrimental financially and economically. The recent Japanese earthquake has
resulted in collateral damages that make the disaster particularly significant. On March 11,
2011, Tohoku in Japan was hit by a 9.0 magnitude undersea mega thrust earthquake. This
powerful shock triggered a tsunami that struck coastlines across the east of the country,
leaving thousands dead and inflicting considerable property damages. But what has startled
analysts and left them very concerned over the consequences of this earthquake is the nuclear
disaster resulting there-from. Classified as a level-seven event on the International Nuclear
Event Scale, the Fukushima nuclear incident has posed a risk equal to the worst nuclear power
2
plant accident in history (Chernobyl disaster). With much uncertainty over how the crisis
would have been managed, it is imperative to investigate how international financial markets
reacted three months into the crises. Therefore, the second goal of this chapter is to examine
whether any contagion effect occurred a few months after the Japanese earthquake, tsunami
and worst nuclear crisis since Chernobyl.
There are many reasons this chapter should be dedicated to studying the extent to
which financial markets have been affected by the recent financial and natural crises. Among
others, results of the studies could enable analysts and policy makers evaluate the benefits of
international trade and cross-border investments, and hence, the attractiveness of foreign
capital inflows. The results could also provide some basis on how developing countries stand
to benefit (loss) from (in) long-run investment sources and global financial booms (as a result
of external financial shocks) through financial market integration. The rest of the chapter is
organized as follows. Section 2 examine related literature with emphasis on the effects of
financial market integration, linkages between financial market integration and crises,
definitions and channels of contagion and, how to measure contagion. Section 3 provides
evidence of contagion from the 2007 global financial crisis in financial markets of developing
countries. In Section 4, global international stock indices and exchange rates are investigated
for contagion after the 2011 Japanese tsunami, earthquake and nuclear crises. We conclude
with Section 5.
2. Related literature
2.1 Effects of financial market integration
Financial integration between economies is believed to have two main positive
impacts: the improvement of capital allocation efficiency and diversification of risks
(Demyanyk and Volosovych, 2008; Coulibaly, 2009; Kose et al., 2011; Asongu, 2012ab).
However, the recent global financial crisis which is considered by many analysts and
policymakers as the worst since the Great Depression has cast a dark shadow on the contagion
effect of financial integration; despite its advantages. There is a broad economics and finance
literature that addresses the potential benefits of financial integration.
From a theoretical perspective, financial globalization should facilitate efficient
international allocation of capital and improve international risks sharing (Kose et al., 2011;
Asongu, 2012a). Asongu (2012a) posit that, the benefits are much greater for developing
countries because they are relatively scarce in capital and rich in labor sources. Accordingly,
has further professed that, since developing countries have more volatile output growth than
advanced industrial economies, their potential welfare gains from international risk sharing
are much greater. The findings of Kose et al. (2011) reveal that, with certain identifiable
thresholds in variables such as financial depth and institutional quality, the cost-benefit
trade-off from financial openness improves significantly once the threshold conditions are met.
Demyanyk and Volosovych (2008) much earlier had analyzed the benefits of financial
integration (resulting from international risk sharing) among 25 European Union (EU)
countries and presented a case for diversification of risk across EU member states if the risks
are fully shared. In a nutshell they emphasized that; the 10 new members joining the EU
would have higher gains than the long standing 15 members. The most glaring indication of
financial integration benefits is the case of South Africa, a country that has experienced
financial autarky as a result of the embargo imposed in 1985 and removed in 1993. Consistent
with Coulibaly (2009), there was a significant decrease in the rates of investment, capital and
output during the embargo period in South Africa in comparison with the pre-embargo and
post-embargo periods.
During the embargo South Africa might have benefited from financial isolation in
event of a global financial meltdown. This implies, countries in relative financial autarky are
less vulnerable to international financial shocks. Though one of the main appeals of financial
integration is risk diversification, paradoxically, increased financial globalization can reduce
the scope for risk diversification because integrated markets tend to be more interdependent
and highly correlated. Another downside of financial integration could be linked to threshold
factors pointed-out earlier by Kose et al. (2011). Their study has revealed that, countries with
low levels of financial depth and institutional quality do not stand to benefit from financial
integration. This perspective is in line with Schmukler (2004) who had stressed that: the
importance of sound financial fundamentals and strong macroeconomic institutions; the
presence of which should enable more effective management of crises and lower the
probability of crises and contagion. Hence, financial globalization could itself be a source of
crises.
2.2 Linkages between financial integration (globalization) and crises
We have observed that financial globalization has several potential benefits. However
the recent stream of financial crises and contagion due to the growing liberalization of
financial systems and integration of financial markets around the world, have led many
Though domestic factors are usually at the origin of crises, there are different channels
through which financial globalization could be related to crises.
Firstly, as emphasized by Schmukler (2004), when a country’s financial system is liberalized, it becomes an object of market discipline exercised by both foreign and domestic
investors. In a closed economy, only domestic investors monitor and react to unsound
economic fundamentals while, in an open one domestic and foreign investors might prompt
the country to achieve sound fundamentals. As pointed-out earlier, the absence of sound
macroeconomic, financial and institutional fundamentals could substantially increase the
probability of crises. It logically follows that, conflicting interests and views between
investors (domestic and foreign) on key fundamentals might precipitate crises and reduce the
ability of governments to effectively monitor and manage them.
Secondly, even with sound domestic economic fundamentals and quality institutions,
international financial market imperfections could also lead to crises. Among other things,
these could lead to irrational behavior, herding behavior, speculative attacks, bubbles, and
crashes. In plainer terms, regardless of market fundamentals, investors could speculate against
a currency if they believe that the exchange rate is unsustainable, which could ultimately lead
to self-fulfilling balance-of-payments. This thesis illustrated by Obstfeld (1986) has been
purported by Schmukler (2004), amongst others.
Thirdly, even in the presence of sound fundamentals and absence of imperfections in
international capital markets, crises might still arise on the grounds of external factors
(Schmukler, 2004) such as determinants of capital flows (Calvo et al., 1996) and foreign
interest rates (Frankel and Rose, 1996). For example if a country becomes dependent on
foreign capital, variations in foreign capital flows could create financial issues and economic
downturns. Frankel and Rose (1996) clearly emphasize the role foreign interest rates play in
determining the likelihood of financial crises in developing countries.
Fourthly, still consistent with Schmukler (2004), financial globalization could lead to
financial crises by contagion, namely by shocks via real links, financial links and
herding-behavior or unexplained high correlations. This chapter will focus on this fourth example3; the
elucidation and definition of which are worthwhile.
2.3 Definitions and channels of contagion
2.3.1 Definitions of contagion
3
There is no consensus on the definition of contagion among economists. According to
the World Bank, the phenomenon can be defined from three angles. Firstly, from a broad
angle, contagion could be identified with the general process of stock transmission across
countries. Thus, it is worthwhile understanding that this definition does encompass both
negative shocks and positive spillover effects. Secondly, the phenomenon could be conceived
as the propagation of shocks between two countries in excess of what should be expected,
based on the fundamentals after considering co-movements triggered by common shocks.
This second definition is restricted only to shocks and presupposes the mastery of what
constitutes the underlying fundamentals (without which an appraisal of excess co-movements
is not possible). The last and more restrictive definition considers the phenomenon as the
change in the transmission mechanisms (channels) that take place during a period of turmoil
and is appreciated by a significant increase in cross-market correlations. Within the
framework of this chapter, we shall be restricted to the third definition because: (1) our
studies aim to investigate recent trends in some crises of global dimension which are negative
shocks and not positive spillovers (as opposed to the first definition) and; (2) we do not
master what constitutes underlying fundamentals of co-movements we are about to study (in
antagonism to the second definition).
From an empirical standpoint, the third definition was first proposed by Forbes and
Rigobon (2002). They assessed contagion as a significant increase in market co-movements
after a shock has occurred in one country (or market). According to this definition, the
condition for contagion is a significant increase in co-movements as a result of a shock in one
market. Accordingly, if two markets display a high degree of co-movements during the
stability period, even if they are highly correlated during a crisis, if this crisis-correlation is
not significant it does not amount to contagion. In the absence of a significant correlation
during the crisis-period, the term ‘interdependence’ is used to qualify the situation between the two markets (or countries).
2.3.2 Channels of contagion
Borrowing from Schmukler (2004), three mains channels of contagion have been
documented in the literature. (1) Firstly, real links which are often associated with trading
activities. For example if two countries are trading partners and compete in the same external
market, a devaluation of the exchange rate of one country deteriorates the other country’s
want to devaluate its own currency. The Sino-American trade relation today is an eloquent
example. (2) Secondly, a financial link is a situation where two economies are connected
through the international financial system. For instance, let us consider leverage institutions
facing margin calls. In case the value of the collateral falls as a result of a negative shock in
one country, in a bid to increase their initial stock, these institutions would sell some of their
holdings in countries not yet affected by the shock. This gives rise to a mechanism that ripples
the shocks to other countries. (3) Thirdly, due to herding behaviors or panics resulting from
asymmetric information, financial markets might transmit shocks across markets. For obvious
reasons (common sense), we shall not elaborate on the mechanics of this third type.
2.4 Measuring contagion
Many methods of measuring contagion have been documented in the literature to
appreciate the spreading of international shocks across countries. The most widely employed
are cross-market correlation coefficients procedures (King and Wadhwani, 1990; Forbes and
Rigobon, 2002; Collins and Biekpe, 2003; Lee et al., 2007; Asongu, 2011; Asongu, 2012ab),
cross-market co-integration vectors changing techniques (Kanas, 1998), volatility analysis
based on ARCH and GARCH models (King et al., 1994) and direct estimation of specific
transmission mechanisms (Forbes, 2000). Consistent with the restrictive definition of
contagion, the chapter shall adopt Forbes and Rigobon (2002) in the context of: (1) Collins
and Biekpe (2003)4 for the assessment of financial (Section 3) and political (Section 5) crises
and; (2) Lee et al. (2007) for the examination of natural disasters (Section 4).
3. The 2007 financial crisis
Financial integration among economies has the benefit of improving allocation
efficiency and diversifying risk. However the recent global financial crisis, considered as the
worst since the Great Depression has re-ignited the fierce debate about the merits of financial
globalization and its implications for growth especially in developing countries (Asongu,
2012a). This section examines whether equity markets in emerging countries were vulnerable
to contagion during the recent global financial meltdown.
3.1 Data
4
The hypothesis testing in Collins and Biekpe (2003) is slightly different from that of Forbes and Rigobon (2002) in that, the test statistics to determine contagion is not calculated using estimated sample variances. Their
test statistics (Collins and Biekpe, 2003) uses exact student statistics based on actual sample correlation
coefficients (Asongu, 2012a). Contagion is then measured by the significant increase in adjusted correlation
The purpose of this study is to investigate correlations between the returns of the USA
stock index and stock indices of emerging countries. With the Dow Jones Industrial Average
as the ‘base criterion’, we analyze if co-movements between the ‘base criterion’ and financial markets of developing countries were significantly strengthened during the recent global
financial crisis. In et al. (2008), MacAndrews (2008), Taylor and William (2008) and more
recently Ji and In (2010) have all used the August 9th 2007 date as the start of the financial
crisis5. The sample period is divided into two categories: a 14 month pre-crisis period also
known as the tranquil or stable period and, a 15 month crisis or turmoil period. In a bid to
make our findings robust, the turmoil period is further divided into three sections6: the
short-run or four month crisis-period (August 09, 2007 to December 06, 2007); the medium-term or
eight months crisis-period (August 09, 2007 to April 10, 2008) and the long-term or 15 month
crisis-period (August 09, 2007 to November 13, 2008). Weekly data used in the study is
obtained from Bloomberg’s database. We use the local currency index return because Forbes and Rigobon (2002) have shown that using dollar or local indices will produce similar
outcomes.
3.2 Methodology
Contagion is defined by Forbes and Rigobon as a significant increase in market
co-movements after a shock has occurred in one country7.
The correlation coefficient is defined as:
y x
xy
(1)
where: ‘x’ is the base criterion while ‘y’ is an emerging equity market.
Consistent with Forbes and Rigobon, the correlation coefficient is adjusted in the following
manner:
] ) ( 1 [ 1 *
2
(2)
Where:
5
Date at which, BNP Paribas announced the closure of its funds that held US subprime debts.
6
From the empirical literature, the tranquil period is always longer than the turmoil period. For instance it is longer by a year, ten and a half months and nine months in Forbes & Rigobon (2002), Collins & Biekpe (2003) and Lee et al. (2007) respectively.
7
According to this definition, the presence of high correlation between two markets during the stable period and eventually a sustained increase in the high degree of cross market co-movements at the turmoil period does not
amount to contagion. Hence, contagion according to this definition is the presence of significant increase in
co-movements after a shock. On the other hand, if the high correlation degree is not significant, the term
1 l xx h xx
which measures the change in high-period volatility against low-period volatility. The
crisis-period is used as the ‘high volatility period’ and the tranquil period as the ‘low volatility period’ in the calculation of the correlation coefficient adjuster. Contagion is subsequently measured as the significance of adjusted correlation coefficients in time-varying turmoil
periods versus the stability period.
In the empirical literature, Collins and Biekpe (2003) and Lee et al. (2007) have
respectively applied both the t-test and F-test for the significance of the difference in
correlations. Accordingly, when only one coefficient is to be estimated, both tests have the
same implications (Asongu, 2011; Asongu, 2012ab). Consistent with the t-statistics approach,
the significance of increase in correlations during the turmoil period (t) with respect to the
stable(s) period is defined by:
2 ) ( 1 4 ) ( s t s t s t n n t
(3)
Where ) 4 , 01 . 0
( ntns
t
with, nt (ns) indicating actual observed weeks during the turmoil (stable) period.
The following hypotheses are then tested:
0 :1 2 o
H versus H1:12 0
Where Ho is the null hypothesis of no contagion while H1 is the alternative hypothesis for
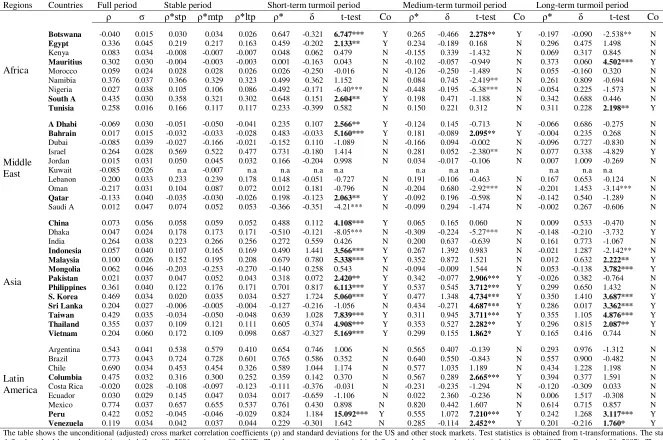
Table1: International stock indexes returns conditional (unadjusted) correlation coefficient s in 2007 financial crisis
Regions Countries Full period Stable period Short-term turmoil period Medium-term turmoil period Long-term turmoil period
ρ σ ρ σ ρ σ t-test Co ρ σ t-test Co ρ σ t-test Co
Africa
Botswana -0.040 0.015 0.024 0.014 0.573 0.010 5.641*** Y 0.197 0.008 1.675* Y -0.188 0.013 -2.419** N
Egypt 0.336 0.045 0.196 0.034 0.419 0.028 1.968* Y 0.212 0.028 0.154 N 0.353 0.051 1.757* Y Kenya 0.083 0.034 0.008 0.028 0.049 0.030 0.494 N -0.178 0.038 -1.656 N 0.079 0.038 0.970 N
Mauritius 0.302 0.030 0.003 0.028 0.001 0.024 0.039 N -0.099 0.027 -0.922 N 0.382 0.031 4.636*** Y Morocco 0.059 0.024 0.024 0.025 0.022 0.019 -0.014 N -0.109 0.019 -1.288 N 0.051 0.021 0.294 N Namibia 0.376 0.037 0.417 0.024 0.558 0.034 1.219 N 0.111 0.043 -3.093*** N 0.342 0.045 -0.845 N Nigeria 0.027 0.038 0.095 0.032 -0.457 0.027 -5.710*** N -0.410 0.026 -5.617*** N -0.060 0.040 -1.743* N
South A 0.435 0.030 0.380 0.021 0.674 0.024 2.641** Y 0.238 0.031 -1.378 N 0.428 0.036 0.522 N
Tunisia 0.258 0.016 0.129 0.014 0.183 0.009 0.462 N 0.165 0.018 0.343 N 0.341 0.018 2.405** Y
Middle East
A Dhabi -0.069 0.030 -0.053 0.021 0.246 0.024 2.706*** Y -0.133 0.025 -0.761 N -0.086 0.037 -0.356 N
Bahrain 0.017 0.015 -0.031 0.013 0.477 0.013 5.069*** Y 0.173 0.012 1.998** Y -0.004 0.017 0.297 N Dubai -0.085 0.039 -0.027 0.027 -0.160 0.031 -1.146 N -0.173 0.030 -1.410 N -0.126 0.048 -1.089 N Israel 0.264 0.028 0.531 0.023 0.697 0.019 1.444 N 0.287 0.025 -2.411** N 0.089 0.032 -5.462*** N Jordan 0.015 0.031 0.044 0.020 0.148 0.016 0.893 N 0.034 0.020 -0.105 N 0.011 0.040 -0.381 N Kuwait -0.085 0.026 n.a n.a 0.681 0.014 n.a 0.106 0.013 n.a -0.085 0.026 n.a
Lebanon 0.200 0.033 0.226 0.023 0.145 0.023 -0.710 N 0.181 0.021 -0.441 N 0.213 0.040 -0.155 N Oman -0.217 0.031 0.112 0.016 0.013 0.019 -0.865 N -0.261 0.028 -3.867*** N -0.306 0.040 -5.112*** N
Qatar -0.133 0.040 -0.032 0.030 0.186 0.027 1.930* Y -0.101 0.037 -0.653 N -0.175 0.047 -1.595 N Saudi A 0.012 0.047 0.059 0.041 -0.302 0.027 -3.339*** N -0.113 0.053 -1.681* N -0.002 0.052 0.522 N
Asia
China 0.073 0.056 0.071 0.048 0.528 0.045 4.507*** Y 0.071 0.048 0.064 N 0.063 0.012 -0.582 N Dhaka 0.047 0.024 -0.275 0.020 -0.462 0.022 -6.698*** N -0.275 0.020 -4.539*** N -0.132 0.020 -3.289*** Y India 0.264 0.038 0.252 0.044 0.400 0.042 0.574 N 0.252 0.044 -0.778 N 0.212 0.048 -1.355 N
Indonesia 0.057 0.040 0.394 0.054 0.773 0.055 5.268*** Y 0.394 0.054 1.389 N -0.031 0.052 -3.263*** N
Malaysia 0.100 0.026 0.457 0.036 0.838 0.034 6.045*** Y 0.457 0.036 1.903* Y 0.015 0.031 -2.832*** N
Mongolia 0.062 0.046 -0.093 0.044 -0.175 0.056 0.665 N -0.093 0.044 1.538 N 0.049 0.038 3.499*** Y
Pakistan 0.021 0.037 0.330 0.028 0.338 0.033 2.584** Y 0.330 0.028 2.798*** Y -0.031 0.042 -0.898 N
Philippines 0.361 0.040 0.621 0.045 0.855 0.053 7.127*** Y 0.621 0.045 4.229*** Y 0.373 0.048 1.749* Y
S. Korea 0.469 0.034 0.640 0.041 0.822 0.047 10.324*** Y 0.640 0.041 6.945*** Y 0.502 0.042 5.562*** Y
Sri Lanka 0.204 0.027 0.380 0.019 -0.100 0.021 -0.828 N 0.380 0.019 3.997*** Y 0.288 0.027 3.390*** Y
Taiwan 0.429 0.035 0.415 0.040 0.836 0.041 18.401*** Y 0.415 0.040 5.315*** Y 0.482 0.043 7.331*** Y
Thailand 0.355 0.037 0.422 0.039 0.715 0.035 5.908*** Y 0.422 0.039 2.722*** Y 0.385 0.046 2.698*** Y
Vietnam 0.204 0.060 0.319 0.056 0.524 0.032 3.842*** Y 0.319 0.056 1.985* Y 0.195 0.068 0.876 N
Latin America
Argentina 0.543 0.041 0.644 0.026 0.752 0.045 0.934 N 0.630 0.037 -0.136 N 0.505 0.051 -1.556 N Brazil 0.773 0.043 0.797 0.027 0.831 0.043 0.290 N 0.720 0.042 -0.744 N 0.765 0.052 -0.358 N Chile 0.690 0.034 0.588 0.020 0.721 0.040 1.154 N 0.710 0.040 1.178 N 0.703 0.043 1.281 N
Columbia 0.475 0.032 0.336 0.026 0.381 0.030 0.386 N 0.616 0.034 2.802*** Y 0.504 0.036 1.896* Y Costa Rica -0.020 0.028 -0.085 0.031 -0.088 0.019 -0.025 N -0.203 0.023 -1.140 N -0.083 0.021 0.023 N Ecuador 0.030 0.029 0.085 0.015 0.010 0.005 -0.648 N 0.040 0.049 -0.431 N 0.016 0.037 -0.773 N Mexico 0.774 0.037 0.721 0.026 0.814 0.037 0.800 N 0.865 0.037 1.391 N 0.784 0.044 0.692 N
Peru 0.422 0.052 -0.066 0.029 0.907 0.063 35.962*** Y 0.693 0.059 11.16*** Y 0.478 0.065 7.185*** Y
Venezuela 0.119 0.034 0.035 0.038 0.193 0.027 1.379 N 0.269 0.034 2.313** Y 0.159 0.030 1.385 N
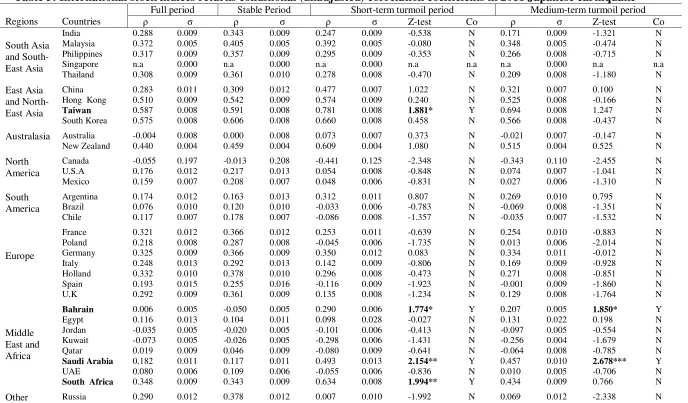
Table 2: International stock indexes returns unconditional (adjusted) correlation coefficient in 2007 financial crisis
Regions Countries Full period Stable period Short-term turmoil period Medium-term turmoil period Long-term turmoil period
ρ σ ρ*stp ρ*mtp ρ*ltp ρ* δ t-test Co ρ* δ t-test Co ρ* δ t-test Co
Africa
Botswana -0.040 0.015 0.030 0.034 0.026 0.647 -0.321 6.747*** Y 0.265 -0.466 2.278** Y -0.197 -0.090 -2.538** N
Egypt 0.336 0.045 0.219 0.217 0.163 0.459 -0.202 2.133** Y 0.234 -0.189 0.168 N 0.296 0.475 1.498 N Kenya 0.083 0.034 -0.008 -0.007 -0.007 0.048 0.062 0.479 N -0.155 0.339 -1.432 N 0.069 0.317 0.845 N
Mauritius 0.302 0.030 -0.004 -0.003 -0.003 0.001 -0.163 0.043 N -0.102 -0.057 -0.949 N 0.373 0.060 4.502*** Y Morocco 0.059 0.024 0.028 0.028 0.026 0.026 -0.250 -0.016 N -0.126 -0.250 -1.489 N 0.055 -0.160 0.320 N Namibia 0.376 0.037 0.366 0.329 0.323 0.499 0.362 1.152 N 0.084 0.745 -2.419** N 0.261 0.809 -0.694 N Nigeria 0.027 0.038 0.105 0.106 0.086 -0.492 -0.171 -6.40*** N -0.448 -0.195 -6.38*** N -0.054 0.225 -1.573 N
South A 0.435 0.030 0.358 0.321 0.302 0.648 0.151 2.604** Y 0.198 0.471 -1.188 N 0.342 0.688 0.446 N
Tunisia 0.258 0.016 0.166 0.117 0.117 0.233 -0.399 0.582 N 0.150 0.221 0.312 N 0.311 0.228 2.198** Y
Middle East
A Dhabi -0.069 0.030 -0.051 -0.050 -0.041 0.235 0.107 2.566** Y -0.124 0.145 -0.713 N -0.066 0.686 -0.275 N
Bahrain 0.017 0.015 -0.032 -0.033 -0.028 0.483 -0.033 5.160*** Y 0.181 -0.089 2.095** Y -0.004 0.235 0.268 N Dubai -0.085 0.039 -0.027 -0.166 -0.021 -0.152 0.110 -1.089 N -0.166 0.094 -0.002 N -0.096 0.727 -0.830 N Israel 0.264 0.028 0.569 0.522 0.477 0.731 -0.180 1.414 N 0.281 0.052 -2.380** N 0.077 0.338 -4.829 Y Jordan 0.015 0.031 0.050 0.045 0.032 0.166 -0.204 0.998 N 0.034 -0.017 -0.106 N 0.007 1.009 -0.269 N Kuwait -0.085 0.026 n.a -0.007 n.a n.a n.a n.a n.a n.a n.a n.a n.a n.a
Lebanon 0.200 0.033 0.233 0.239 0.178 0.148 -0.051 -0.727 N 0.191 -0.106 -0.463 N 0.167 0.653 -0.124 N Oman -0.217 0.031 0.104 0.087 0.072 0.012 0.181 -0.796 N -0.204 0.680 -2.92*** N -0.201 1.453 -3.14*** N
Qatar -0.133 0.040 -0.035 -0.030 -0.026 0.198 -0.123 2.063** Y -0.092 0.196 -0.598 N -0.142 0.540 -1.289 N Saudi A 0.012 0.047 0.074 0.052 0.053 -0.366 -0.351 -4.21*** N -0.099 0.294 -1.474 N -0.002 0.267 -0.606 N
Asia
China 0.073 0.056 0.058 0.059 0.052 0.488 0.112 4.108*** Y 0.065 0.165 0.060 N 0.009 0.533 -0.470 N Dhaka 0.047 0.024 0.178 0.173 0.171 -0.510 -0.121 -8.05*** N -0.309 -0.224 -5.27*** N -0.148 -0.210 -3.732 Y India 0.264 0.038 0.223 0.266 0.256 0.272 0.559 0.426 N 0.200 0.637 -0.639 N 0.161 0.773 -1.067 N
Indonesia 0.057 0.040 0.107 0.165 0.169 0.490 1.441 3.566*** Y 0.267 1.392 0.983 N -0.021 1.287 -2.142** N
Malaysia 0.100 0.026 0.152 0.195 0.208 0.679 0.780 5.338*** Y 0.352 0.872 1.521 N 0.012 0.632 2.222** Y
Mongolia 0.062 0.046 -0.203 -0.253 -0.270 -0.140 0.258 0.543 N -0.094 -0.009 1.544 N 0.053 -0.138 3.782*** Y
Pakistan 0.021 0.037 0.047 0.052 0.043 0.318 0.072 2.420** Y 0.342 -0.077 2.906*** Y -0.026 0.382 -0.764 N
Philippines 0.361 0.040 0.122 0.176 0.171 0.701 0.817 6.113*** Y 0.537 0.545 3.712*** Y 0.299 0.650 1.432 N
S. Korea 0.469 0.034 0.020 0.035 0.034 0.527 1.724 5.060*** Y 0.477 1.348 4.734*** Y 0.350 1.410 3.687*** Y
Sri Lanka 0.204 0.027 -0.006 -0.005 -0.004 -0.127 -0.216 -1.056 N 0.434 -0.271 4.687*** Y 0.286 0.017 3.362*** Y
Taiwan 0.429 0.035 -0.034 -0.050 -0.048 0.639 1.028 7.839*** Y 0.311 0.945 3.711*** Y 0.355 1.105 4.876*** Y
Thailand 0.355 0.037 0.109 0.121 0.111 0.605 0.374 4.908*** Y 0.353 0.527 2.282** Y 0.296 0.815 2.087** Y
Vietnam 0.204 0.060 0.172 0.109 0.098 0.687 -0.327 5.169*** Y 0.299 0.155 1.862* Y 0.165 0.416 0.744 N
Latin America
Argentina 0.543 0.041 0.538 0.579 0.410 0.654 0.746 1.006 N 0.565 0.407 -0.139 N 0.293 0.976 -1.312 N Brazil 0.773 0.043 0.724 0.728 0.601 0.765 0.586 0.352 N 0.640 0.550 -0.843 N 0.557 0.900 -0.482 N Chile 0.690 0.034 0.453 0.454 0.326 0.589 1.044 1.174 N 0.577 1.035 1.189 N 0.434 1.228 1.198 N
Columbia 0.475 0.032 0.316 0.300 0.252 0.359 0.142 0.370 N 0.567 0.289 2.665*** Y 0.394 0.377 1.591 N Costa Rica -0.020 0.028 -0.108 -0.097 -0.123 -0.111 -0.376 -0.031 N -0.231 -0.235 -1.294 N -0.120 -0.309 0.033 N Ecuador 0.030 0.029 0.145 0.047 0.034 0.017 -0.659 -1.106 N 0.022 2.360 -0.236 N 0.006 1.517 -0.308 N Mexico 0.774 0.037 0.657 0.655 0.537 0.761 0.430 0.898 N 0.820 0.442 1.607 N 0.614 0.715 0.857 N
Peru 0.422 0.052 -0.045 -0.046 -0.029 0.824 1.184 15.092*** Y 0.555 1.072 7.210*** Y 0.242 1.268 3.117*** Y
Venezuela 0.119 0.034 0.042 0.037 0.044 0.229 -0.301 1.642 N 0.285 -0.114 2.452** Y 0.201 -0.216 1.760* Y
3.3 Presentation of results and discussion
As shown in Tables 1-2, contagion results based on significant shifts in conditional
(unadjusted) correlation coefficients are robust to adjusted (unconditional) correlations.
Broadly, the following effects of the financial crisis could be observed: (1) with the
exceptions of India and Dhaka, Asian markets were worst hit; (2) but for Peru, Venezuela and
Columbia, Latin American countries were least affected and; (3) Africa and Middle East
emerging markets were averagely contaminated with the exceptions of Kenya, Namibia,
Nigeria, Morocco, Dubai, Jordan, Israel, Oman, Saudi Arabia and Lebanon.
The quasi-immunity of Latin American countries to this recent global financial
meltdown was not unexpected. Given its relative important history in the management of
financial crises, the continent was the most prepared. Current trends show that, Latin America
has improved since the Russian crisis, which has given countries in the continent some leeway
(particularly in monetary policy) to implement measures that attenuate the effect of crises.
Latin America and the Caribbean countries have built-up to 400 billion dollars in international
reserves and have substantially reduced their dollar-denominated debt (especially within the
banking system). For example, lower levels of debt dollarization has allowed Brazil to loosen
monetary policy in the face of the credit crunch in ways that many countries could not in the
post Russian crisis era. In the wake of the financial crisis, Latin American countries swiftly
depreciated their currencies without getting into the turmoil. From a fiscal standpoint, many
of these countries have saved a considerable amount of their tax income on extra revenue
from commodity bonanza at the turn of the century. For instance, Chile has spent only 34%
and kept the rest of increased tax collected in a special fund. Hence, even if the crisis had
affected these countries, they would still have had the leeway of increasing spending while
lowering taxes, in order to easily recover from recession.
Results from Africa were not entirely unexpected. With the exceptions of Kenya,
Namibia, Nigeria and Morocco, African stock markets are contaminated in at least one time
horizon. This reflects the increasing connection between African markets with global capital
flows. Accordingly, African markets are growing in size, liquidity and degree of foreign
participation. However misleading it may be to equate contagion to integration, a logical
extension of the results could make a case for African equity markets global integration.
Turning to the Middle East, but for Israel, Oman and Saudi Arabia, oil exporting
countries (Bahrain and Qatar) have been contaminated while, with the exception of Abu
Dhabi, non-oil producing states (Dubai, Jordan, Lebanon) have remained unaffected.
where causality runs from the Dow Jones Industrial Average (DJIA) to oil prices and not vice
versa), the DJIA which is our base criterion in this study negatively affected oil prices (which
in-turn has had a toll on the stock markets of oil exporting countries).
Whereas Dhaka and India in Asia have remained uncontaminated, China and
Mongolia have been affected only in the short- and long-run horizons respectively. Other
emerging markets have also been affected at least in two time-horizons. The unexpected
speed and force with which the global financial crisis has affected Asian economies could be
explained from trade channels. The region currently has deep economic integration with the
rest of the world, especially developments in the United States. A case in point is the loss in
export volume growth in Western Asia from 6.4% in 2006 to -0.6% in 2007. Conversely, the
fact that India has been broadly unaffected is not unexpected. India has a completely different
approach to financial globalization. Whereas the Indian current account was fully opened on a
gradual basis in the 1990s, a more calibrated approach has been followed to the opening of the
capital account and subsequently the financial sector. This approach is consistent with the
available weight of empirical evidence on the benefits of capital account liberalization for
acceleration of economic growth, particularly in emerging economies. Further evidence
suggests that, the greatest gains are obtained from openness to foreign direct investment
followed by portfolio investment. Benefits resulting from external debt flows are questionable
until greater domestic financial market development has taken place (Henry, 2007; Asongu,
2012c). As a policy implication, policy making bodies should reconsider Latin American
monetary and fiscal strategies in the fight against external financial shocks. Also, the validity
of India’s financial liberalization strategy could serve as a guide for governments in other developing countries8.
4. The 2011 Japanese earthquake, tsunami and nuclear crises
Natural disasters may inflict significant damage upon international financial markets.
The purpose of this section is to investigate if any contagion effect occurred in the immediate
aftermath of the Japanese earthquake, tsunami and subsequent nuclear crises.
8“
Whereas the Indian current account has been opened fully though gradually in the 1990s, a more calibrated approach has been followed in the opening of the capital account and subsequently the financial sector. This approach is consistent with the weight of available empirical evidence on the benefits of capital account liberalization for acceleration of economic growth, particularly in emerging economies. Evidence suggests that the greatest gains are obtained from openness to foreign direct investment followed by portfolio investment. Benefits resulting from external debt flows are questionable until greater domestic financial market development
4.1 Data
To investigate the correlations among returns of the Japanese daily stock index
(exchange rate) and 33 international stock indices (exchange rates) returns, the Japanese
equity and foreign exchange markets are the base criteria. Thus, we examine whether
co-movements among national stock and foreign exchange markets increased significantly after
the major earthquake, tsunami and nuclear disasters. The sample period is divided into two
sections: the 1month pre-earthquake period (March 11, 2010 to March 10, 2011) and the
2-month post-earthquake period (March 11, 2011 to May 10, 2011)9. Whereas the stability
period is defined as the pre-earthquake period, the turbulent (turmoil) period is the
post-earthquake period. In order to ensure robustness of our findings, the turmoil period is further
divided into two equal sections: the 1-month (short-term) post-earthquake period (March 11,
2011 to April 10, 2011) and, the 2-month (medium-term) post-earthquake (March 11, 2011 to
May 10, 2011). The number of days is respectively 365, 31, 62 days for the stable, short-term
turmoil and medium-term turmoil periods. Data used in the study is obtained from
Bloomberg’s database. In the computing stock returns, last values are carried over for
non-trading days. The US dollar is used as the common “x” unit of foreign currency for each unit
of national/regional currency in the computation of exchange rate returns. The use of local
currency index return is consistent with Forbes and Rigobon who have shown that, using
dollar or local indices will produce similar results.
4.2 Methodology
Borrowing from Forbes and Rigobon, contagion is a significant increase in market
co-movements after a shock has occurred in one country.
The coefficient of correlation is defined as:
y x
xy
(4)
Where: ‘x’ represents the base criterion and ‘y’ an international market. This correlation
coefficient is adjusted in the following manner to take account of heteroscedasticity:
] ) ( 1 [ 1 *
2
(5)
Where:
9
1 l xx h xx
It measures the change in high-period volatility against volatility in the low-period. Whereas
the crisis interval is used as the high volatility period, the tranquil (or stable-period) represents
the low volatility period. Contagion is accordingly measured as the significant increase of
adjusted correlation coefficients in time-varying turmoil periods against the stability period.
Consistent with Lee et al. (2007), the following hypotheses are tested:
0 : t s o
H versus H1:ts 0
Where, ρt is the adjusted correlation coefficient during the turmoil period and ρs the adjusted
correlation coefficient for the stable period. A comparison of the variation in correlation
between the stable and crisis periods is then analyzed. The null hypothesis (H0) is the
hypothesis of no contagion whereas H1 is the alternative hypothesis for the presence of
contagion. Fisher’s Z transformations of correlation coefficients are employed to test pair-wise cross-country significance. The Fisher’s Z-transformations change standard coefficients to normally distributed Z variables. Therefore, prior to hypothesis testing, ρ values must be
converted to Zr values.
0 : t s o
H ⇒Ho:ZrtZrs0
0 :
1 t s
H ⇒ H1:ZrtZrs0
Where:
)
(
1 1 ln 2 1 t t rt Z )
(
1 1 ln 2 1 s s rs Z )) 3 /( 1 ( )) 3 /( 1 ( S t n n Z Z Z rt rs4.3 Empirical results and discussion
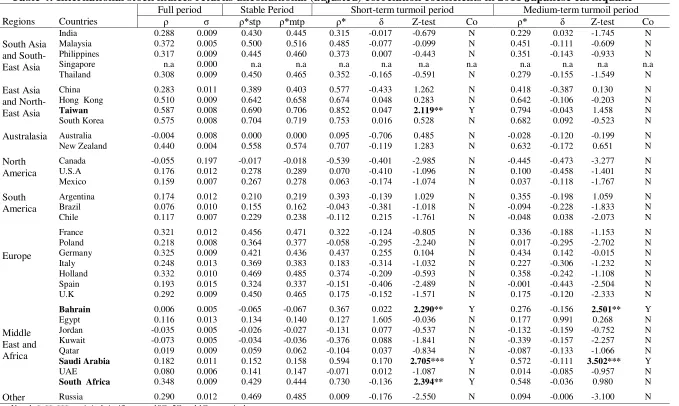
4.3.1 Contagion effect in international stock indexes returns after earthquake
Table 3 below shows the conditional (unadjusted) correlation coefficients of
international stock indices for the 2011 Japanese Tsunami. Cross-market correlations of stock
index returns are analyzed before and after the earthquake of March 11, 2011. But for China,
cross-market correlations between Japan and most countries in the sample during stable period are
higher than those during medium-term turmoil period. For the short-run interval, correlations
are strengthened for China, Hong Kong, Taiwan, New Zealand, Argentina, Germany, South
Korea, Australia, Bahrain, South Africa and Saudi Arabia. There is significant evidence of
contagion in Saudi Arabia, Taiwan, Bahrain and South Africa for the short-term turmoil
period and only in Bahrain and Saudi Arabia for the medium-term turmoil interval. Relatively
for the most part, volatilities of most countries during the stable period are higher than those
during turmoil periods (short and medium terms). Table 4 presents unconditional correlation
coefficients. These adjusted correlations are higher than their unadjusted counterparts in Table
3. Ultimately, the findings in Table 3 are robust to those in Table 4.
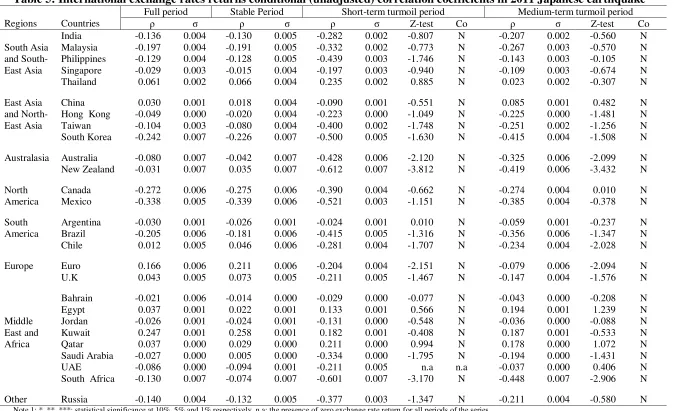
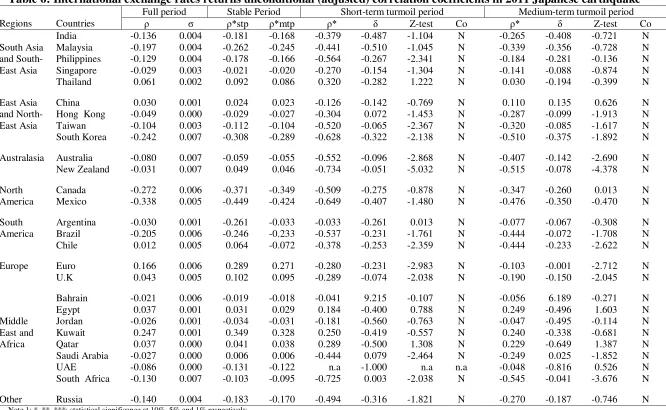
4.3.2 Contagion effect in international exchange rates returns after earthquake
Table 5 presents findings for exchange rate conditional (unadjusted) correlation
coefficients. Accordingly, cross-market correlations during turmoil periods are higher than
those during the stable period. Strengthened cross-market correlations with insignificant
evidence of contagion are noticeable for the Argentine Peso (ARS), Thai Baht (THB),
Egyptian Pound (EGP), and Qatari Riyal (QAR) for the short-term turmoil period. Looking at
the medium-term, the Chinese Yuan (RMB), Canadian Dollar (CAD), Egyptian pound (EGP),
Qatari Riyal (QAR) and Emirati dirham (AED) have also witnessed insignificant stronger
co-movements with the Japanese Yen (JPY). Adjusted findings in Table 6 confirm those in
Table 5. Ultimately, no national/regional exchange market is found to have suffered from
contagion two months in the aftermath of the Japanese earthquake and the ensuing collateral
Table 3: International stock indices returns conditional (unadjusted) correlation coefficients in 2011 Japanese earthquake
Regions Countries
Full period Stable Period Short-term turmoil period Medium-term turmoil period
ρ σ ρ σ ρ σ Z-test Co ρ σ Z-test Co
South Asia and South-East Asia
India 0.288 0.009 0.343 0.009 0.247 0.009 -0.538 N 0.171 0.009 -1.321 N
Malaysia 0.372 0.005 0.405 0.005 0.392 0.005 -0.080 N 0.348 0.005 -0.474 N
Philippines 0.317 0.009 0.357 0.009 0.295 0.009 -0.353 N 0.266 0.008 -0.715 N
Singapore n.a 0.000 n.a 0.000 n.a 0.000 n.a n.a n.a 0.000 n.a n.a
Thailand 0.308 0.009 0.361 0.010 0.278 0.008 -0.470 N 0.209 0.008 -1.180 N
East Asia and North-East Asia
China 0.283 0.011 0.309 0.012 0.477 0.007 1.022 N 0.321 0.007 0.100 N
Hong Kong 0.510 0.009 0.542 0.009 0.574 0.009 0.240 N 0.525 0.008 -0.166 N
Taiwan 0.587 0.008 0.591 0.008 0.781 0.008 1.881* Y 0.694 0.008 1.247 N
South Korea 0.575 0.008 0.606 0.008 0.660 0.008 0.458 N 0.566 0.008 -0.437 N
Australasia Australia -0.004 0.008 0.000 0.008 0.073 0.007 0.373 N -0.021 0.007 -0.147 N
New Zealand 0.440 0.004 0.459 0.004 0.609 0.004 1.080 N 0.515 0.004 0.525 N
North America
Canada -0.055 0.197 -0.013 0.208 -0.441 0.125 -2.348 N -0.343 0.110 -2.455 N
U.S.A 0.176 0.012 0.217 0.013 0.054 0.008 -0.848 N 0.074 0.007 -1.041 N
Mexico 0.159 0.007 0.208 0.007 0.048 0.006 -0.831 N 0.027 0.006 -1.310 N
South America
Argentina 0.174 0.012 0.163 0.013 0.312 0.011 0.807 N 0.269 0.010 0.795 N
Brazil 0.076 0.010 0.120 0.010 -0.033 0.006 -0.783 N -0.069 0.008 -1.351 N
Chile 0.117 0.007 0.178 0.007 -0.086 0.008 -1.357 N -0.035 0.007 -1.532 N
Europe
France 0.321 0.012 0.366 0.012 0.253 0.011 -0.639 N 0.254 0.010 -0.883 N
Poland 0.218 0.008 0.287 0.008 -0.045 0.006 -1.735 N 0.013 0.006 -2.014 N
Germany 0.325 0.009 0.366 0.009 0.350 0.012 0.083 N 0.334 0.011 -0.012 N
Italy 0.248 0.013 0.292 0.013 0.142 0.009 -0.806 N 0.169 0.009 -0.928 N
Holland 0.332 0.010 0.378 0.010 0.296 0.008 -0.473 N 0.271 0.008 -0.851 N
Spain 0.193 0.015 0.255 0.016 -0.116 0.009 -1.923 N -0.001 0.009 -1.860 N
U.K 0.292 0.009 0.361 0.009 0.135 0.008 -1.234 N 0.129 0.008 -1.764 N
Middle East and Africa
Bahrain 0.006 0.005 -0.050 0.005 0.290 0.006 1.774* Y 0.207 0.005 1.850* Y
Egypt 0.116 0.013 0.104 0.011 0.098 0.028 -0.027 N 0.131 0.022 0.198 N
Jordan -0.035 0.005 -0.020 0.005 -0.101 0.006 -0.413 N -0.097 0.005 -0.554 N
Kuwait -0.073 0.005 -0.026 0.005 -0.298 0.006 -1.431 N -0.256 0.004 -1.679 N
Qatar 0.019 0.009 0.046 0.009 -0.080 0.009 -0.641 N -0.064 0.008 -0.785 N
Saudi Arabia 0.182 0.011 0.117 0.011 0.493 0.013 2.154** Y 0.457 0.010 2.678*** Y
UAE 0.080 0.006 0.109 0.006 -0.055 0.006 -0.836 N 0.010 0.005 -0.706 N
South Africa 0.348 0.009 0.343 0.009 0.634 0.008 1.994** Y 0.434 0.009 0.766 N
Other Russia 0.290 0.012 0.378 0.012 0.007 0.010 -1.992 N 0.069 0.012 -2.338 N
Note 1: *, **, ***: statistical significance at 10%, 5% and 1% respectively.
Note 2: The table shows conditional (unadjusted) cross-market correlation coefficients (ρ) and standard deviations (σ) for Japan and other stock indexes. The test statistics are obtained from Fisher Z transformations. The stable period is defined as the 12-month pre-earthquake period (March 11, 2010 to March 10, 2011). The short-term turmoil period is defined as the 1-month post-earthquake period (March 11, 2011 to April 10, 2011). The medium-term turmoil period is defined as the 2-month post-earthquake period (March 11, 2011 to May 10, 2011). The full period is the stable period plus the medium-term turmoil period. Co: contagion
Table 4: International stock indices returns unconditional (adjusted) correlation coefficients in 2011 Japanese earthquake
Regions Countries
Full period Stable Period Short-term turmoil period Medium-term turmoil period
ρ σ ρ*stp ρ*mtp ρ* δ Z-test Co ρ* δ Z-test Co
South Asia and South-East Asia
India 0.288 0.009 0.430 0.445 0.315 -0.017 -0.679 N 0.229 0.032 -1.745 N
Malaysia 0.372 0.005 0.500 0.516 0.485 -0.077 -0.099 N 0.451 -0.111 -0.609 N
Philippines 0.317 0.009 0.445 0.460 0.373 0.007 -0.443 N 0.351 -0.143 -0.933 N
Singapore n.a 0.000 n.a n.a n.a n.a n.a n.a n.a n.a n.a n.a
Thailand 0.308 0.009 0.450 0.465 0.352 -0.165 -0.591 N 0.279 -0.155 -1.549 N
East Asia and North-East Asia
China 0.283 0.011 0.389 0.403 0.577 -0.433 1.262 N 0.418 -0.387 0.130 N
Hong Kong 0.510 0.009 0.642 0.658 0.674 0.048 0.283 N 0.642 -0.106 -0.203 N
Taiwan 0.587 0.008 0.690 0.706 0.852 0.047 2.119** Y 0.794 -0.043 1.458 N
South Korea 0.575 0.008 0.704 0.719 0.753 0.016 0.528 N 0.682 0.092 -0.523 N
Australasia Australia -0.004 0.008 0.000 0.000 0.095 -0.706 0.485 N -0.028 -0.120 -0.199 N
New Zealand 0.440 0.004 0.558 0.574 0.707 -0.119 1.283 N 0.632 -0.172 0.651 N
North America
Canada -0.055 0.197 -0.017 -0.018 -0.539 -0.401 -2.985 N -0.445 -0.473 -3.277 N
U.S.A 0.176 0.012 0.278 0.289 0.070 -0.410 -1.096 N 0.100 -0.458 -1.401 N
Mexico 0.159 0.007 0.267 0.278 0.063 -0.174 -1.074 N 0.037 -0.118 -1.767 N
South America
Argentina 0.174 0.012 0.210 0.219 0.393 -0.139 1.029 N 0.355 -0.198 1.059 N
Brazil 0.076 0.010 0.155 0.162 -0.043 -0.381 -1.018 N -0.094 -0.228 -1.833 N
Chile 0.117 0.007 0.229 0.238 -0.112 0.215 -1.761 N -0.048 0.038 -2.073 N
Europe
France 0.321 0.012 0.456 0.471 0.322 -0.124 -0.805 N 0.336 -0.188 -1.153 N
Poland 0.218 0.008 0.364 0.377 -0.058 -0.295 -2.240 N 0.017 -0.295 -2.702 N
Germany 0.325 0.009 0.421 0.436 0.437 0.255 0.104 N 0.434 0.142 -0.015 N
Italy 0.248 0.013 0.369 0.383 0.183 -0.314 -1.032 N 0.227 -0.306 -1.232 N
Holland 0.332 0.010 0.469 0.485 0.374 -0.209 -0.593 N 0.358 -0.242 -1.108 N
Spain 0.193 0.015 0.324 0.337 -0.151 -0.406 -2.489 N -0.001 -0.443 -2.504 N
U.K 0.292 0.009 0.450 0.465 0.175 -0.152 -1.571 N 0.175 -0.120 -2.333 N
Middle East and Africa
Bahrain 0.006 0.005 -0.065 -0.067 0.367 0.022 2.290** Y 0.276 -0.156 2.501** Y
Egypt 0.116 0.013 0.134 0.140 0.127 1.605 -0.036 N 0.177 0.991 0.268 N
Jordan -0.035 0.005 -0.026 -0.027 -0.131 0.077 -0.537 N -0.132 -0.159 -0.752 N
Kuwait -0.073 0.005 -0.034 -0.036 -0.376 0.088 -1.841 N -0.339 -0.157 -2.257 N
Qatar 0.019 0.009 0.059 0.062 -0.104 0.037 -0.834 N -0.087 -0.133 -1.066 N
Saudi Arabia 0.182 0.011 0.152 0.158 0.594 0.170 2.705*** Y 0.572 -0.111 3.502*** Y
UAE 0.080 0.006 0.141 0.147 -0.071 0.012 -1.087 N 0.014 -0.085 -0.957 N
South Africa 0.348 0.009 0.429 0.444 0.730 -0.136 2.394** Y 0.548 -0.036 0.980 N
Other Russia 0.290 0.012 0.469 0.485 0.009 -0.176 -2.550 N 0.094 -0.006 -3.100 N
Note 1: *, **, ***: statistical significance at 10%, 5% and 1% respectively.
Note 2: The table shows conditional (unadjusted) cross-market correlation coefficients (ρ) , adjuster for heteroscedasticity (δ) and standard deviations (σ) for Japan and other stock indexes. The test statistics are obtained from Fisher Z transformations. The stable period is defined as the 12-month pre-earthquake period (March 11, 2010 to March 10, 2011). The short-term turmoil period is defined as the 1-month post-earthquake period (March 11, 2011 to April 10, 2011). The medium-term turmoil period is defined as the 2-month post-earthquake period (March 11, 2011 to May 10, 2011). The full period is the stable period plus the medium-term
turmoil period. Co: contagion. While “Y” denotes that the test statistics is greater than the critical value and contagion occurred, “N” indicates that the test statistics was less or equal to the critical value and no contagion occurred. ρ*stp, ρ*mtp, denote adjusted correlation coefficients for the short and medium term periods respectively. δ: correlation coefficient adjuster.
Table 5: International exchange rates returns conditional (unadjusted) correlation coefficients in 2011 Japanese earthquake
Regions Countries
Full period Stable Period Short-term turmoil period Medium-term turmoil period
ρ σ ρ σ ρ σ Z-test Co ρ σ Z-test Co
South Asia and South-East Asia
India -0.136 0.004 -0.130 0.005 -0.282 0.002 -0.807 N -0.207 0.002 -0.560 N
Malaysia -0.197 0.004 -0.191 0.005 -0.332 0.002 -0.773 N -0.267 0.003 -0.570 N
Philippines -0.129 0.004 -0.128 0.005 -0.439 0.003 -1.746 N -0.143 0.003 -0.105 N
Singapore -0.029 0.003 -0.015 0.004 -0.197 0.003 -0.940 N -0.109 0.003 -0.674 N
Thailand 0.061 0.002 0.066 0.004 0.235 0.002 0.885 N 0.023 0.002 -0.307 N
East Asia and North-East Asia
China 0.030 0.001 0.018 0.004 -0.090 0.001 -0.551 N 0.085 0.001 0.482 N
Hong Kong -0.049 0.000 -0.020 0.004 -0.223 0.000 -1.049 N -0.225 0.000 -1.481 N
Taiwan -0.104 0.003 -0.080 0.004 -0.400 0.002 -1.748 N -0.251 0.002 -1.256 N
South Korea -0.242 0.007 -0.226 0.007 -0.500 0.005 -1.630 N -0.415 0.004 -1.508 N
Australasia Australia -0.080 0.007 -0.042 0.007 -0.428 0.006 -2.120 N -0.325 0.006 -2.099 N
New Zealand -0.031 0.007 0.035 0.007 -0.612 0.007 -3.812 N -0.419 0.006 -3.432 N
North America
Canada -0.272 0.006 -0.275 0.006 -0.390 0.004 -0.662 N -0.274 0.004 0.010 N
Mexico -0.338 0.005 -0.339 0.006 -0.521 0.003 -1.151 N -0.385 0.004 -0.378 N
South America
Argentina -0.030 0.001 -0.026 0.001 -0.024 0.001 0.010 N -0.059 0.001 -0.237 N
Brazil -0.205 0.006 -0.181 0.006 -0.415 0.005 -1.316 N -0.356 0.006 -1.347 N
Chile 0.012 0.005 0.046 0.006 -0.281 0.004 -1.707 N -0.234 0.004 -2.028 N
Europe Euro 0.166 0.006 0.211 0.006 -0.204 0.004 -2.151 N -0.079 0.006 -2.094 N
U.K 0.043 0.005 0.073 0.005 -0.211 0.005 -1.467 N -0.147 0.004 -1.576 N
Middle East and Africa
Bahrain -0.021 0.006 -0.014 0.000 -0.029 0.000 -0.077 N -0.043 0.000 -0.208 N
Egypt 0.037 0.001 0.022 0.001 0.133 0.001 0.566 N 0.194 0.001 1.239 N
Jordan -0.026 0.001 -0.024 0.001 -0.131 0.000 -0.548 N -0.036 0.000 -0.088 N
Kuwait 0.247 0.001 0.258 0.001 0.182 0.001 -0.408 N 0.187 0.001 -0.533 N
Qatar 0.037 0.000 0.029 0.000 0.211 0.000 0.994 N 0.178 0.000 1.072 N
Saudi Arabia -0.027 0.000 0.005 0.000 -0.334 0.000 -1.795 N -0.194 0.000 -1.431 N
UAE -0.086 0.000 -0.094 0.001 -0.211 0.005 n.a n.a -0.037 0.000 0.406 N
South Africa -0.130 0.007 -0.074 0.007 -0.601 0.007 -3.170 N -0.448 0.007 -2.906 N
Other Russia -0.140 0.004 -0.132 0.005 -0.377 0.003 -1.347 N -0.211 0.004 -0.580 N
Note 1: *, **, ***: statistical significance at 10%, 5% and 1% respectively. n.a: the presence of zero exchange rate return for all periods of the series.
Note 2: The table shows conditional (unadjusted) cross-market correlation coefficients (ρ) and standard deviations (σ) for Japan and other stock indexes. The test statistics are obtained from Fisher Z transformations. The stable period is defined as the 12-month pre-earthquake period (March 11, 2010 to March 10, 2011). The short-term turmoil period is defined as the 1-month post-earthquake period (March 11, 2011 to April 10, 2011). The medium-term turmoil period is defined as the 2-month post-earthquake period (March 11, 2011 to May 10, 2011). The full period is the stable period plus the medium-term turmoil period. Co: contagion
Table 6: International exchange rates returns unconditional (adjusted) correlation coefficients in 2011 Japanese earthquake
Regions Countries
Full period Stable Period Short-term turmoil period Medium-term turmoil period
ρ σ ρ*stp ρ*mtp ρ* δ Z-test Co ρ* δ Z-test Co
South Asia and South-East Asia
India -0.136 0.004 -0.181 -0.168 -0.379 -0.487 -1.104 N -0.265 -0.408 -0.721 N
Malaysia -0.197 0.004 -0.262 -0.245 -0.441 -0.510 -1.045 N -0.339 -0.356 -0.728 N
Philippines -0.129 0.004 -0.178 -0.166 -0.564 -0.267 -2.341 N -0.184 -0.281 -0.136 N
Singapore -0.029 0.003 -0.021 -0.020 -0.270 -0.154 -1.304 N -0.141 -0.088 -0.874 N
Thailand 0.061 0.002 0.092 0.086 0.320 -0.282 1.222 N 0.030 -0.194 -0.399 N
East Asia and North-East Asia
China 0.030 0.001 0.024 0.023 -0.126 -0.142 -0.769 N 0.110 0.135 0.626 N
Hong Kong -0.049 0.000 -0.029 -0.027 -0.304 0.072 -1.453 N -0.287 -0.099 -1.913 N
Taiwan -0.104 0.003 -0.112 -0.104 -0.520 -0.065 -2.367 N -0.320 -0.085 -1.617 N
South Korea -0.242 0.007 -0.308 -0.289 -0.628 -0.322 -2.138 N -0.510 -0.375 -1.892 N
Australasia Australia -0.080 0.007 -0.059 -0.055 -0.552 -0.096 -2.868 N -0.407 -0.142 -2.690 N
New Zealand -0.031 0.007 0.049 0.046 -0.734 -0.051 -5.032 N -0.515 -0.078 -4.378 N
North America
Canada -0.272 0.006 -0.371 -0.349 -0.509 -0.275 -0.878 N -0.347 -0.260 0.013 N
Mexico -0.338 0.005 -0.449 -0.424 -0.649 -0.407 -1.480 N -0.476 -0.350 -0.470 N
South America
Argentina -0.030 0.001 -0.261 -0.033 -0.033 -0.261 0.013 N -0.077 -0.067 -0.308 N
Brazil -0.205 0.006 -0.246 -0.233 -0.537 -0.231 -1.761 N -0.444 -0.072 -1.708 N
Chile 0.012 0.005 0.064 -0.072 -0.378 -0.253 -2.359 N -0.444 -0.233 -2.622 N
Europe Euro 0.166 0.006 0.289 0.271 -0.280 -0.231 -2.983 N -0.103 -0.001 -2.712 N
U.K 0.043 0.005 0.102 0.095 -0.289 -0.074 -2.038 N -0.190 -0.150 -2.045 N
Middle East and Africa
Bahrain -0.021 0.006 -0.019 -0.018 -0.041 9.215 -0.107 N -0.056 6.189 -0.271 N
Egypt 0.037 0.001 0.031 0.029 0.184 -0.400 0.788 N 0.249 -0.496 1.603 N
Jordan -0.026 0.001 -0.034 -0.031 -0.181 -0.560 -0.763 N -0.047 -0.495 -0.114 N
Kuwait 0.247 0.001 0.349 0.328 0.250 -0.419 -0.557 N 0.240 -0.338 -0.681 N
Qatar 0.037 0.000 0.041 0.038 0.289 -0.500 1.308 N 0.229 -0.649 1.387 N
Saudi Arabia -0.027 0.000 0.006 0.006 -0.444 0.079 -2.464 N -0.249 0.025 -1.852 N
UAE -0.086 0.000 -0.131 -0.122 n.a -1.000 n.a n.a -0.048 -0.816 0.526 N
South Africa -0.130 0.007 -0.103 -0.095 -0.725 0.003 -2.038 N -0.545 -0.041 -3.676 N
Other Russia -0.140 0.004 -0.183 -0.170 -0.494 -0.316 -1.821 N -0.270 -0.187 -0.746 N
Note 1: *, **, ***: statistical significance at 10%, 5% and 1% respectively.
Note 2: The table shows conditional (unadjusted) cross-market correlation coefficients (ρ), adjuster for heteroscedasticity (δ) and standard deviations (σ) for Japan and other stock indexes. The test statistics are obtained from Fisher Z transformations. The stable period is defined as the 12-month pre-earthquake period (March 11, 2010 to March 10, 2011). The short-term turmoil period is defined as the 1-month post-earthquake period (March 11, 2011 to April 10, 2011). The medium-term turmoil period is defined as the 2-month post-earthquake period (March 11, 2011 to May 10, 2011). The full period is the stable period plus the medium-term
turmoil period. Co: contagion .While “Y” denotes that the test statistics is greater than the critical value and contagion occurred, “N” indicates that the test statistics was less or equal to the critical value and no contagion occurred. ρ*stp, ρ*mtp, denote adjusted correlation coefficients for the short and medium term periods respectively. δ: correlation coefficient adjuster.
4.3.3 Discussion of results, policy implications and future research directions
This section has examined if the March 2011 Japanese earthquake, tsunami and
nuclear disaster affected the stability of the correlation structure in international stock and
foreign exchange markets.
On a first note, with regard to international equity markets, there is substantial
evidence of contagion in Taiwan, Bahrain, Saudi Arabia and South Africa. The effect on
Saudi Arabia was not unexpected because it is one of the four countries from which a large
part of Japan’s imports in raw material source. For the other three, cross-market correlations strengthened only with China and Australia in the short-run, although insignificant to account
for contagion. A possible explanation as to why Saudi Arabia was most strongly affected both
in the immediate and medium terms may be seen from Japan’s boost in fuel imports in substitution to energy formerly provided by the wrecked Fukushima nuclear plants. Bahrain,
being an oil-export driven economy (like her sisterly neighbor Saudi Arabia), could not have
been victim of a different fate. As for Taiwan, as pointed-out by Asongu (2012b), Japan is its
second largest trading partner and official estimates on the effect of the Japanese earthquake
on the Taiwanese economy stand at a yearly fall in growth by 0.2% of Gross Domestic
Product (GDP).
Secondly, international foreign exchange market results show no presence of
contagion. Accordingly, one would have expected the widespread disruption to Japan’s US$5.5 trillion economy to inevitably affect other countries in the Asia-Pacific region and
beyond. Regional trade would immediately have been affected by the damage to Japanese
ports. The unexpected findings could be explained by the fact that, major Japanese
manufacturers of automobiles, semiconductors, computers and other goods immediately took
advantage of their international supply chains and production networks. Thus, moving
production elsewhere in Asia or to North America, where capacity utilization is still low.
Moreover, since Japanese factories generally produce consumer goods rather than
intermediate products, disruptions to outbound shipments should not have been expected to
seriously affect production processes in other countries.
On managing and mitigating spillovers and contagion, it is worth emphasizing that
globalization comes with costs and benefits. Therefore, managing financial market contagion
resulting from natural disasters requires that governments minimize the costs and maximize
the benefits of financial market integration. Most countries in the sample have undoubtedly
measures need to be taken in an effort to manage the downside ramifications of integration in
the event of a natural disaster.
The following are some recommendations policy makers need to take into account in
order to minimize (mitigate) the adverse financial market effects of disasters. (1) The banking
system of a country should not be directly exposed to foreign assets that natural disasters can
easily stress and render worthless. This recommendation also applies to assets in institutions
that natural disasters could make futile. Accordingly, this caution would attenuate the
knock-on effects through mknock-onetary, financial and real channels. (2) Domestic financial markets
(equity, money, foreign exchange and credit markets) may also suffer due to the ‘substitution
effect’. As credit channels and credit lines in the affected (or contaminated) countries run dry, some of the credit-demand earlier met by overseas financing could easily shift to the domestic
sector and put pressure on domestic resources. The reversal of capital flows arising from the
de-leveraging process could put pressure on the foreign exchange market, leading to sharp
fluctuations in overnight money market rates and undue depreciation of currency. Hence, it is
in the interest of central banks to adopt a monetary policy stance that is adequate to growth,
inflation and financial stability concerns. (3) In circumstances where the natural disaster
mirrors an expected decline in inflation, it is also in the interest of the central bank to adjust
its monetary stance and manage liquidity: both domestic and foreign exchange to ensure that
credit continues to flow for productive activities at both aggregate and sector specific levels.
(4) In order to enable economic agents plan their business activities with more assurance, the
central bank could ensure an orderly adjustment of the pain of its policies by maintaining a
comfortable liquidity position: ensuring that the weighted average overnight money market
rate is maintained within the repo-reverse repo corridor (margin) and ensure conditions
conducive for flow of credit to productive sectors (particularly the stressed export industry
sectors).
Before we conclude this section, it is important to highlight the implications of this
paper to the future of natural disasters. Though the crisis is over, from a financial standpoint
the following concerns on future natural disasters are most likely to preoccupy policymakers.
(1) Is self-insurance a viable (and/or feasible) option for emerging economies? In other terms,
could the accumulation of foreign reserves buffer against financial market crises cropping-up
from natural disasters? Whether these reserves derive from current account surpluses (China
for example) or capital flows (India for instance), relying on them to hedge contagion could
still represent some form of liability. This draws to mind the need of finding a way of