Munich Personal RePEc Archive
Commodity Price Uncertainty and
Manufactured Exports in Morocco and
Tunisia: Some Insights from a Novel
GARCH Model
Bouoiyour, Jamal and Selmi, Refk
February 2013
Online at
https://mpra.ub.uni-muenchen.de/53412/
Commodity Price Uncertainty and Manufactured Exports in Morocco and
Tunisia: Some Insights from a Novel GARCH Model
Jamal BOUOIYOUR1 and Refk SELMI2
Abstract: This paper attempts to assess empirically the short-run dynamic between commodity price uncertainty and manufactured exports in Morocco and Tunisia. To this end, we propose a novel model Component with Multiple Threshold-GARCH (CMT-GARCH) that extends Weighted-GARCH of Bauwens and Storti (2008). Our results clearly show a positive and significant connection between commodity price volatility and manufactured exports, which is transitory for Morocco and Tunisia (except the impact of manufactured commodity price on Moroccan manufacturing sector, which is permanent).We attribute the transitory effect to the
co-movements between exporters’ economic conditions and commodity price cycles, and the
permanent effect to the low technological content of manufactured products and to the lack of innovative capacity.
Keywords: Commodity price uncertainty; manufactured exports; CMT-GARCH.
1
CATT, University of Pau, France. E-mail : jamal.bouoiyour@univ-pau.fr
2
1. Introduction
The recent boom and bust in commodity prices have improved the plethora of studies analyzing the commodity price uncertainty. Due to the remarkable increase in commodity prices over the past decades and the sizeable volatility that has accompanied these prices, various studies have investigated their determinants and their possible detrimental macroeconomic effects (Deaton (1999), Cashin et al. (2002) and Pyndic (2004)). Other stream of literature has highlighted the difficulty to tackle the causes of this volatility (Guillaumont (1987) and Larson et al. (1998)) and has found a strong asymmetry of price cycles (Deaton and Laroque, 1992) and a high persistence of shocks (Cashin et al. 2004).
This study falls within the scope of previous works on commodity price uncertainty but focuses more accurately on its effects on manufactured exports. Since developing countries specialize in volatile sectors (Cashin et al. (2002) and David et al. (2011)), an investigation of the impact of commodity price volatility on exports in Morocco and Tunisia is warranted. This article provides new issues using a novel GARCH model, called CMT-GARCH, that accounts for switching regime, time varying between high and low volatility periods, transitory and permanent components and leverage effect. The aim of this contribution is to promote a better understanding of all the possible effects of commodity price uncertainty on the performance of manufacturing sector.
The remainder of the paper is structured as follows: Section 2 describes our data and presents a novel model, called CMT-GARCH, that extends the Weighted-GARCH model proposed by Bauwens and Storti (2008). Section 3 presents our main results and some
economic implications. Section 4 concludes.
2. Data and methodology
Our study seeks to evaluate the assumption about the existence of switching regime, transitory, permanent and leverage effects in the link between commodity price uncertainty and manufactured exports. Considering the absence of leverage effect, the Weighted-GARCH model of Bauwens and Storti (2008) seems restrictive. To resolve this gap, our proposal accounts for switch and time varying across multiple regimes (Gosten et al. (1993) and Bauwens and Storti (2008)), transitory and permanent components (Ding et al. 1993) and time dependent structure in the asymmetry of conditional variance (Caporin and McAleer, 2008).
Based on the above explanations, we believe that it is of utmost importance to use CMT-GARCH model for three main reasons: (i) the excessive volatility of supply leads to changes in demand conditions and thereby to multiple commodity price regimes, implying the need to account for threshold effects and structural breaks in conditional variance; (ii) the possible intervention of monetary authorities in exchange market prompts us to account for good and bad news, not just the magnitude of shock (i.e. leverage effect); (iii) the distinction between temporary and permanent commodity price effects (Arezki et al. 2011) leads us to decompose the impact of changes in commodity prices and those of manufactured exports into a long-run time varying trend and short-run deviations from trend.
Before presenting our model, we consider an indicator that replaces the simple change of manufactured exports in accordance with fluctuations in commodity price indices. We use data for the period from 2002:M10 to 2009:M11 collected from International Monetary Fund (IMF) and Econstats. The time horizon depends on data availability.
where rMXPt is the return of manufactured exports price which is determined with the value of
manufactured exports in US dollar.
) /
log( 1
t t
CP CP CP
r
(2)
whererCPt is the return of commodity price ; CPis equal to MCP,ACP,ICPand ECP
which correspond respectively to manufactured commodity price index, agricultural and raw
materials price index, industrial commodity price index and energy commodity price index.
To assess the nexus between commodity price uncertainty and manufactured exports, we apply a linear model expressed as follows:
r
MXPt
r
CPt
t (3)where is the focal parameter in equation (3), which can be significant or insignificant
depending on whether commodity prices returns are linked to changes in manufactured
exports;
t is the error term; the residues are different for the considered equations.To introduce the CMT-GARCH, we start by a standard GARCH (Bollerslev, 1986):
p i j t j q i i t i t 1 2 1 22
(4)
where
t2: conditional variance; : reaction to a shock; : ARCH term; : GARCH term.The CMT-GARCH takes into account the time varying between multiple regimes.
p
i j t j i t i q i i
t I t i
1 2 2
( 1
2 ( )
0
(5)
where It: denotes the information set available at time t ; : leverage effect.
Our proposal captures both transitory and permanent components.
( ) ( ) ( ) 2 2 1 2 2 1 2
2
t t t (6)
where 2
denotes the unconditional variance, which is equal /(1) ; (t22)
describes the transitory component which converges to zero with power ();/(1)
describes the permanent component which converges to /(1 ) with power .
As the CMT-GARCH is a component with multiple threshold orders, we combine equations (5) and (6). Ultimately, we obtain:
2 2 2 2 ) ( 2
1 ( 2 0 )
t t
t I t
(7)
( ) ( ) ( ( ) ) 2 2 2 2 2 ) ( 2 2 1 2 2 0
2
t t t t t
I (8)
2 2 2 2 2 ) ( 2 1 2 ) 1 ( ) ) ( ( 0
2
t t It t t (9)
( ( ) ) 2 2 2 2 ) ( 2 1 2 0
2
t t t
t I t
3. Summary of empirical findings
3.1.Preliminary analysis
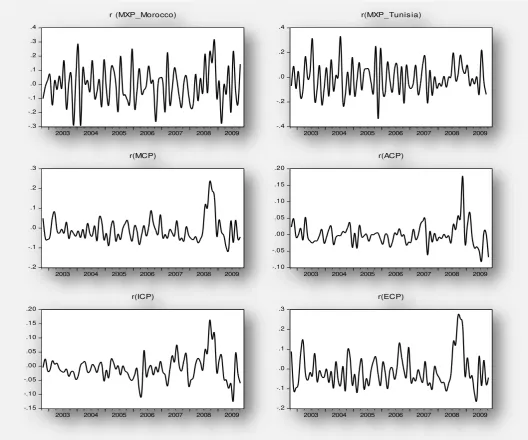
[image:5.595.28.557.280.720.2]The goal of this study is to investigate the effects of commodity prices uncertainties on manufactured exports. To this end, we start with a descriptive analysis of the evolution of the prices of commodities and those of exports in both Morocco and Tunisia. It is well documented from Figure 1 that commodity price returns have moved widely from late 2002 to late 2009. The volatility appears substantial and permanent. The aftermath of the current global economic crisis is associated to commodity price peack in 2008. In this period, the manufactured exports was significantly higher compared to previous years, especially for Moroccan case. Additionally, we notice a significant relationship between the two variables under consideration.
Figure 1. Changes in commodity prices and manufactured exports
Notes: MCP : manufactured commodity prices ; ACP : Agricultural and raw materials prices ; ICP : Industrial inputs prices;
ECP : Energy commodity prices ; MXP : manufactured exports prices ; r : returns ; Source : IMF primary commodity tables (2005=100)for the period from 2002:M10 to 2009:M11.
-.3 -.2 -.1 .0 .1 .2 .3 .4
2003 2004 2005 2006 2007 2008 2009
r (MXP_Morocco)
-.4 -.2 .0 .2 .4
2003 2004 2005 2006 2007 2008 2009
r(MXP_Tunis ia)
-.2 -.1 .0 .1 .2 .3
2003 2004 2005 2006 2007 2008 2009
r(MCP)
-.10 -.05 .00 .05 .10 .15 .20
2003 2004 2005 2006 2007 2008 2009
r(ACP)
-.15 -.10 -.05 .00 .05 .10 .15 .20
2003 2004 2005 2006 2007 2008 2009
r(ICP)
-.2 -.1 .0 .1 .2 .3
2003 2004 2005 2006 2007 2008 2009
Next, we report the descriptive statistics in Table 1. The coefficient of kurtosis is less
than 3 for all returns (except r2 for Morocco and r3 for Tunisia), implying that the distribution
[image:6.595.22.579.173.417.2]is less flattened than the Gaussian distribution. The skewness coefficient is positive, indicating that the asymmetrical distribution is plausible. From Jarque Bera test, we find low values, leading to accept the assumption of normality for all considered time series returns.
Table 1. Bivariate descriptive statistics
Morocco Tunisia
r1 r2 r3 r4 r1 r2 r3 r4
Mean 0.00074 -0.00863 -0.00129 0.003026 0.000314 -0.00906 -0.001722 0.002595
Median -0.01513 -0.00942 -0.00652 -0.00959 -0.007984 -0.00904 -0.009054 -0.002408
Maximum 0.31681 0.31356 0.35546 0.334704 0.366826 0.33595 0.341389 0.410780
Minimum -0.26495 -0.34593 -0.31661 -0.26392 -0.306100 -0.34015 -0.292457 -0.309255
Std. Dev. 0.13769 0.13556 0.13645 0.148203 0.139870 0.12930 0.135001 0.152862
Skewness 0.23687 0.01230 0.29050 0.222600 0.269968 0.38696 0.452339 0.165099
Kurtosis 2.71669 2.97342 3.18490 2.506000 2.781688 3.29344 2.910241 2.701655
Jarque-Bera 1.06645 0.00459 1.30112 1.547837 1.187168 2.39772 2.892740 0.693142
Notes : r1: changes in the link between manufactured exports prices and manufactured commodity price, r2: changes in the
link between manufactured exports prices and agricultural and raw materials commodity price, r3: changes in the link
between manufactured exports prices and industrial commodity price, r4 : changes in the link between manufactured exports
prices and energy commodity price ; Source : IMF and Econstats.
Table 2. Comparison between CMT-GARCH and Weighted-GARCH
Morocco Tunisia
CMT-GARCH Weighted-GARCH CMT-GARCH Weighted-GARCH
Link 1
AIC -1.204 -1.093 -1.145 -1.076
BIC -0.974 -0.901 -0.913 -0.813
HQ -1.111 -1.009 -1.052 -0.977
RMSE 0.132505 0.133292 0.128233 0.128276
MAE 0.106013 0.106273 0.104301 0.104380
BP 0.000005 0.010490 0.000003 0.000441
LIK 59.170 52.116 56.099 53.04
Link 2
AIC -1.112 0.722 -1.166 0.813
BIC -0.882 0.689 -0.935 0.734
HQ -1.020 0.709 -1.073 0.791
RMSE 0.133691 0.137065 0.127456 0.127455
MAE 0.106640 0.109038 0.102440 0.102455
BP 0.000544 0.016752 0.000340 0.000396
LIK 55.281 50.023 56.993 51.314
Link 3
AIC -1.126 0.907 -1.142 0.894
BIC -0.892 0.865 -0.911 0.837
HQ -1.033 0.883 -1.049 0.862
RMSE 0.134827 0.134662 0.128345 0.128391
MAE 0.107577 0.106515 0.104330 0.104484
BP 0.011443 0.012954 0.000011 0.000436
LIK 55.872 51.103 55.981 50.761
Link 4
AIC -1.172 1.113 -1.146 1.107
BIC -0.942 0.986 -0.915 0.970
HQ -1.079 1.106 -1.053 0.993
RMSE 0.133227 0.133305 0.128446 0.128554
MAE 0.106771 0.106652 0.104610 0.104627
BP 0.000876 0.000017 0.000466 0.01064
LIK 57.812 50.833 56.160 51.269
3.2.Estimates
3.2.1. The effect of manufactured commodity price uncertainty
on manufactured exports
The manufactured commodity price volatility affects positively and significantly changes in manufactured exports (Link 1, Table 3). The positive linkage implies that Morocco
and Tunisia are driven by external demand.3 This effect is stronger in the first country rather
than the second one. We show that an increase by 10 % of manufactured price volatility leads to an increase in Moroccan manufactured exports instability by 3.37% compared to 2.1% in Tunisian case. The apparent strong correlation between the two variables may be due to the lack of differentiation among producers and exporters (Page and Hewitt, 2001), to the purely competitive markets and then to the lack of innovative capacity. Furthermore, we find a much greater sensitivity of the volatility component to the lagged squared shock in the first
component than in the second one (
1
2). This result implies that in turbulent periods, thevolatility tends to be more persistent and less vulnerable to external shocks than in tranquil periods (Bauwens and Storti, 2008).
3.2.2. The effect of primary commodity price uncertainty on
manufactured exports
To investigate the relationship between changes in primary commodity prices and
manufactured exports, we consider three commodity’indices: agricultural and raw materials
price, industrial price and energy price indices. For agricultural commodity price, we note that an increase by 10% implies an increase by 0.61% of manufactured exports instability in Morocco compared to 4.4% in Tunisia (Link 2, Table 3). However, the industrial price affects more intensely Moroccan exports, i.e. an increase by 10% in the industrial prices leads to an increase in manufactured exports instability by 0.84% in Tunisia compared to 2.71% in
Morocco (Link 3, Table 3). For energy price, the effect on manufactued exports appears
positive and significant for Tunisia and insignificant for Morocco (Link 4, Table3). Unsurprisingly, this insignificant relationship may be mainly owing to the very low
energy’share in Moroccan manufactured exports (Bouoiyour and Selmi, 2014). It is also
worth noting, that in tranquil periods, the volatility tends to be less persistent and more sensitive to shocks than in turbulent periods (
1
2;
1
2) for all studied cases (Table 3).To sum up, an extra volatility of commodity prices leads to an excessive instability of manufactured exports. The impact of manufactured prices appears more pronounced for the case of Moroccan manufacturing sector, whereas Tunisian exports seem more influenced by agricultural price volatility. The energy price uncertainty affects significantly Tunisian exports and insignificantly those of Morocco. Given these observed outcomes, Tunisia behaves better than Morocco for two main reasons. Firstly, Tunisia is not heavily specialized in agricultural and energy products, which allows it to be less vulnerable to natural and
external shocks. Secondly, the low technological content of manufactured products4 leads to a
great senstivity of Moroccan manufacturing sector to manufactured price uncertainty.
1
The effect of manufactured price can be also negative according to whether the small open commodity exporters are driven by external demand or external supply effects (IMF report, 2012).
4
If we consider the R & D as a percentage of GDP as a proxy for technology, we find that Morocco spends 0.7% of its national wealth on R & D in 2009, while Tunisia devotes 1.1% of its wealth in the same year (the World Bank:
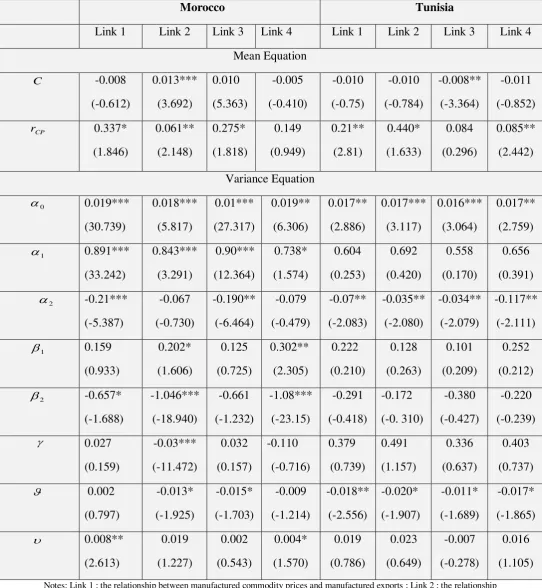
Table 3. Equations of manufactured exports: Parameters of CMT-GARCH
Morocco Tunisia
Link 1 Link 2 Link 3 Link 4 Link 1 Link 2 Link 3 Link 4
Mean Equation C -0.008 (-0.612) 0.013*** (3.692) 0.010 (5.363) -0.005 (-0.410) -0.010 (-0.75) -0.010 (-0.784) -0.008** (-3.364) -0.011 (-0.852) CP r 0.337* (1.846) 0.061** (2.148) 0.275* (1.818) 0.149 (0.949) 0.21** (2.81) 0.440* (1.633) 0.084 (0.296) 0.085** (2.442) Variance Equation 0 0.019*** (30.739) 0.018*** (5.817) 0.01*** (27.317) 0.019** (6.306) 0.017** (2.886) 0.017*** (3.117) 0.016*** (3.064) 0.017** (2.759) 1 0.891*** (33.242) 0.843*** (3.291) 0.90*** (12.364) 0.738* (1.574) 0.604 (0.253) 0.692 (0.420) 0.558 (0.170) 0.656 (0.391)
2 -0.21***
(-5.387) -0.067 (-0.730) -0.190** (-6.464) -0.079 (-0.479) -0.07** (-2.083) -0.035** (-2.080) -0.034** (-2.079) -0.117** (-2.111) 1 0.159 (0.933) 0.202* (1.606) 0.125 (0.725) 0.302** (2.305) 0.222 (0.210) 0.128 (0.263) 0.101 (0.209) 0.252 (0.212) 2 -0.657* (-1.688) -1.046*** (-18.940) -0.661 (-1.232) -1.08*** (-23.15) -0.291 (-0.418) -0.172 (-0. 310) -0.380 (-0.427) -0.220 (-0.239) 0.027 (0.159) -0.03*** (-11.472) 0.032 (0.157) -0.110 (-0.716) 0.379 (0.739) 0.491 (1.157) 0.336 (0.637) 0.403 (0.737)
0.002
(0.797) -0.013* (-1.925) -0.015* (-1.703) -0.009 (-1.214) -0.018** (-2.556) -0.020* (-1.907) -0.011* (-1.689) -0.017* (-1.865) 0.008** (2.613) 0.019 (1.227) 0.002 (0.543) 0.004* (1.570) 0.019 (0.786) 0.023 (0.649) -0.007 (-0.278) 0.016 (1.105)
Furthermore, our results reported in Table 4 reveal that the duration of persistence appears stronger when considering the Link 1 (the link between manufactured commodity price and manufactured exports) of Morocco and the Link 2 (the link between agricultural price and manufactured exports) of Tunisia. The leverage effect is always positive either in
Morocco or in Tunisia (except the industrial commodity’s effect on Moroccan exports). This
[image:10.595.29.568.240.560.2]result indicates that bad news affect more Moroccan manufactured exports than good news. To some extend, the lack of industry’s competitiveness may be the main factor behind this finding. We also show that the intensity of negative shocks is much more pronounced than that of positive shocks in all cases. Typically, negative shocks tend to have more impact on volatility than positive shocks of the same magnitude (Francq and Zakoin, 2010).
Table 4. Persistence of commodity price uncertainty’s effect on manufactured exports
Morocco Tunisia
Link 1 Link 2 Link 3 Link 4 Link 1 Link 2 Link 3 Link 4
Duration of persistence
0.5
1 1
q
i
p
j j i
0.20 0.08 0.17 0.19 0.64 0.85 0.41 0.77
Intensity of shock
q
i i
1
q
i i
1
0.68
-0.66
0.74
-0.81
0.54
-0.76
0.75
-0.68
0.90
-0.14
1.14
-0.24
0.86
-0.18
0.94
-0.13
Leverage effect
0.02 0.03 -0.11 0.03 0.37 0.49 0.33 0.40ARCH and GARCH effects
q
i
p
j j i
1 1
0.19 0.06 0.18 0.12 0.45 0.61 0.24 0.57
Notes: Link 1 : the relationship between manufactured commodity prices and manufactured exports ; Link 2 : the relationship between agricultural and raw materials prices and manufactured exports ; Link 3 : the relationship between industrial inputs prices and manufactured exports; Link 4 : the relationship between energy prices and manufactured exports; : ARCH effect; : GARCH effect; : leverage effect.
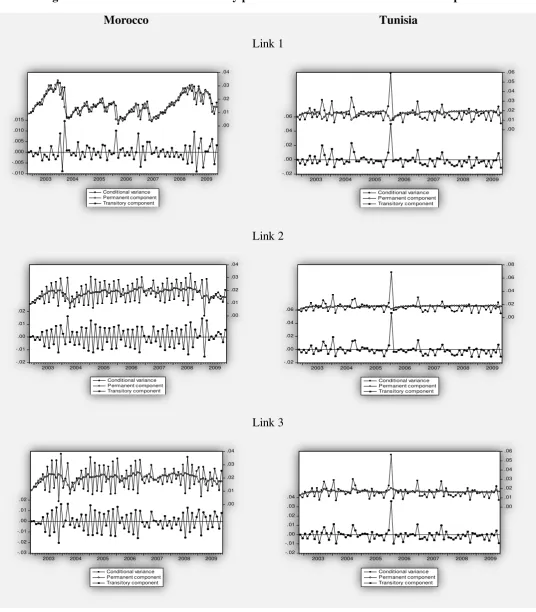
We then graphically analyze the focal relationship. We depict from Figure 2 that the association between Moroccan primary commodity prices uncertainties (except energy
commodity price5) and manufactured exports depends only to transitory effect (i.e. cycle)
with negligible dependence to permanent effect (i.e. trend), whereas its relation with manufactured commodity price seems permanent. However, the link between Tunisian manufactured exports and the prices of all commodities under consideration depends only to transitory effect. This is consistent with the coefficients associated to transitory and
permanent components (and, respectively) reported in Table 3. These mixed results may
5
We cannot confirm that the link between energy commodity price and Moroccan manufactured exports is permanent
be explained as follows : (i) The transitory effect implies that there are co-movements
between exporters’economic conditions and commodity price cycles; (ii) The permanent
[image:11.595.29.566.161.774.2]effect may be intensely attributed to the low technological content of manufactured products, the lack of innovative capacity and to the difficulty of projecting commodity market prospects in the real time (IMF report, 2012).
Figure 2. The link between commodity prices uncertainties and manufactured exports
Morocco Tunisia
Link 1 Link 2 Link 3 -.010 -.005 .000 .005 .010 .015 .00 .01 .02 .03 .04
2003 2004 2005 2006 2007 2008 2009
Conditional variance Permanent component Transitory component -.02 .00 .02 .04 .06 .00 .01 .02 .03 .04 .05 .06
2003 2004 2005 2006 2007 2008 2009
Conditional variance Permanent component Transitory component -.02 -.01 .00 .01 .02 .00 .01 .02 .03 .04
2003 2004 2005 2006 2007 2008 2009 Conditional variance Permanent component Transitory component -.02 .00 .02 .04 .06 .00 .02 .04 .06 .08
2003 2004 2005 2006 2007 2008 2009 Conditional variance Permanent component Transitory component -.03 -.02 -.01 .00 .01 .02 .00 .01 .02 .03 .04
2003 2004 2005 2006 2007 2008 2009
Conditional variance Permanent component Transitory component -.02 -.01 .00 .01 .02 .03 .04 .00 .01 .02 .03 .04 .05 .06
2003 2004 2005 2006 2007 2008 2009
Link 4
3.3.Some economic implications
The above findings can elucidate the understanding of policy advisors and practitioners in international commodity markets about the impact of commodity price uncertainty on trade performance in Morocco and Tunisia.
The strong effect of commodity price volatility on manufactured exports in the concerned countries may be owing to the fact that this relationship depends closely to the degree to which the exports are diversified. Taking a closer look at Figure A.1 (Appendix), the commodities ranked at the top four in 2002 are the same as those ranked at the top four in 2009 and they still accounted a high percentage (Dogruel and Tekce, 2010). Moroccan and Tunisian exports are dominated by intensive margin (i.e. exports of the same products
varieties over time). However, when the values of concentration index6are compared, we
show that exports have become less concentrated, especially for Morocco (Figure A.2, Appendix). This means that both countries try to diversify their products but this effort is insufficient. In addition, given that these economies are highly dependent on European markets (73% of Moroccan exports and 74% of Tunisian exports are destinated to Europe (CIA, Factbook 2009)), the effect of commodity price uncertainty on manufactured exports can be mitigated through proper diversification of export destinations especially with the aftermath of the current economic crisis.
Other explanations are the problems of the narrowness of Moroccan and Tunisian markets, the low technological content of their products and the lack of capacity to innovate with the weakness in machinery. The specialization in low-cost products allows the partners in the North to explore these countries as export platform without any real transfer of technology. This can lead to a great sensitivity to external shocks (Hausmann et al. (2007) and Arezki et al. (2011)). Unfortunately, Morocco and Tunisia have various institutional problems to deal with shocks. It seems difficult for these economies to develop efficient market
4
We use here Herfindhal-Hirshman index. It is the most commonly used statistic for measuring concentration, which sums the squared shares of each commodity in total exports (Dogruel and Tekce, 2010). The index takes values from zero to one, the higher representing greater concentration.
-.010 -.005 .000 .005 .010 .015
.00 .01 .02 .03 .04
2003 2004 2005 2006 2007 2008 2009
Conditional variance Permanent component Transitory component
-.02 .00 .02 .04
.06 .00
.02 .04 .06 .08
2003 2004 2005 2006 2007 2008 2009
instruments (Bouoiyour and Selmi, 2014). Given this hard enough, how should Morocco and Tunisia shield their exports performance from commodity price uncertainty?
Market integration can help policy makers to react effectively to commodity price volatility. This underlines the viewpoint made by David et al. (2011) that economic isolation leads to greater commodity price instability, while world market integration lessens it. This means that the intensity of shocks can be mitigated by the integration of small local markets as Morocco and Tunisia with large world markets. However, integration into world markets may expose these economies to world demand instability generated by cyclical booms and
busts that characterize their main partners. Given this economic integration’ drawback,
diversification in commodity basket and export destinations can be the best solutions for these economies to reduce their sensitivity to the adverse trade effects of commodity price
uncertainty. This can be achieved by: (i) integrating commodity policies into a country’s
development strategy; (ii) enhancing market transparency; (iii) improving compensatory financing scheme and the quality of information regarding the nature of price movements in world commodity markets that are both relevant and important for the conduct of trade policy (Dehn, 2000); (iv) removing trade barriers and lowering transactions costs (Hausmann et al. 2007), and (v) strengthening product quality through effective implementation of a quality management system.
4. Conclusion
The aim of this paper is to gauge empirically the short-run dynamic between commodity price uncertainty and manufactured exports in Morocco and Tunisia. To this end, we propose a novel model, named CMT-GARCH, that accounts for time varying across multiple regimes, transitory and permanent components, and time dependent structure in the asymmetry of conditional variance.
Our results show a positive and significant connection between changes in commodity price and those of manufactured exports. These findings provide the main requirements for the adequacy of the proposed model in analyzing the focal relationship. First, there exists a significant short-run dynamic between these variables. Second, this link depends on switching regime and leverage effect. Third, this effect is transitory for Morocco and Tunisia (except the impact of Moroccan manufactured price instability on manufacturing sector, which appears unpleasantly permanent).There are obviously various routes through which commodity price uncertainty transitory or permanently affect manufactured exports, such as the co-movements
between exporters’ economic conditions and commodity price cycles, the low technological
content of manufactured products, the high dependence to European markets and the weakness of hedging instruments to manage negative shocks, among others.
To conclude, the present article provides two main evidences:
(i) The diversification in commodity basket and export destinations as well as the
improvement in product quality remain the main solutions to mitigate the possible detrimental effects of commodity price volatility on manufactured exports performance.
(ii) The adequacy of CMT-GARCH in analyzing the dynamic between commodity
References
Arezki, R., Lederman, D. and Zhao, H. (2011) “The relative volatility of commodity prices: a
reappraisal” IMF Working Papers 12/168, International Monetary Fund.
Bauwens, L. and Storti, G. (2008) “A component GARCH model with time varying weights”
Manuscript 1512 Studies in nonlinear dynamics and econometrics.
Bollerslev, T. (1986) “Generalized autoregressive conditional heteroskedasticity” Journal of
Econometrics, 31, 307-27.
Bouoiyour, J. and Selmi, R. (2014) “Exchange volatility and trade performance in Morocco
and Tunisia : What have we learned so far ?” Macroeconomics and Finance in
Emerging Market Economies, Forthcoming.
Caporin, M. and McAleer, M., (2008) “Scalar BEKK end indirect DCC” Journal of
Forecasting, 27(6), 537-49.
Cashin P., McDermott, C. and Scott, A. (2002) “Booms and Slumps in World Commodity
Prices” Journal of Development Economics, 69, 277– 96.
Cashin, P., McDermott, C., John and Pattillo, P. (2004), “Terms of trade shocks in Africa are
they short-lived or long-lived?” Journal of Development Economics, 73, pp. 727-744.
David S. J., O'Rourke, K.H. and Williamson, J.G. (2011) “Commodity Price Volatility and
World Market Integration since 1700, ” The Review of Economics and Statistics, 93(3),
800-13.
Deaton, A. and Laroque. G. (1992) “On the Behaviour of Commodity Prices” Review of
Economic Studies, 59 (1), 1-23.
Deaton, A. (1999) “Commodity Prices and Growth in Africa” Journal of Economic
Perspectives, 13(3), 23-40.
Dehn, J. (2000) “Commodity Price Uncertainty and Shocks: Implications for Economic
Growth” Working paper University of Oxford WPS/2000-12.
Ding, Z., Granger, C.W.J. and Engle, R.F. (1993) “A long memory property of stock market
returns and a new model” Journal of Empirical Finance, 1, 83-106.
Dogruel, A. and Tekce, M. (2011) “Trade liberalization and export diversification in selected
MENA countries” Topics in Middle Eastern and African Economies, 13, 1-24.
Francq, C. and Zakoïan, J-M. (2010) “QML estimation of a class of multivariate asymmetric
GARCH models” Discussion paper CREST.
Gosten, L. R., Jagannathan, R. and Runkle, D. E. (1993) “On the relation between the
expected value and the volatility of the nominal excess return on stocks” The Journal of
Finance, 48 (5), 1779-1801.
Guillaumont, P. (1987) “From export instability effects to international stabilization policies”
World Development, 15(5), 633-43.
Hacker, S-R.and Hatemi, J-A. (2008) “Optimal lag-length choice in stable and unstable VAR
models under situations of homoscedasticity and ARCH”Journal of Applied Statistics,
35(6). 601-15
Hansen, P.R. and Lunde, A. (2001) “A comparison of volatility models: Does anything beat a
GARCH (1, 1)?” Working paper n°84, University of AARHUS.
Hausmann, R., Hwang, J. and Rodrik, D. (2007) “What you export matters” Journal of
International Monetary Fund, IMF, (2012) “Commodity price swings and commodity
exporters ” http://www.imf.org/external/pubs/ft/weo/2012/01/pdf/c4.pdf
Larson, D-F., Varangis, P. and Yabuki, N. (1998) “Commodity Risk Management and
Development” World Bank Policy Research Paper n° 1963.
Page, S. and Hewitt, A. (2001) “World commodity prices: Still a problem for developing
countries” Working paper Overseas Development Institute, London.
Pyndick, R-S. (2004) “ Volatility and commodity price dynamics”the Journal of Future
Markets, 24(11), 1029-47.
[image:15.595.38.564.250.456.2]Appendix
Figure A.1. Shares of top four products in total manufactured exports
Source : Authors’calculation and UN COMTRADE data.
Figure A.2. Export concentration (Herfindhal-Hirschman index)
Source : Authors’calculation and UN COMTRADE data.
28 32 36 40 44 48
2002 2003 2004 2005 2006 2007 2008 2009
34.0 43.6
35.1 41.4
34.1 39.8
30.5 38.8
32.7 36.7
30.2 37.1
40.5
36.6
30.8 34.1
MOROCCO TUNISIA
.036 .040 .044 .048 .052 .056 .060 .064 .068
2002 2003 2004 2005 2006 2007 2008 2009
0.0490 0.0629
0.0506 0.0622
0.0472 0.0593
0.0431 0.0543
0.0447 0.0497
0.0419 0.0513
0.0598
0.0513
0.0414 0.0446
[image:15.595.37.566.504.755.2]