Structural change of Bihar economy
during 1999 to 2010: a district level
analysis
Santra, Swarup and Kumar, Rajesh and Bagaria, Nidhi
Satyawati College, University of Delhi, Ashok Vihar, Delhi, India ,
Satyawati College, University of Delhi, Ashok Vihar, Delhi, India ,
Kalindi College, University of Delhi, New Delhi, India
19 January 2014
Online at
https://mpra.ub.uni-muenchen.de/53285/
12 9 Vol 2 Issue 1 Januar y, 2014
THE INTERNATIONAL JOURNAL OF
HUMANITIES & SOCIAL STUDIES
Structural Change of Bihar Economy during 1999 to 2010:
A District Level Analysis
1. Introduction
Conventionally, the economic growth of a country is appraised in the form of gross domestic product (GDP), as this measure incorporates the performances of all kinds of economic activities undertaken in the country (Panda, 2008). Bihar is considered to be one of the most underdeveloped states in India, with the latest estimated population of 94.5 million. In Bihar, the per capita net state domestic product (NSDP) is the lowest among the major states in Inida, and it is only one-third of the national level of per capita GDP (Tsujita, et. Al., 2010). According to the estimates of the National Sample Survey Organisation (NSSO) in 2004-05 show that the incidence of poverty1 is 42.1% in rural area of Bihar, that is much grates than the 28.3% in rural area of all India. The social development progress, like education and health, is also slower than that of other states (Tsujita, et. Al., 2010). Recently, it has been reported that economic growth in Bihar has improved, particularly in sectors such as construction, hotels, restaurants, communication and trade. And that growth largely comes from the non-agricultural sector and the urban areas rather than from the agricultural sector. Morever, alsmost 70% of the workforce in Bihar are engaged or from the rural areas. Bihar is also experiencing from growing intra-state disparity. For an example, the per capita gross district domestic product (GDDP) for Patna district is by far the highest among the 38 districts in Bihar (Tsujita, et. Al., 2010). The difference has also increased at district level, in recent years, with the ratio of per capita GDDP in Patna district to that of Sheohar district, which has the lowest income in Bihar, increasing sharply from 3.3 in 1998-99 to 8.6 in 2006-07 (GoB. 2007, 2010).
For this present study, the recent period of development in Bihar is divided three phase; namely, a) First phase, pre-bifurcation period, b) Second phase, Bihar under Ravri Devi Govt. after bifurcation phase, and c) Third phase, Bihar under Nitish Kumar Govt. in post 2005 era. And these divisions are characterized by the political and geographical factors. These three phases are described below in brief:
1
Incidence od poverty is defined as the percentage of the population below the poverty line in terms of monthly per capita expenditure.
Swarup Santra
Assistant Professor in Economics, Satyawati College, University of Delhi, Ashok Vihar, Delhi, India
Rajesh Kumar
Assistant Professor in Economics, Satyawati College, University of Delhi, Ashok Vihar, Delhi, India
Nidhi Bagaria
Assistant Professor in Economics, Kalindi College, University of Delhi, New Delhi, India
Abstract:
Conventionally, the economic growth of a country is appraised in form of gross domestic product (GDP). In Bihar, the per capita net state domestic product (NSDP) is the lowest among the major states in Inida, and it is only one-third of the national level of per capita GDP. The services, industry, and agricultural sectors contributed 52 per cent, 28 per cent, and 20 per cent to India’s overall GDP respectively, in 2006. However, the contribution of these major sectors to GDP at state level is not uniform. For Bihar at state level, the share of primary sector1 is continuously decreasing over the stated time period. For the secondary1 sector, the share had decreased after bifurcation of Bihar, however, that share increased a little bit in 2009-2010. And similar to the India average, the share for Tertiary sector is continuously increasing at 60% of NDDP. The dictrics like Patna, Begusarai, Munger and Bhagalpur which are higher per capita NDDP, are very less share in primary sector. The most important part here is the very low share of industrial sector. However, the share of industrial sector has started increased during the period 2005-2010. Structure of Bihar’s economy is changing not only at state level, but at district level also. And these changes need to be more casious planning and good initiatives from Govt. And the change is already in its way.
13 0 Vol 2 Issue 1 Januar y, 2014
1.1.First Phase: Pre-bifurcation Economy of Bihar
The first period is the Bihars’s pre-bifurcation economy. This is the period when the structure of the economy, its resources, and its politics were noticeably different from the Bihar after bifurcation in November, 2000. The districts that constitute Bihar and Jharkhand today are always very different in characteristics, such as socially and economically. Moreover, “Jharkhand is rich in mineral deposits and has been the home for manufacturing activities. On the other hand, districts constituting Bihar have large swathes of alluvial soil, often replenished by flood waters, which are particularly suitable for agriculture” (Mukherji & Mukherji, 2012). At that time period the level of economic output was stagnated. And there was a substantial change in the structure of Bihar’s economy. It transforms from being largely an agricultural economy to an economy in which the services and industrial sectors contributed considerably. Bihar were more like an agrarian economy in output than India average, whereas its transformation into a services-based economy, like all India average, was evidently in progress. “This large restructuring of the economy over the period 1980-2000 is quite striking, not only because of the very limited expansion of economic output accompanying it, but also due to the very limited change in employment structure that took place simultaneously. In 1999-2000, over 715 out of every 1,000 employed rural males and 845 out of every 1,000 employed rural women were engaged in agriculture. In comparison, the services sector for rural men employed a meagre 161 out of every 1,000 employed rural males, and the number was lower for women. In the few urban pockets of Bihar (largely located around Patna) employment in services was dominant, particularly for men, and over time, the number employed in services has been gradually increasing” (Mukherji & Mukherji, 2012). Ghosh and Gupta (2010) argue that due to the lack of expansion in the non-agricultural sector, there is a limited expansion in output in Bihar. Employment scenario during that period also clearly shows that the non-agricultural sector was unable to draw people out of agriculture to non-agricultural sector.
1.2.Second Phase: Bihar under Ravri Devi Govt. in Post-bifurcation
The political bifurcation of undivided Bihar into today’s Bihar and Jharkhand brought to fore the need for norms on how financial and infrastructural resources would be shared across the two new states. This process of bifurcation was very asymmetric – while all physical assets came to Jharkhand, and other financial liabilities were distributed using population norms. “Bihar grew absolutely and relatively poorer simply due to this bifurcation. At the time of bifurcation, serious concerns were expressed about whether the ‘reduced’ Bihar could even form a viable state on economic grounds” (Bhattacharya 2000). Rashtriya Janata Dal (RJD) was in power during this period under the leadership of Ravri Devi. “Consequently, not only was Bihar’s economy different prior to 2000, but the prospects for growth before and after bifurcation were also very different. Changes in statistics such as poverty ratios, per capita incomes and Human Development Indicators (HDI) across these two time-frames are thus different, not only because the people and economic resources were split across Bihar and Jharkhand, but also because these factors would accumulate in Bihar and Jharkhand at different rates” (Mukherji & Mukherji, 2012). The bifurcation artificially secure Bihar’s transformation into a services-led economy that has become more dependent on the services sector, and still remains one of the poorest states in India. According to Simon Kuznets, the key features of modern economic growth seen in an economically dominant nation is the structural “… shift away from agriculture to non-agricultural pursuits and, recently, away from industry to services; a change in the scale of productive units, and a related shift from personal enterprise to impersonal organization of economic firms, with a corresponding change in the occupational status of labor” (Kuznets 1971). The most income of Bihar now comes basically from the services sector, but the agricultural labor still not moving out to non-agricultural services2 (Mukherji & Mukherji, 2012). While this is the standard structural imbalance in the entire country, the extent of the balance is quite acute for Bihar.
1.3.Third Phase: Bihar under Nitish Kumar Govt. in Post 2005 era
The third period is the period “after the 2005 elections in Bihar when Nitish Kumar, and his political party Janata Dal (United) (JD(U)), came to power together with the Bharatiya Janta Party (BJP). This period saw major changes in policy, administrative, and overall governance changes as well as rapid economic growth. This period marks a clear break from the past, in both a statistical and qualitative sense. While many of the structural changes seen in the past continue, and the relative position of Bihar amongst other states remains as is, there is distinct increase in economic growth” (Mukherji & Mukherji, 2012). The pace of growth in per capita income has been the highest in the post 2005 period. According to Mukherji and Mukherji (2012), there was an annual fluctuations in the growth rate during the period 2005-10 saw a compounded annual growth of 8.6% for Bihar (that was significantly higher than the growth seen for India (7.04%) over the same time).
2. Background Literature
“Structural change analysis is differentiated from standard economic research in that it assumes that the infinite multiplicity of reality can be studied by focussing on a relatively small number of groups or activities that comprise the economic system, and thus form the economic structure. In this sense, a structural representation provides a selective description of the economic system, which is obtained by substituting the observed heterogeneity with sets of classes of relatively homogeneous groups of agents or sectors of activity. In this framework, the definition of structure and of the unit of analysis is made to depend on the problem under investigation. This allows for a considerable degree of flexibility that is absent from standard micro and macroeconomic analyses, thus making it an appealing tool for the study of economic dynamics” (Silva & Teixeira, 2008). Structural change analysis has an important tradition in economic theory. Fisher (1939), in his turn, adopted a tri-partite decomposition of the economy,distinguishing between primary, secondary and tertiary production. “In terms of a theoretical
2
13 1 Vol 2 Issue 1 Januar y, 2014
explanation for such sectoral changes, the Petty-Clark’s law suggests that as a country’s economy develops, the proportion of GDP generated from the primary sector declines and the proportion of GDP generated from the secondary sector increases first. After the industrial sector gathers momentum, the secondary sector dominates the economy in contributing to GDP. When the economy matures in terms of industrial development, then the contribution of the tertiary sector to GDP becomes the number one source superseding both the primary and secondary sectors” (Kalairajan and Singh, 2013).
As argued by Bhattacharya and Mitra (1990), the tertiary sector became the largest sector even before the secondary sector dominated the economy in India at the aggregate level, and also at the regional level. According to Schultz (1978), “farmers the world over, in dealing with costs, revenues and risks, are calculating economic agents. Within their small individual allocative domain they are fine-tuning entrepreneurs, turning so subtly that many experts fail to see how efficient they are”. If this vision of farmers is correct, not only could agriculture supply wage goods and inputs, but also, through technological modernisation, rising productivity, incomes and rural prosperity, the sector will stimulate growth in industry, particularly in manufacturing. For its part, industry can not only supply, agriculture with modern production inputs, but also produce consumer goods to satisfy expanding consumer horizons. This perception of the intersectoral relation amounts to a dynamic two-way relationship between agriculture and industry (Kalairajan and Singh, 2013). The Bihar economy’s gains in the post-2005 period were robust and qualitatively different from previous periods. Mukherji and Mukherji (2012) stated that the average growth rate across districts in Bihar was quite robust. While the average growth rate appears to have been stagnant in the pre-2005 period, there is a sharp rise in growth rates post 2005, indicating a period of unprecedented acceleration of the Bihar economy.
Most of the paper on Bihar talks about the growth of GDP only. There are a few works on structural changes, at the state level in Bihar. However, there is no such work was found which showing the strucutural changes in District level of Bihar. So, there is a vacuum of investigation on structural shift for Bihar. This paper is, therefore, trying to make up this research gap.
3. Objective
The objective of this paper is to find the structural shift that has taken place in the Bihar economy during the period 1999-2000 and 2009-2010, at district level. The analysis has been carried out using the data available on NDDP in three different periods, namely, 1999-2000, 2004-2005, 2009-2010. The period 1999-2000 is reflecting the scenario of the first phase, in fact at the end of the phase. The period, 2004-2005 is representing the second phase and the period 2009-2010 is that of for third phase. By using these three time periods of these three phases, the analsys of structural change is done within dynamic structure.
For this, the data was collected from the statistical handbook of Bihar and Bihar factsheets, published by the Govt. of Bihar.
4. Findings and Discussion
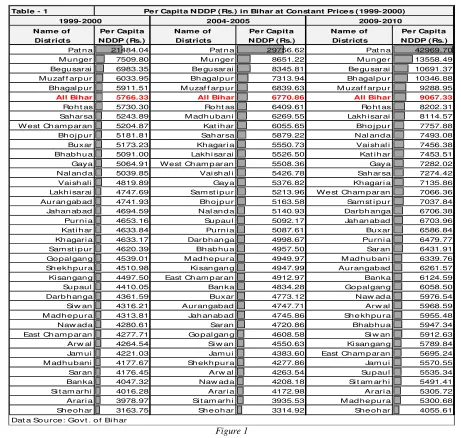
4.1.Per capita NDDP in Bihar
According to Kalairajan and Singh, (2013), the services, industry, and agricultural sectors contributed 52 per cent, 28 per cent, and 20 per cent to India’s overall GDP respectively, in 2006. However, the contribution of these major sectors to GDP at the state level is not uniform. In case of Bihar almost 60% of NSDP is coming from the services sector. In sheer levels, the most important services sector in Bihar is Trade, Hotels, and Restaurants that forms about 27.3% of NSDP by 2010. “Other Services, capturing professional incomes of lawyers, doctors, and income from teaching in non-governmental educational establishments (including tuition centers) also remains important. The fastest growth within this sector has been with the Communications sub-sector, establishing the importance of a nascent ITE&S sector in Bihar as well” (Kalairajan and Singh, 2013).
13 2 Vol 2 Issue 1 Januar y, 2014
Table - 1
Pat n a 21484.04 Pat n a 29756.62 Pat n a 42969.70
M u nger 7509.80 M u nge r 8651.22 M u nge r 13558.49
Begu sarai 6983.35 Be gu sarai 8345.81 Be gu sarai 10691.37
M u zaf f arp ur 6033.95 Bh agal p u r 7313.94 Bh agal pu r 10346.88
Bhagal p ur 5911.51 M uzaf f arp u r 6839.63 M uzaf f arpu r 9288.95
All Bihar 5766.33 All Bihar 6770.86 All Bihar 9067.33
Roh t as 5730.30 Ro ht as 6409.61 Ro ht as 8202.31
Saharsa 5243.89 M adh u ban i 6269.55 Lakh i sarai 8114.57
W est Ch am p aran 5204.87 Kat i h ar 6055.65 Bho j pu r 7757.88
Bh oj p ur 5181.81 Sah arsa 5879.22 Nal and a 7493.08
Buxar 5173.23 Khagari a 5550.73 Vai shal i 7456.38
Bhabh u a 5091.00 Lakh i sarai 5526.50 Kat i h ar 7453.51
Gaya 5064.91 West Ch am p aran 5508.36 Gaya 7282.02
Nal an d a 5039.85 Vai sh al i 5426.78 Sah arsa 7274.42
Vai sh al i 4819.89 Gaya 5376.82 Khagari a 7135.86
Lakh i sarai 4747.69 Sam st i p u r 5213.96 We st Cham p aran 7066.36
Au ran gab ad 4741.93 Bh o j p u r 5163.58 Sam st i pu r 7037.84
Jahan ab ad 4694.59 Nal an d a 5140.93 Darbh anga 6706.38
Purn i a 4653.16 Su pau l 5092.17 Jah an abad 6703.96
Kat i h ar 4633.84 Pu rn i a 5087.61 Buxar 6586.84
Kh agari a 4633.17 Darbh an ga 4998.67 Pu rn i a 6479.77
Sam st i p ur 4620.39 Bhab hu a 4957.50 Saran 6431.91
Go pal gan g 4539.01 M ad he pu ra 4949.97 M ad hu ban i 6339.76
Sh ekh pu ra 4510.98 Ki san gan g 4947.99 Aurangabad 6261.57
Ki san gan g 4497.50 East Ch am p aran 4912.97 Banka 6124.59
Su paul 4410.05 Ban ka 4834.28 Go pal gan g 6058.50
Darb h an ga 4361.59 Buxar 4773.12 Naw ad a 5976.54
Si w an 4316.21 Aurangabad 4747.71 Arw al 5968.59
M adh e pu ra 4313.81 Jah an ab ad 4745.86 Sh e kh pu ra 5955.48
Naw ad a 4280.61 Saran 4720.86 Bhab hu a 5947.34
East Ch am p aran 4277.71 Go pal gan g 4608.58 Si w an 5912.63
Arw al 4264.54 Si w an 4550.63 Ki san gan g 5789.84
Jam ui 4221.03 Jam u i 4383.60 East Cham p aran 5695.24
M adh u bani 4177.67 Sh ekh pu ra 4277.86 Jam u i 5570.55
Saran 4176.45 Arw al 4263.54 Su pau l 5535.34
Ban ka 4047.32 Naw ad a 4208.18 Si t am arh i 5491.41
Si t am arhi 4016.28 Arari a 4172.98 Arari a 5305.72
Arari a 3978.97 Si t am arh i 3935.53 M ad he pu ra 5300.68
Sh e oh ar 3163.75 Sh e oh ar 3314.92 She oh ar 4055.61
Name of Districts
Pe r Capit a NDDP ( Rs.) 2009- 2010
Pe r Capit a N DDP ( Rs.) in Bihar at Const ant Prices ( 1999- 2000)
Dat a So urce: Govt . o f Bi har N ame of
Dist rict s
Pe r Capit a NDDP ( Rs.)
1999- 2000 2004- 2005
Name of Districts
Pe r Capit a N DDP ( Rs.)
Figure 1
4.2.Structural Change at District Level
For Bihar at state level, the share of primary sector3 is continuously decreasing over the stated time period. For the secondary4 sector, the share had decreased after bifurcation of Bihar, however, that share increased a little bit in 2009-2010. And similar to the India average, the share for Tertiary5 sector is continuously increasing at 60% of NDDP.
So, overall, almost more than 50% of NDDP of Bihar is contributed by the tertiary secor. However, the importance of agriculture is not decreasing rapidly. Whereas, the share of Secondary sector is till very low in almost all districts, but increasing after 2005 election. The more details picture of share of all the three sectors during the all thre time period are shown in the table – 2, below. Very interesting part here is that the share of industry is steadily increased from 2004-05 to 2009-2010 in all the districts.
3
In Primary sector, the activities like Agriculture & Animal Husbandry, Forestry & Logging, Fishery and Mining & Quarrying.
4
In Secondary sector includes, Manufacturing (Registered), Manufacturing (Un-Registered), Construction, Electricity,Gas & Water Supply.
5
And the Tertiary Sector includes, Transport & Communication (Railways, Transport by other means, Storage, Communication), Trade Hotel and Restaurants, Banking & Insurance, Real Estate , Ownership of Dwelling,
[image:5.612.74.535.62.500.2]13 3 Vol 2 Issue 1 Januar y, 2014 Primary Sector Secondary Sector Tertiary Sector Primary Sector Secondary Sector Tertiary Sector Primary Sector Secondary Sector Tertiary Sector
1 Patna 6.21 5.78 88.01 4.31 4.01 91.68 2.91 6.20 90.89
2 Nalanda 38.98 12.28 48.74 34.26 12.91 52.83 28.59 17.72 53.69
3 Bhojpur 41.16 11.97 46.88 35.05 12.27 52.69 32.41 16.14 51.44
4 Buxar 53.06 9.63 37.31 44.76 11.98 43.27 38.56 17.43 44.01
5 Rohtas 43.99 13.12 42.89 46.12 12.20 41.68 33.91 19.06 47.03
6 Bhabhua 58.84 14.02 27.14 55.03 12.53 32.44 44.42 18.52 37.06
7 Gaya 31.16 12.21 56.63 29.15 11.66 59.19 23.73 15.24 61.03
8 Jahanabad 40.12 14.73 45.15 35.78 15.85 48.37 27.95 20.41 51.65
9 Arwal 40.88 12.01 47.11 37.46 13.68 48.86 28.06 21.72 50.22
10 Nawada 43.86 10.66 45.48 37.96 11.26 50.79 32.25 13.51 54.24
11 Aurangabad 48.95 14.12 36.94 46.33 13.22 40.45 38.66 18.04 43.30
12 Saran 34.04 14.22 51.74 36.04 13.98 49.98 24.67 21.42 53.92
13 Siwan 45.34 13.23 41.42 41.78 14.60 43.62 27.30 24.31 48.38
14 Gopalgang 46.01 15.32 38.67 47.68 16.41 35.91 34.56 25.91 39.52
15 M uzaffarpur 35.78 13.28 50.94 35.25 11.43 53.32 24.80 16.58 58.62
16 East Champaran 52.14 11.67 36.19 55.28 10.08 34.63 42.27 16.60 41.13
17 W est Champaran 54.15 12.67 33.18 53.34 11.74 34.92 43.22 17.06 39.72
18 Sitamarhi 44.25 13.36 42.39 40.12 14.59 45.29 31.89 19.61 48.50
19 Sheohar 54.91 9.12 35.98 57.27 8.93 33.80 49.76 12.74 37.49
20 Vaishali 42.78 14.67 42.55 43.96 13.23 42.82 31.17 20.31 48.52
21 Darbhanga 32.62 12.35 55.03 34.86 11.71 53.42 24.72 17.27 58.01
22 M adhubani 46.28 9.78 43.95 61.76 6.72 31.52 42.54 12.07 45.39
23 Samstipur 42.48 11.60 45.92 42.59 11.08 46.33 34.49 15.74 49.78
24 Begusarai 23.51 25.33 51.16 27.88 16.02 56.10 19.75 20.36 59.89
25 M unger 16.27 24.56 59.17 19.30 18.92 61.78 12.27 28.66 59.07
26 Shekhpura 41.42 13.11 45.47 38.82 13.98 47.21 34.00 19.51 46.48
27 Lakhisarai 32.41 14.43 53.16 32.96 14.24 52.79 26.45 21.36 52.19
28 Jamui 34.79 28.88 36.33 39.59 21.90 38.50 32.11 27.60 40.29
29 Khagaria 46.78 10.66 42.56 50.14 10.27 39.59 39.43 16.47 44.10
30 Bhagalpur 26.31 17.34 56.35 28.37 14.19 57.43 20.33 20.24 59.43
31 Banka 52.73 13.73 33.54 59.34 11.45 29.21 51.05 16.00 32.95
32 Saharsa 47.25 9.29 43.46 49.26 8.99 41.75 38.39 14.54 47.07
33 Supaul 61.29 9.07 29.64 65.32 8.55 26.13 50.37 14.60 35.02
34 M adhepura 62.49 8.20 29.31 66.77 7.01 26.22 53.26 11.19 35.54
35 Purnia 46.97 9.59 43.44 48.36 8.48 43.16 40.11 12.21 47.68
36 Kisangang 54.52 11.41 34.07 56.46 10.76 32.78 43.61 17.87 38.52
37 Araria 53.82 10.80 35.39 54.42 10.70 34.88 47.04 15.35 37.61
38 Katihar 43.71 10.96 45.33 51.02 8.89 40.09 38.87 13.52 47.60
All Bihar 34.60 11.85 53.55 33.62 10.04 56.34 24.69 14.68 60.64
Data Source: Govt. of Bihar
in 2009-2010 Pecentage (%) share of Primary, Secondary and Tertiary Sector in NDDP in Bihar during 1999-2010
in 1999-2000 in 2004-2005
Table - 2
Name of Districts Sl.
No.
Figure 2
4.2.1. Primary Sector
13 4 Vol 2 Issue 1 Januar y, 2014
Figure 3
4.2.2. Secondary Sector
[image:7.612.64.553.293.427.2]The much important sector is the secondary. After bifurcation of Bihar in 2000, today’s Bihar faced a lots of problem, because almost all industries were became a part of the new state, Jharkhand. So, after bifurcation of Bihar, the present day Bihar became just as a agrarian state. And, in thrid phase a lots of initiative was take to encourgage for industrial development under the Nitish Kumar Govt. in Bihar. That’s reflected through the almost all districts of Bihar. The most gainers districts here are Siwan, Gopalgang, Munger, Jamui, as it is shown in chart-2, below. However, the share of secondary sector is very less in comparision to Primary and Tertiary sectors.
Figure 4
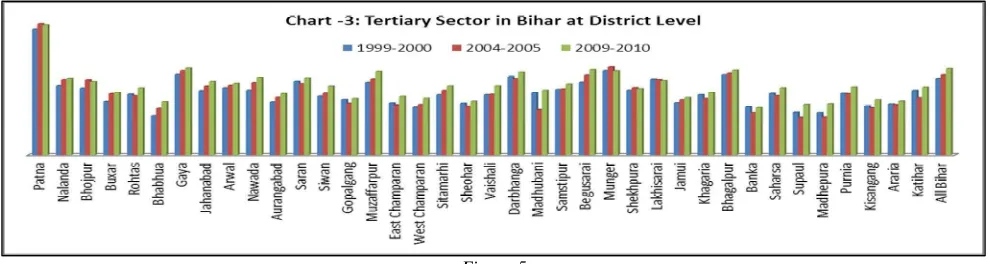
4.2.3. Tertiary Sector
The services sector has been leading growth in India since the early 1990s and this is the case for Bihar too. Eichengreen and Gupta (2011) estimate that within the services sector, sub-sectors such as communications, business services, financial services, education, health and hotels account for roughly half the services growth seen in India between 2000 and 2008. In all the districts of Bihar, the share of tertiary sector has been increasing steady. The share for Panta districts is more than 90% of its NDDP. Some districts like, Banka, Bhabhua, Sheohar, Supaul, Madhupura, Araria and Krishangang have very low share of tertiary sector in comparision to other Districs.
Figure 5
5. Concluding Remarks
[image:7.612.59.554.530.662.2]13 5 Vol 2 Issue 1 Januar y, 2014
the period 2005-2010. “With a very weak industrial sector the chances of sustaining growth through strengthening industry seems very limited currently. In addition, with power situation being very constrained there is little ability to support industrialization. Thus, only small or very niche enterprises are likely to flourish. In this respect, agro-and horticulture based industries have begun entering Bihar” (Mukherji & Mukherji, 2012). Apart from a structural transformation of the economy, the other issues, like the issue of productivity, the lack of skill generation, the absence of vocational training and the absence of job ready candidates are need to re-emphasized that can engage in growing sectors and sub-sectors of the economy. Productivity is low in Bihar. Extensive and creative investment in creating institutions to develop skills with clear links to business is imperative. Overt attempts at targeting the differential sectoral distribution between national income and the labour force are needed. Such attempts all have long gestation periods and while these investments are needed today, they will not immediately resolve the shortage of skills and productivity in Bihar. Structure of Bihar’s economy is changing not only at state level, but at district level also. And these changes need to be more casious planning and good initiatives from Govt. And the change is already in its way.
6. References
1. Basu, K. and Maertens, A. (2007): “The Pattern and Causes of Economic Growth in India”, BREAD Working Paper No. 149, April, 2007.
2. Bhattarcharya, B. B. and Sakthivel, S. (2004): “Regional Growth and Disparities in India: Comparison of Pre- and Post-Reform Decades”, Economic and Political Weekly, Vol. 39, No. 10, pp. 1071-1077.
3. Bhattacharya, D. (2000): “Bihar after Bifurcation: A Challenging Future”, Economic and Political Weekly, Vol. 35, No. 43-44, pp. 3800–3804.
4. Das Gupta, C. (2010): “Unravelling Bihar’s ‘Growth Miracle’”, Economic & Political Weekly, Vol. XLV, No. 52, December 25, 2010.
5. Dholakia, R. H. (2009): “Regional Sources of Growth Acceleration in India”, Working Paper No. 2009-03-06, Indian Institute of Management, Ahmedabad, India.
6. Fisher, A.G.B., (1939): “Production, primary, secondary and tertiary”, Economic Record, Vol. 15, pp. 24–38.
7. Fujita, K. (2012): “Development Strategy in Bihar through Revitalizing the Agricultural Sector: A Preliminary Analysis”, IDE Discussion Paper No. 332, Institute of Development Economies, JETRO, Chiba, Japan.
8. GoB (2007): Economic Survey 2006-07, Finance Department, Government of Bihar, March. 9. (2009): Economic Survey 2008-09, February, Finance Department.
10. – (2010): Economic Survey 2009-10, March, Finance Department.
11. Kalirajan, K. and Singh, K. (2013): “Understanding Sectoral Economic Growth in India: The Potential for Services”, Institutions and Economies, Vol. 5, No. 1, April 2013, pp. 91-112.
12. Kuznets, S. (1971): Nobel Prize Lecture. (Available at:
http://www.nobelprize.org/nobel_prizes/economics/laureates/1971 /kuznets-lecture.html; accessed 18th April 2012). 13. Misra, B. (2010): “Changing Dimensions of India’s Growth Process: A State Level Analysis”, MPRA Paper No. 21848,
available at http:/mpra.ub.uni-muenchen.de/21848/
14. Mukherji, A. and Mukherji, A. (2012): “Bihar: What Went Wrong? And What Changed?”, Working Paper No. 2012-107, September, 2012, National Institute of Public Finance and Policy, New Delhi.
15. Nachane, D. M., Ray, P. and Ghosh, S. (2002): “Does Monetary Policy Have Differential State-Level Effects? An Empirical Evaluation”, Economic and Political Weekly, November 23, 2002, pp. 4723 – 4728.
16. Panda, R. C. (2008): “Paradigm Shifts in Growth Perspectives of Indian Economy”, The Journal of Income and Wealth, Vol. 30, No. 1, January-June, 2008.
17. Pangotra, P. and Govil, A. (2008): “Urban Development Strategy for Bihar: A Management Perspective”, Working Paper No. 2008-04-02, Indian Institute of Management, Ahmedabad, India.
18. Saravanan, S. and Durai, A. J. (2012): “Growth Pattern Disparities: An Inter-state and Inter-state Analysis”, Atlantic Review of Economics, Vol. 2.
19. Schultz, T.W. (1978): Distortions of Agricultural Incentives, Bloomington: Indiana University Press.
20. Sharma, A. N. (2005): “Agrarian Relations and Socio-Economic Change in Bihar”, Economic and Political Weekly, March 5, 2005, pp. 960-972.
21. Shetty, S. L. (2003): “Growth of SDP and Structural Changes in State Economies: Interstate Comparisons”, Economic and Political Weekly, Vol. 38, No. 49. Pp. 5189 – 5200.
22. Shingal, A. (2013): “Growth, Convergence and Trade: The Services Sector in India’s States”, Working Paper No. 2013/33, NCCR Trade Regulation, Swiss National Centre of Competence in Research.
23. Silva, E. G. and Teixeira, A. A. C. (2008): “Surveying Structural Change: Seminal Contributions and a Bibliometric Account”, Structural Change and Economic Dynamics, Vol. 19, pp. 273-300.
24. Syrquin, M. (2005): “Kuznets and Modern Economic Growth Fifty Years Later”, WIDER Conference: Thinking Ahead: The Future of Development Economics, Helsinki, June, 2005.